A Three-Year Multi-Wavelength Study of the Very High Energy -ray Blazar 1ES 0229+200
Abstract
The high-frequency-peaked BL Lacertae object 1ES 0229+200 is a relatively distant (z = 0.1396), hard-spectrum (), very-high-energy-emitting ( 100 GeV) -ray blazar. Very-high-energy measurements of this active galactic nucleus have been used to place constraints on the intensity of the extragalactic background light and the intergalactic magnetic field. A multi-wavelength study of this object centered around very-high-energy observations by VERITAS is presented. This study obtained, over a period of three years, an 11.7 standard deviation detection and an average integral flux photons m-2 s-1, or 1.7% of the Crab Nebula’s flux (assuming the Crab Nebula spectrum measured by H.E.S.S). Supporting observations from Swift and RXTE are analyzed. The Swift observations are combined with previously published Fermi observations and the very-high-energy measurements to produce an overall spectral energy distribution which is then modeled assuming one-zone synchrotron-self-Compton emission. The probability of the TeV flux being constant is 1.6%. This, when considered in combination with measured variability in the X-ray band, and the demonstrated variability of many TeV blazars, suggests that the use of blazars such as 1ES 0229+200 for intergalactic magnetic field studies may not be straightforward and challenges models that attribute hard TeV spectra to secondary -ray production along the line of sight.
1 Introduction
The detection of the hard-spectrum, distant blazar 1ES 0229+200 (catalog ) at very high energies (VHE; 100 GeV) by H.E.S.S in 2007 (Aharonian et al., 2007c) generated excitement among the members of the VHE community, especially those members that study the extragalactic background light (EBL) and the intergalactic magnetic field (IGMF). It was well known that VHE -rays are attenuated via pair production on the mid-infrared EBL as they propagate through the Universe (Gould & Schréder, 1967; Coppi & Aharonian, 1998) and that the pairs are then deflected by the IGMF (for example, Neronov & Semikoz, 2009). However, the majority of the models of the EBL at the time postulated a strong EBL and a relatively nearby -ray horizon (for example, Stecker et al., 2006; Kneiske et al., 2002). The discovery of a hard-spectrum (spectral index smaller than 3.0) blazar at TeV energies with a well-determined redshift above 0.1 cast doubt upon the strong EBL scenario.
Distant, hard-spectrum blazars are also ideal for studies of the IGMF for similar reasons. The pairs produced in EBL interactions are deflected by the IGMF before interacting with cosmic microwave background (CMB) photons via inverse-Compton scattering (the photons produced in the inverse-Compton scatterings off of the CMB will have GeV energies). If the IGMF is not overly strong, the resulting high-energy (GeV) and VHE photons are directed along the path of the original emitted photon (for a discussion of this, see Dermer et al., 2011; Taylor, 2011; Dolag et al., 2011; Vovk et al., 2012; Arlen & Vassiliev, 2012). This effect can cause a delay in the arrival of the signal and extended emission around point sources (for a review of these processes see, for example, Neronov & Semikoz, 2009). Significant effort has been made to place limits on the IGMF using VHE and GeV blazars by comparing the flux seen in the two energy bands (for example, Dermer et al., 2011). Since the reprocessing occurs over time (the exact time depends on the IGMF strength, coherence length and distance to the source), these arguments usually depend on the VHE flux not varying, at least during the period of observation.
Ever since the discovery of 1ES 1101-232, H 2356-309 (Aharonian et al., 2006) and, H 1426+428 (Horan et al., 2002; Aharonian et al., 2003) at VHE, the community has been systematically searching for distant, hard-spectrum blazars. The discovery of 1ES 0229+200 was part of a series of VHE detections of active galactic nuclei (AGN) of this class, including 1ES 1218+304 (Albert et al., 2006), 1ES 0347-121 (Aharonian et al., 2007b), and 1ES 1101-232 (Aharonian et al., 2006). 1ES 0229+200 was especially interesting because its measured spectrum extended up to 10 TeV(Aharonian et al., 2007c). This opened up the possibility of using such observations to study the history of the Universe, instead of just AGN emission mechanisms (Aharonian et al., 2006). A complication of these types of studies is that they require several conditions: a distant source (which maximizes the attenuation length), a hard spectral index (which increases the statistics at the highest energies), knowledge about the intrinsic spectral index of the source, and, specifically in the case of IGMF studies, a constant flux, so that one can estimate the total fluence of the object over time.
The sensitivity of the current generation of VHE observatories has allowed the detection of objects at greater redshifts. This is especially pertinent to the study of the EBL, which is produced from direct and reprocessed (by dust) starlight and AGN emission (Gould & Schréder, 1967; Stecker et al., 1992). Thus, the precise measurement of the EBL informs us of the structure formation in the Universe in early times. The EBL in optical to infrared wavelengths attenuates high-energy photons through pair production (, Gould & Schréder, 1967). This directly affects the measurement of distant VHE sources by attenuating the emitted flux and softening the spectrum. It also effectively places a limit on the distance accessible by -ray studies (the -ray horizon). The converse of this is that observations of distant objects at high energy can be used to constrain the density of the EBL along the line of sight to the object (for example, see Abramowski et al., 2013; Ackermann et al., 2012). This is especially relevant as it is difficult to directly measure the EBL at the wavelengths that affect -ray photons.
1ES 0229+200 is at a redshift of z = (Woo et al., 2005) and has an archival spectral index at VHE of (Aharonian et al., 2007c). These features make it ideally suited to study the EBL. In addition, the lack of historical evidence of VHE variability was used by some authors to justify using measurements of 1ES 0229+200 to constrain the strength of the IGMF (Arlen & Vassiliev, 2012; Dermer et al., 2011; Huan et al., 2011; Neronov & Vovk, 2010; Georganopoulos et al., 2010). The original H.E.S.S. measurement, one of the first of its type, indicated that either the intrinsic spectral index of the blazar was much harder than 1.5 or the EBL density in the mid-infrared range was close to the lower limits given by Spitzer (Fazio et al., 2004) and Infrared Space Observatory data (Elbaz et al., 2002) based on galaxy counts. This measurement (along with other contemporary measurements of blazars like 1ES 1011-232 and H 2356-309) strongly disfavored many of the contemporary models of the EBL and indicated that the -ray horizon was much farther than previously thought. Over the past several years, many other population studies of VHE blazars have been done which corroborate that the EBL is close to or at the lower limits (Ackermann et al., 2012; Abramowski et al., 2013; Orr et al., 2011; Raue & Mazin, 2008). Similar efforts have been made to place limits on the IGMF. Dermer et al. (2011) compared the measurements by the Fermi-LAT with those taken at VHE and conclude that the IGMF is very small. Several of the EBL and IGMF studies include 1ES 0229+200 and many of these studies depend on a long-term ( years) steady-state flux from the source, at least during the time that the source is being monitored. However, historical data have shown that most, if not all, blazars are variable at VHE (for example, Böttcher, 2010).
Schachter et al. (1993) identified 1ES 0229+200 as a BL Lacertae object after it was discovered in the Einstein IPC Slew Survey (Elvis et al., 1992). Like most VHE blazars, it is classified as a high-synchrotron-peaked blazar (HSP) due to the location of its synchrotron peak (as defined by Ackermann et al., 2011). As mentioned before, it has a well measured redshift of z = 0.1396 (Woo et al., 2005) and is hosted by a faint elliptical galaxy ( = -24.53, Falomo et al., 2000). As early as 1996, Stecker et al. predicted that this HSP would emit VHE -rays based on its high synchrotron peak, and Costamante & Ghisellini included it in their 2002 list of possible TeV sources. However, the first generation of VHE instruments did not detect it (de la Calle Pérez et al., 2003; Aharonian et al., 2004; Williams, 2005). When first detected by H.E.S.S in 2007 it was one of the most distant VHE objects known at the time with spectral information at 10 TeV. This, plus the lack of multi-wavelength observations, prompted further study.
In this paper, we present a long-term VHE study over three seasons of this unique blazar using the Very Energetic Radiation Imaging Telescope Array System (VERITAS). We investigate the repercussions of the measurement on the EBL and IGMF and comment on this AGN’s place in the VHE blazar population.
2 VERITAS Observations and Results
2.1 Observations
VERITAS is a ground-based imaging atmospheric Cherenkov telescope (IACT) array located at the Fred Lawrence Whipple Observatory in southern Arizona. The array consists of four 12 m diameter telescopes, each with a total mirror area of 110 m2. Cameras, located 12 m in front of the dishes, contain 499 circular photomultiplier tubes (PMTs), yielding a field of view (FoV) of 3.5 degrees. Winston cones are installed in front of the PMTs to reduce the albedo and increase the light-collecting area of the camera by filling in the gaps between them. As an IACT, VERITAS detects the brief flashes of Cherenkov light produced by the particle shower induced when a -ray produces an electron-positron pair in the upper atmosphere. The reconstruction of the particle shower from the imaging of the Cherenkov flash gives the energy, time of detection and arrival direction of the initial photon. Overall, VERITAS can detect photons from 100 GeV up to 30 TeV at an energy resolution of 15% and angular resolution smaller than 0.1 degree at 1 TeV (Holder et al., 2008).
VERITAS has a three-level trigger to reduce the rate of background events from the night sky and local muons. Each shower that triggers the system is imaged by the array and stored to disk. These shower events are calibrated and cleaned using quality selections based on the number of triggered photomultiplier tubes in each image and the position of the image in the camera. Then, the shape and orientation of the Cherenkov images are parameterized by their principal moments (Hillas, 1985). These parameters are compared to Monte Carlo simulations of -ray-initiated air showers. Cuts based on the physical differences between -ray and hadronic showers, and optimized on data taken on the Crab Nebula, are used to reject a majority of the cosmic ray events (which are vastly more numerous than the -ray showers). A bright source with a flux on the order of 10% of the Crab Nebula’s flux can be detected at a significance of 5 standard deviations () in 30 minutes, while a weaker source (1% of the Crab Nebula’s flux) can be detected in hours. More details on the VERITAS array, specifically the detection and analysis techniques, can be found in Acciari et al. (2008).
| Period | Dates | Live Time | On | Off | Significance | Flux ( 300 GeV) | UL ( 300 GeV) |
| [MJD] | [minutes] | [events] | [events] | [] | [10-9 m-2 s-1] | [10-9 m-2 s-1] | |
| 2009-2012 | 55118 - 55951 | 3260 | 1917 | 15704 | 11.7 | N/A | |
| 2009-2010 | 55118 - 55212 | 1674 | 1054 | 7601 | 12.2 | 30.3 | N/A |
| 2010-2011 | 55476 - 55587 | 1079 | 614 | 5862 | 3.3 | 18.7 | N/A |
| 2011-2012 | 55828 - 55951 | 507 | 249 | 2241 | 2.9 | 9.9 | N/A |
| 2009-2010 P. 1 | 55118 - 55131 | 715 | 484 | 3210 | 9.7 | 41.8 | N/A |
| 2009-2010 P. 2 | 55144 - 55159 | 844 | 524 | 3880 | 8.1 | 24.2 | N/A |
| 2009-2010 P. 3 | 55183 - 55183 | 24 | 10 | 120 | -0.3 | 1 | 100 |
| 2009-2010 P. 4 | 55200 - 55212 | 91 | 36 | 391 | 0.1 | 3 | 51 |
| 2010-2011 P. 1 | 55476 - 55482 | 319 | 187 | 1900 | 1.0 | 15 | 41 |
| 2010-2011 P. 2 | 55501 - 55513 | 162 | 121 | 901 | 3.8 | 39 | N/A |
| 2010-2011 P. 3 | 55526 - 55538 | 127 | 69 | 692 | 0.7 | 1 | 60 |
| 2010-2011 P. 4 | 55555 - 55570 | 297 | 147 | 1490 | 1.0 | 15 | 40 |
| 2010-2011 P. 5 | 55583 - 55587 | 174 | 90 | 879 | 1.1 | 26 | 54 |
| 2011-2012 P. 1 | 55828 - 55840 | 101 | 46 | 434 | 1.0 | 13 | 66 |
| 2011-2012 P. 2 | 55855 - 55861 | 111 | 55 | 460 | 1.9 | 15 | 78 |
| 2011-2012 P. 3 | 55886 - 55895 | 119 | 68 | 608 | 1.6 | 13 | 77 |
| 2011-2012 P. 4 | 55916 - 55922 | 103 | 41 | 435 | 0.2 | -6 | 51 |
| 2011-2012 P. 5 | 55940 - 55951 | 73 | 39 | 304 | 1.9 | 16 | 100 |
The VERITAS collaboration has initiated a long-term science plan which includes the observation of relatively distant blazars with hard spectra. The goal of this strategy is to build up a database of spectral energy distributions (SEDs) from a variety of blazars whose emission can carry the signature of the EBL it traverses and to study the blazar population in greater detail. As part of this program, VERITAS observed 1ES 0229+200 for a total time of 54.3 hours from 2010 to 2012. These observations were taken over three seasons (27.9, 18.0 and 8.5 hours in 2009-2010, 2010-2011 and 2011-2012, respectively, after data quality selections for weather and other issues) and resulted in a strong detection of 11.7 . For details on the observations see Table 1. VERITAS observed this source in a wobble configuration, where the telescopes are pointed 0.5 degrees away from the source so that a simultaneous background sample can be taken along with the on-source observations (Fomin et al., 1994).
2.2 Results
These observations resulted in 1917 on-source events and 15704 off-source events. The off-source region is larger than the on-source region by a factor of eleven so the resulting excess is 489 events, corresponding to a -ray rate of photons per minute. This corresponds to an average integral flux above 300 GeV of () photons m-2 s-1 or about 1.7% of the Crab Nebula’s flux (as measured by Aharonian et al., 2006). On average, this is a similar flux to that seen by the H.E.S.S. collaboration in 2005 - 2006 (1.8% of the Crab Nebula’s flux) in 41.8 hours of observation (Aharonian et al., 2007c). A two-dimensional Gaussian fit to the VERITAS excess (VER J0232+202 (catalog )) is consistent with a point source located at R.A. = , DEC. = . This is away from the VLA position of the blazar (R.A. = , DEC. = , Schachter et al., 1993) and within the VERITAS PSF.
| E | Elow | Ehigh | Flux | Flux Error | Excess | Significance |
|---|---|---|---|---|---|---|
| [TeV] | [TeV] | [m-2 TeV-1 s-1] | [m-2 TeV-1 s-1] | [] | ||
| 0.291 | 0.240 | 0.353 | 93 | 4.5 | ||
| 0.427 | 0.353 | 0.518 | 106 | 6.7 | ||
| 0.628 | 0.518 | 0.761 | 71 | 5.6 | ||
| 0.922 | 0.761 | 1.12 | 25 | 2.6 | ||
| 1.36 | 1.12 | 1.64 | 22 | 3.0 | ||
| 1.99 | 1.64 | 2.41 | 16 | 2.7 | ||
| 2.92 | 2.41 | 3.54 | 8 | 1.8 | ||
| 4.29 | 3.54 | 5.20 | 9 | 2.6 | ||
| 7.64 | 5.20 | 11.2 | 4 | 1.2 | ||
| 16.3 | 11.2 | 24.2 | 99% upper limit | -0.7 | -0.6 |
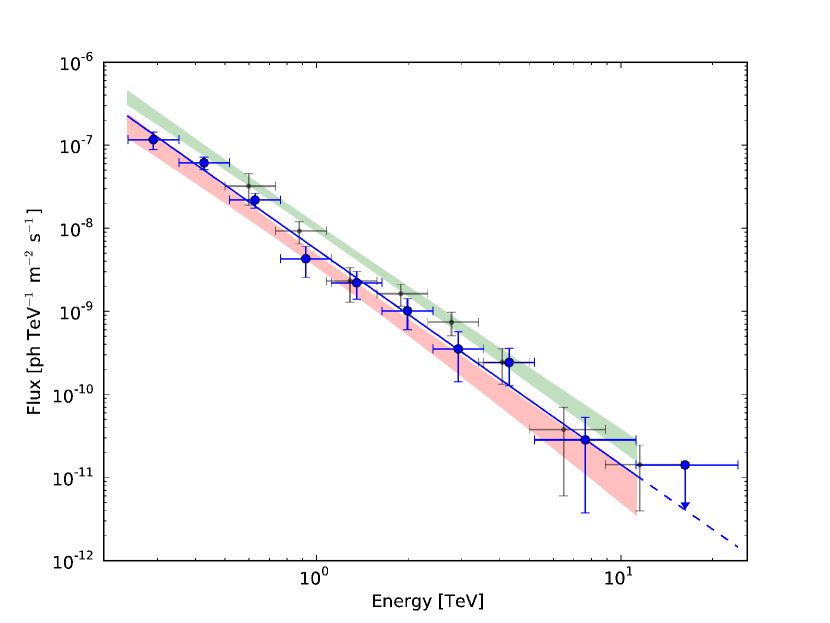
The spectrum shown in Figure 1 can be fitted with a simple power law, and the resulting normalization (at 1 TeV) and photon index are m-2 TeV-1 s-1 and respectively, with a of 5.8 with 7 degrees of freedom (the spectral analysis procedure is described in Acciari et al., 2008). The systematic errors on the normalization and index based on observations of the Crab Nebula are 20% and 10%, respectively. These results are comparable with those seen by H.E.S.S., confirming the previously measured hardness. The data for the spectral points are given in Table 2. The spectral shapes were also derived individually for the first observing period (MJD 55118 - 55131), when the flux was high, and for the remaining low periods (MJD 55144 - 55951). These are shown as shaded regions in Figure 1. No significant change is observed in the photon index. The index is during the high period and during the low period while the normalization rose from m-2 TeV-1 s-1 to m-2 TeV-1 s-1.
3 Swift Observations and Results
| Obs. ID. | Date | XRT Exp. | XRT Ind. | XRT Flux | Cstat/dof | UVOT |
|---|---|---|---|---|---|---|
| [MJD] | [s] | [] | Filter | |||
| 31249004 | 55117.305 | 969 | 132/182 | all | ||
| 31249005 | 55118.376 | 1075 | 167/210 | all | ||
| 31249006 | 55125.283 | 496 | 104/145 | w2 | ||
| 31249007 | 55126.273 | 1204 | 181/229 | m2 | ||
| 31249008 | 55127.346 | 1002 | 162/216 | w1 | ||
| 31249009 | 55128.282 | 1020 | 160/206 | uu | ||
| 31249010 | 55129.284 | 1190 | 141/190 | w2 | ||
| 31249011 | 55130.288 | 1150 | 176/215 | m2 | ||
| 31249012 | 55131.360 | 1170 | 193/240 | w1 | ||
| 31249013 | 55152.248 | 844 | 178/223 | uu | ||
| 31249014 | 55153.250 | 6770 | 206/267 | w2 | ||
| 31249015 | 55154.250 | 1242 | 238/294 | m2 | ||
| 31249016 | 55155.256 | 990 | 168/254 | w | ||
| 31249017 | 55156.259 | 826 | 178/228 | uu | ||
| 31249018 | 55157.262 | 1018 | 193/276 | w2 | ||
| 31249019 | 55158.267 | 952 | 183/228 | w2 | ||
| average | N/A | 21920 | 617/649 | mult. |
The Swift data set contains sixteen snapshot observations ranging from 505 to 1394 seconds in duration as shown in Table 3. All Swift X-ray Telescope (XRT, Burrows et al., 2005) data are reduced using the HEAsoft 6.13 package111https://heasarc.gsfc.nasa.gov/lheasoft/. Event files are calibrated and cleaned following the standard filtering criteria using the xrtpipeline task and applying the most recent Swift-XRT calibration files (Update 2012-02-09). All data were taken in window timing (WT) mode and no pile-up is seen. Rectangular source and background regions were used with a length of 40 pixels along the data stream. The XRT data were fitted with an absorbed power law using the absorption calculated by Kaufmann et al. (2011)( = ). We did not test for curvature and the goodness of fit was evaluated using the C-statistic (shown in Table 3). The hard spectrum (photon index 1.7) and UV (see below) to X-ray SED suggest that the synchrotron emission peaks above 10 keV (see Figure 5). Table 3 shows the flux and photon index measured by the XRT in the 0.2 - 10 keV energy range. Note that there is an additional 3% systematic error on the XRT flux and XRT index.222http://www.swift.ac.uk/analysis/xrt/files/SWIFT-XRT-CALDB-09_v16.pdf We fit a constant line to both the flux and index data and the for the fits to constant flux and constant index are 126 and 9.1 with 15 degrees of freedom, respectively. Thus, the Swift-XRT flux is variable at a level of 9.1 standard deviations and the probability of the photon index being constant is 87.3%. Note that this probability is quite high which indicates that the uncertainties might be overestimated. The normalized excess variance (Vaughan et al., 2003), which is an indicator of the underlying variability of the source taking into account statistical errors, of the XRT data is 0.063 0.013 corresponding to a fractional variability of 25%. The doubling time based on the change in flux between the first XRT observing period (MJD 55117 - 55131) and the second (MJD 55152 - MJD 55158) is days. However, the doubling time from the lowest flux state which occurred on MJD 55129 and the highest flux on MJD 55157 is days.
Swift Ultraviolet and Optical Telescope (UVOT, Poole et al., 2008) observations were taken in several different photometric bands since the choice of filter was left to the discretion of the Swift operations team (see Table 3 for more details). The uvotsource tool is used to extract counts, correct for coincidence losses, apply background subtraction, and calculate the source flux. The UVOT data were corrected for interstellar extinction (Seaton, 1979) and dust absorption (Schlegel et al., 1998). There is still substantial host-galaxy contamination, especially in the B and V bands, which was corrected using the correction factors derived by Kaufmann et al. (2011)333Since Kaufmann et al. did not estimate the host-galaxy contamination in the UVW1 and UVM2 filters, we assume that it can be comprised between 0 and 30% (which is the value computed for the nearby U filter). In both Figures 5 and 6, the error bars for the filters UVW1 and UVM2 include this systematic uncertainty.. Figure 5 presents both the corrected and uncorrected UVOT data for comparison. The average flux measured by UVOT (in units of ) is , , , , , (the reported errors include statistical and systematic errors summed in quadrature). The normalized excess variance in each band is a small negative number ranging from -0.07 to -0.005 indicating that any inherent variability is within the measurement errors. The UVOT data are shown in the lightcurve (Figure 3) and in the SED figure (Figure 6).
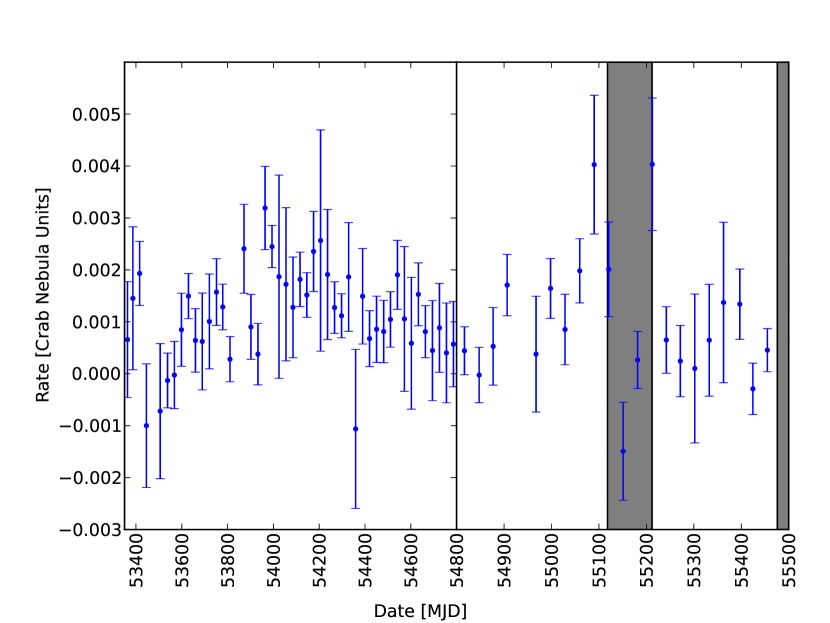
1ES 0229+200 is also in the Swift-BAT 70-month hard X-ray survey (Baumgartner et al., 2013) which includes data from December 2004 to September 2010. This survey contains sources detected in the BAT in the 14 - 195 keV band down to a significance level of 4.8 . The blazar is detected at a flux level of with a spectral index of (). Both statistical and systematic errors are included in the quoted errors above. The overall SED from the BAT is shown in Figures 5 and 6 and the 70-month light curve is shown in Figure 2. The normalized excess variance of the BAT light curve is corresponding to a fractional variability of 69%.
4 RXTE Observations and Results
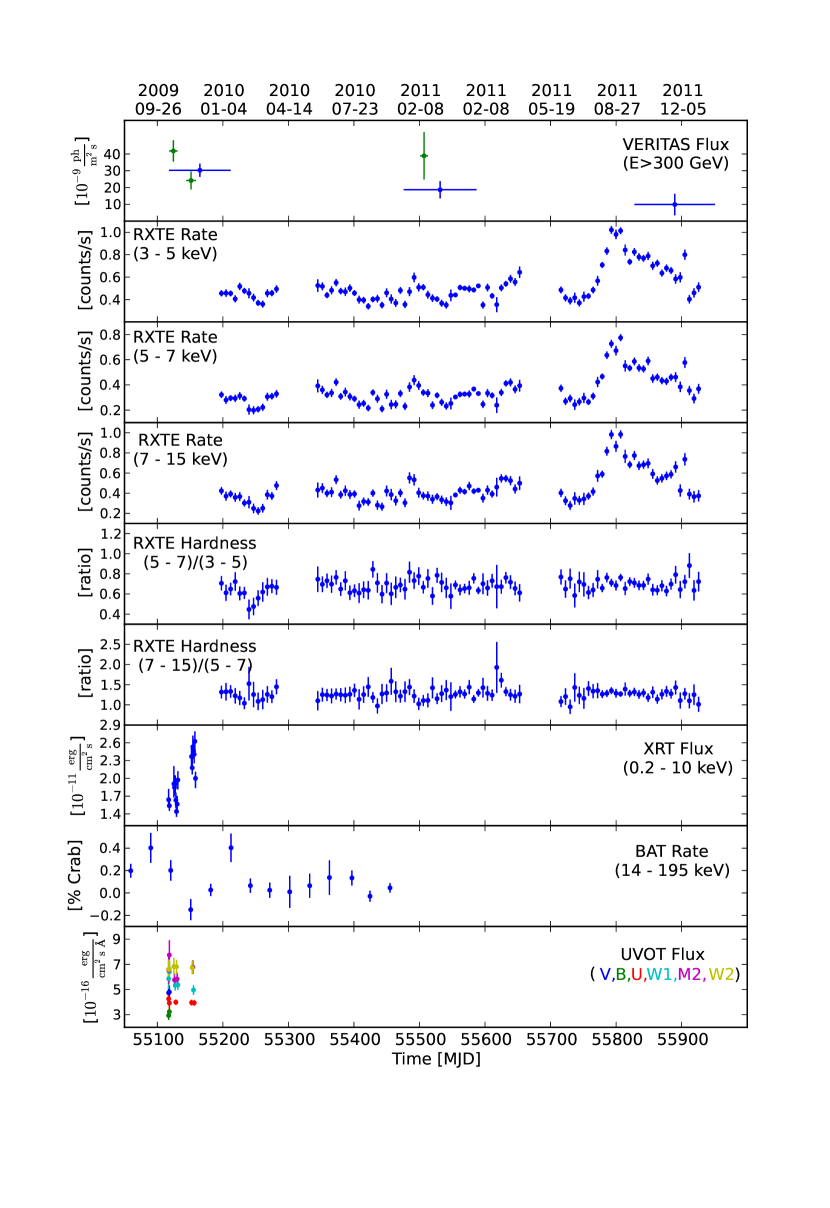
1ES 0229+200 was the target of several RXTE (Bradt et al., 1993) monitoring campaigns during the VERITAS observations. This resulted in robust coverage between 2 and 20 keV. The RXTE Proportional Counter Array (PCA) data were reduced using the HEAsoft 6.13 package and the most recent background models444August 6, 2006 release from http://heasarc.gsfc.nasa.gov/docs/xte/pca_news.html. Only data from layer 1 of PCU 2 were used, in order to maximize the signal to noise ratio. The suggested555http://heasarc.gsfc.nasa.gov/docs/xte/ conservative cuts on the Earth observation angle, pointing offset, SAA passage time, and electron contamination were used to filter the data. The spectrum in each individual campaign was fit with an absorbed ( = ) power law resulting in fluxes of and and photon indices of and with /dof of 32/26, 13/26 and 29/26 respectively. The three campaigns covered the time periods MJD 55198 to 55282, MJD 55345 to 55653 and MJD 55715 to 55926. Figure 5 shows the RXTE spectra and Figure 3 shows the count-rate light curve from the PCA in three different wavebands (the three campaigns can clearly be seen). There is significant variability in these data, including a large flare before the 2011-2012 VERITAS observing season. Hardness ratios are also plotted in Figure 3, but no significant change in the spectral shape is seen during the three years (this is confirmed by the spectral analysis above). The normalized excess variance (fractional variability) of the RXTE data is , and for the high (7 - 15 keV), mid (5 - 7 keV) and low (3 - 5 keV) bands respectively.
5 Discussion
5.1 Temporal Analysis
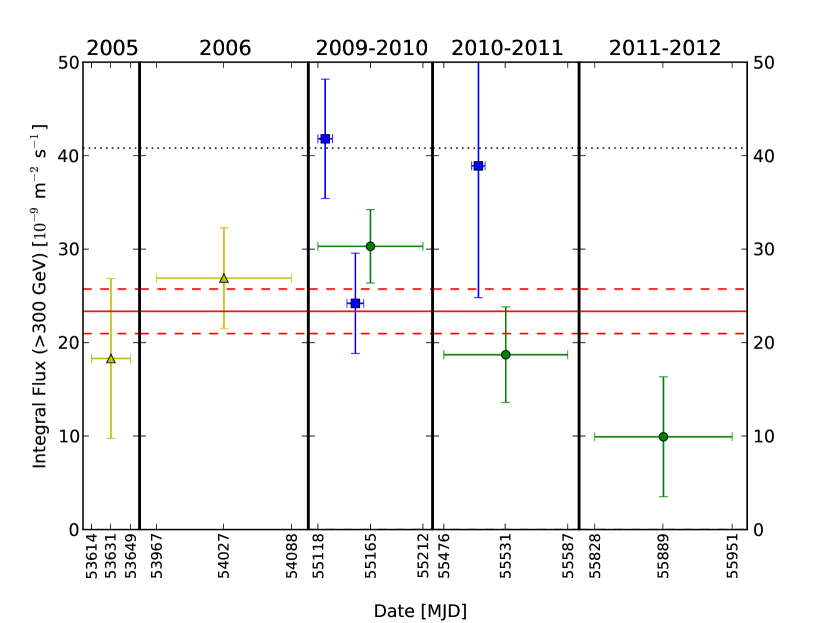
The full VHE light curve is shown in Figure 4. A fit of a constant flux to the VERITAS yearly points (shown as the solid red line in the figure, m-2 s-1) yields a of 8.32 with 2 degrees of freedom (probability of 1.6%). The blue squares in Figure 4 show the data divided into individual observing periods, for those with statistical significance above 2 sigma (all points are given in Table 1). The normalized excess variance is for the yearly binned data and for the data binned by observing period. This corresponds to a fractional variability of 200% for the yearly lightcurve and 19% for the monthly lightcurve. A fit of a constant flux to the monthly data (including all observing periods, as listed in Table 1) results in a value of 24.7 with 13 degrees of freedom or a probability of being constant of 2.5%. The evidence for variability in these data is not conclusive by itself, but, when considered in the context of a known variable source class and significant variability in the X-ray band, we consider it to be indicative of truly variable emission.
The X-ray flux as measured by Swift-XRT is variable at a level of 9.1 standard deviations and the PCA data shown in Figure 3 show evidence for variability throughout the three seasons (fractional variability 20%), including a large flare preceding the 2011-2012 VERITAS observing season. A constant flux in the RXTE data is excluded at greater than ten standard deviations in all three bands. The hard X-ray data from the BAT shown in Figure 2 display an interesting feature. Directly preceding the first season of VERITAS observations (where the highest VHE fluxes were measured), the BAT flux from 1ES 0229+200 reached a level not previously seen in the lifetime of the BAT instrument. The BAT flux then dropped to one of the lowest levels seen. The high flux was repeated at the end of the VERITAS observing season, where observations at VHE were not possible due to the full moon. If the same particle population is involved in both the high- and low-frequency emission, the X-ray variability seen in RXTE and Swift implies that variability should be seen at VHE.
Most previous studies using distant blazars to place a lower limit on the IGMF must assume that the measured VHE spectrum (exposure time on the order of tens of hours) is a good estimator of the time-averaged spectrum of the source over several years or more. Since the flux from 1ES 0229+200, and several other VHE blazars had previously been consistent with a constant-emission model, this assumption was made by some authors attempting to limit the strength of the IGMF (Arlen & Vassiliev, 2012; Dermer et al., 2011; Huan et al., 2011; Neronov & Vovk, 2010; Georganopoulos et al., 2010). However, for variable sources, the multi-year time-averaged differential flux is unknown and difficult to estimate with any reliability. Because of this inherent ambiguity, any lower limit on the IGMF derived using the measured VHE spectrum from variable sources is not robust. The observations presented here show that the constant-flux hypothesis may not be valid for 1ES 0229+200, as shown in Figure 4 and Table 1. Based on archival observations of 1ES 0229+200, Dermer et al. (2011) determined that assuming a variability time scale of years. The observations presented here show that 1ES 0229+200 is variable on at least a yearly timescale. Since the spectral shape is not changing and the derived limit scales as the square root of the time scale, we can assume that this reduces the limit by a factor of to G. The detection of variability also modifies the conclusions of Arlen & Vassiliev (2012) (who assumed that the original HESS measurement was characteristic of the average flux). They ruled out a zero IGMF hypothesis (H0) at 99% confidence based upon the 1ES 0229+200 spectrum but stated that if variability is detected in this blazar the H0 hypothesis is not ruled out at more than 95% confidence (1ES 0229+200 is the only blazar in their sample that could have rejected the H0 hypothesis).
Several authors have developed quantitative models of the plasma physics of pair cascades in the IGMF. Broderick et al. (2012) and Schlickeiser et al. (2012) place doubts on whether measurements of blazar spectra can be used to place constraints on the IGMF even if the source is non-variable since plasma instability losses dominate over inverse Compton loses. However Broderick et al. (2012) concedes that, during a flare, IC losses might dominate since instabilities have not promptly set in. Miniati & Elyiv (2013) contradict this by stating that the relaxation time of a plasma beam is much longer than the IC cooling time so that the beam can be stable and allow for secondary -ray emission. In conclusion, even if 1ES 0229+200 is non-variable, it is debatable that a meaningful constraint on the magnitude of the IGMF could be derived depending on the exact physics of the pair cascade plasma beam.
5.2 Spectral Analysis
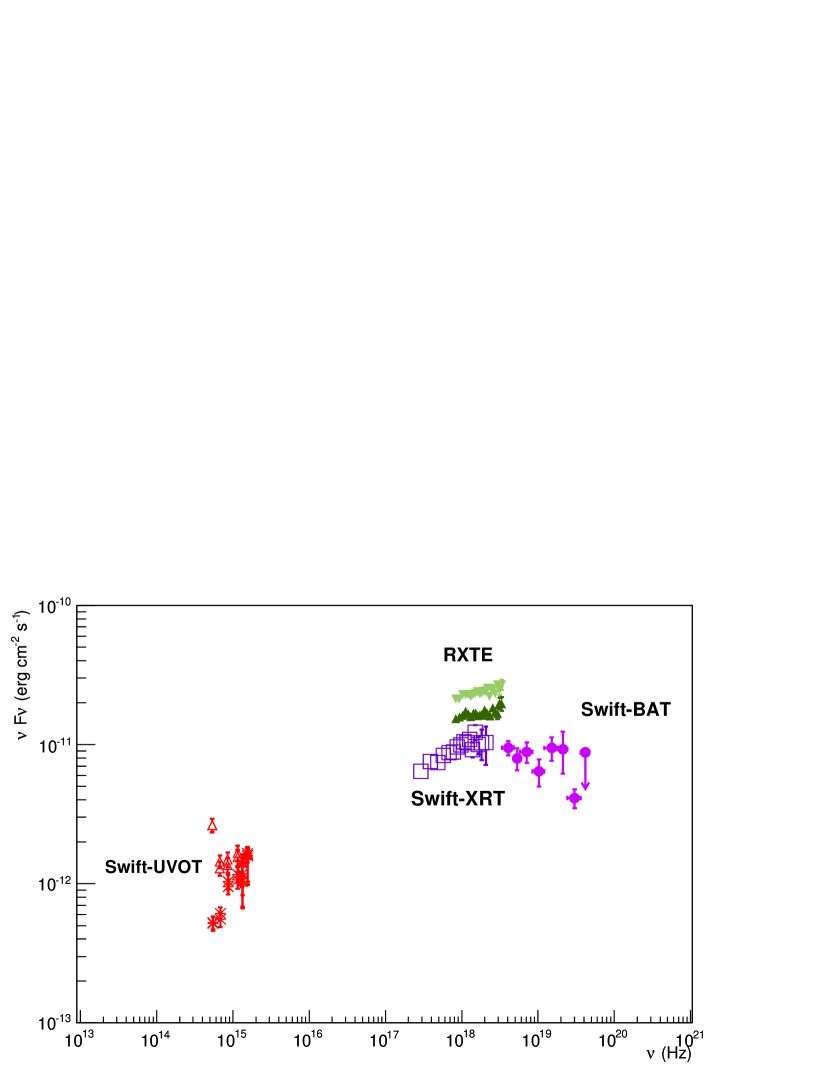
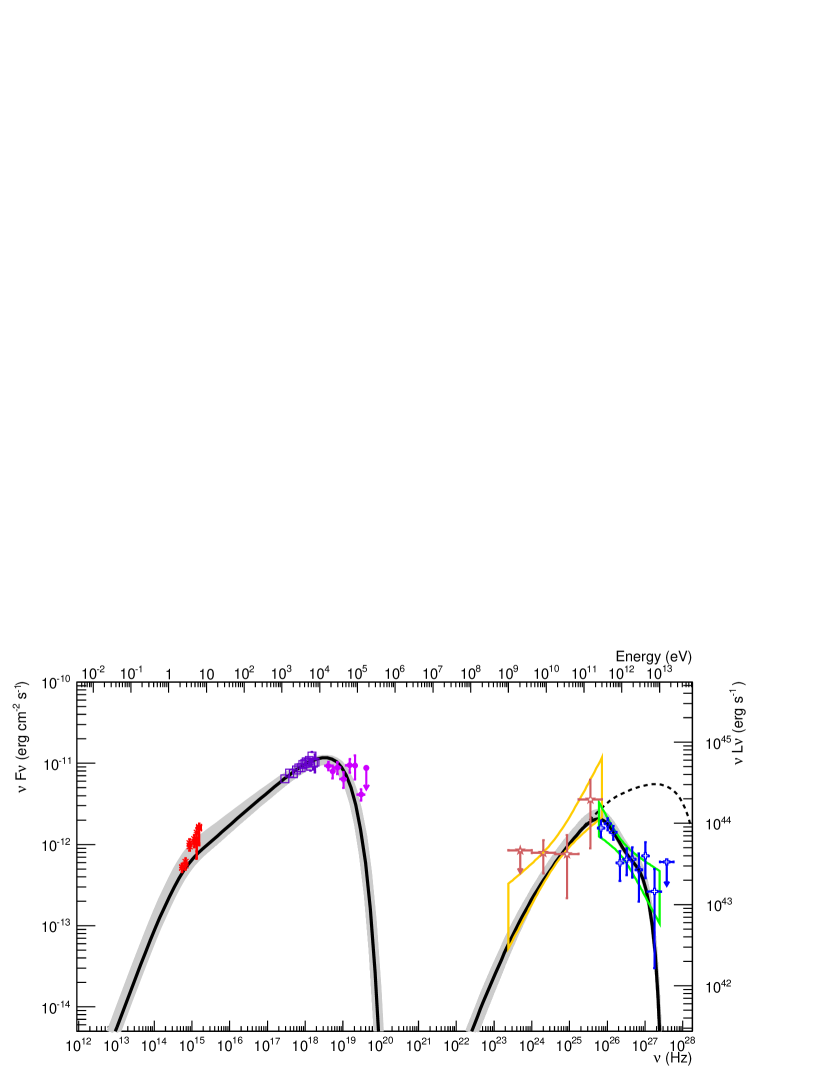
The broadband SED of 1ES 0229+200 is shown in Figure 6 and the synchrotron peak is detailed in Figure 5. The Fermi-LAT data, as well as the best-fit LAT bow-tie are reproduced from Vovk et al. (2012), where they reported a detection at the level of seven standard deviations in almost three years of observations. Vovk et al. (2012) fitted the high energy spectrum from 1 to 300 GeV using a power law with a spectral index of and normalization at 20 GeV of MeV cm-2 s-1. Note that the Swift-BAT, Fermi-LAT, and VERITAS data are long-term average spectra (70 months for the BAT, 3 years for the LAT, and VERITAS), while the Swift-XRT and UVOT data are short-term averages taken during the initial VERITAS observing season in 2009-2010. The UVOT spectral points plotted in Figure 6 have been corrected for host-galaxy contribution, using the correction factors from Kaufmann et al. (2011). The availability of Swift, Fermi, and VERITAS data allows both the low-energy and high-energy peaks to be constrained. The Swift-XRT spectrum is especially hard, indicating that the synchrotron peak is located above the XRT energy band (see Figure 5), but the additional information from the BAT suggests that the peak is located between the two bands at keV.
The SED is modeled using the one-zone synchrotron-self-Compton (SSC) code of Katarzyński et al. (2001), taking into account EBL attenuation based upon the calculations of Franceschini et al. (2008)666The Franceschini et al. EBL template used here is in agreement with the EBL measurements of both the Fermi-LAT (Ackermann et al., 2012) and H.E.S.S. collaborations (Abramowski et al., 2013). The SSC parameter space is constrained by the algorithm described in Cerruti et al. (2013), which can be seen as a numerical extension of the constraints defined by Tavecchio et al. (1998), using in addition the information from Fermi-LAT and VERITAS. The basic idea is to define a system of equations linking SSC parameters and physical observables, and to solve this system in order to determine the set of SSC parameters which correctly describes the SED. The system of equations is obtained numerically, simulating a grid of SSC models, determining for each of them the expected values of the observables, and then performing a fit to find the best parameterization of each observable as a function of the model parameters. Given the uncertainty in the physical observables, the system of equations is solved iteratively, spanning each observable in the range .
The SSC model by Katarzyński et al. (2001) assumes a spherical emission volume of radius moving towards the observer with Doppler factor , and filled with a tangled, homogeneous magnetic field and a nonthermal population of electrons and/or positrons . The particle distribution is parameterized by a single power-law function (with index and normalization ), between minimum and maximum Lorentz factors and , respectively. Note that the modeling presented here ignores any possible contribution to the SED from photons reprocessed by the IGMF.
Thus, the SSC model has seven free parameters: , and , for the emitting region, and , and , for the particle distribution, where is defined as the electron number density at . In order to determine the set of solutions which correctly describe the SED, we used seven physical observables: the synchrotron peak frequency and flux, the X-ray spectral index, the Fermi and VERITAS fluxes at their respective decorrelation energies, and the Fermi and VERITAS spectral indices.
Following Cerruti et al. (2013), we then simulated SSC models within the following parameter space: , , , , , and . The value of is fully constrained by the value of the Swift-XRT spectral index: to take into account its uncertainty we computed three different sets of solutions, for , , and . For each simulated SSC model we determined the values of the observables, producing a grid containing, for each combination of the six parameters, the corresponding values of the six observables. It is important to note that, when computing the simulated spectral index observed in the VERITAS energy range, we excluded the upper limit at TeV. In fact, given the strong EBL absorption at TeV, the simulated SSC models significantly under-estimate the VERITAS power-law fit at TeV, even though they are fully consistent with the flux upper limit.
The grid is then fitted, determining the system of equations linking parameters and observables, which is then solved for the specific case of 1ES 0229+200. We iteratively solved the system spanning the range (in logarithm, except for the Fermi and VERITAS spectral indices): Hz ([11.66,14.67] keV), erg cm-2 s-1, , , erg cm-2 s-1 and erg cm-2 s-1. For the -ray observables, the uncertainty includes systematic errors, summed in quadrature with the statistical errors. The system of equations includes an inequality relating the variability time-scale (fixed to 33 days, corresponding to the doubling time-scale measured in the Swift data) to the size and the Doppler factor of the emitting region, and we reject solutions with which would represent a strong violation of the constraints determined from radio observations of relativistic jets (see, for example, Lister et al., 2013) or from the unification model of AGN (Henri & Saugé, 2006). In order to reproduce the break observed by UVOT, we introduced in the algorithm a new observable, the break frequency , defined as the intersection of the two power-law functions fitted between and Hz, and and Hz. We then computed a new equation linking to the six free parameters. Once the set of solutions is obtained, we then select only those solutions which are characterized by Hz.
To verify the accuracy of our result we produce an SSC model for each solution and compute the with respect to the observational data (XRT, LAT and VERITAS only) in order to determine the solution that minimizes the and to check that all the solutions are included in a one sigma confidence interval.
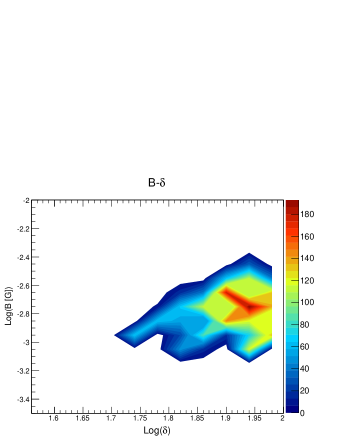
The best-fit parameter values are given in Table 4, alongside two previous modeling efforts by Tavecchio et al. (2009) and Kaufmann et al. (2011). Figure 7 details the possible values for B and . The main difference with respect to these previous models comes from the value of the synchrotron peak frequency, which, in our SED, is located between the XRT and the BAT energy bands, at Hz (12.4 keV), an order of magnitude less than that reported by Kaufmann et al. (2011) ( Hz), but more in line with what Tavecchio et al. (2009) found ( Hz). This difference arises mainly from the higher statistics in the 70-month BAT spectrum compared with the 58-month spectrum previously used. Another difference compared to the previous modeling attempts of 1ES 0229+200 in an SSC scenario is that neither Tavecchio et al. (2009) nor Kaufmann et al. (2011) had the information from the Fermi-LAT detection.
The first important result of the current modeling is that the minimum value of the Doppler factor required to fit the SED of 1ES 0229+200 is . The main observational constraint on this parameter is the hard VHE spectral index, and the solutions characterized by the lowest values of are the ones with the softest VHE emission. This value is higher than the ones commonly assumed in SSC modeling of HSPs (see, for example, Abdo et al., 2011b, a; Abramowski et al., 2012) but in agreement with the one adopted by Tavecchio et al. (2009) (), while Kaufmann et al. (2011) adopted . It should be noted that is the smallest Doppler factor that could reproduce the spectra of 1ES 0229+200 in Kaufmann et al. (2011) and larger values could also have been used which would have been more in line with this work. Our solutions show some important differences with respect to the model fit performed by Kaufmann et al. (2011); the size of the emitting region (located between and or 1.62 to 9.72 mpc) is three orders of magnitude lower than that previously derived. As a consequence, the magnetic field assumed by Kaufmann et al. (2011) is several orders of magnitude lower than the one assumed here and in Tavecchio et al. (2009). An emitting-region size of the order of - is similar to the ones inferred for the VHE HSPs 1ES 1218+304 (Weidinger & Spanier, 2010) and 1ES 1101-232 (Aharonian et al., 2007a).
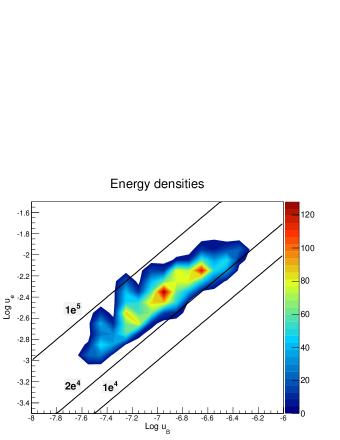
In our modeling, we found that a parameterization of the electron distribution by a single power-law function provides a good description of the SED. However, a break in the spectrum is expected in the presence of synchrotron cooling, but it is possible that the break energy is above the value of (or that the break is coincident with , i.e., that the particle distribution extends above with an index ). Following the study presented in Cerruti et al. (2013), we compared our values of to the expectations from synchrotron cooling, and we found that would be consistent with a synchrotron break only if the injected particles are escaping from the emitting region with a speed comprised between and . If instead the particles are escaping faster (), the synchrotron break is expected to be at a Lorentz factor higher than , in agreement with our modeling. Another interesting aspect is the energy budget of the emitting region. For all the solutions, we compute the values of the magnetic energy density (in CGS units) and the particle energy density . The equipartition factor is between and , implying an emitting region significantly out of equipartition (see Figure 7).
An additional point is that the value of , constrained between and , is unusually high compared to standard SSC modeling of blazars. The fact that the modeling of hard-VHE-spectrum HSPs requires such a high value of has been previously noted by Katarzyński et al. (2006), who claimed that can be a characteristic of this kind of source. Katarzyński et al. proposed two alternatives to explain a high : either the injected particle population is characterized by a low-energy cut off and no cooling mechanism is efficient enough to populate the low-energy part of the spectrum, or there is an equilibrium between the cooling and the reheating of particles due to stochastic particle acceleration.
Finally, as stated previously, if the same population of electrons is responsible for both the X-ray and VHE emission then variability at X-ray energies should imply VHE variability. In the SSC scenario a correlation between X-rays and VHE photons is naturally expected if the scattering occurs in the Thomson regime. The onset of Klein-Nishina effects can be computed as a function of the Doppler factor of the emitting region (see Tavecchio et al., 1998). For the modeling presented here, assuming , we obtain that 100 GeV photons are produced by soft X-rays in the Thomson regime, while hard X-rays (above 5 keV) are already Comptonized in the Klein-Nishina regime. On the other hand, for 10 TeV photons the scattering of X-rays is entirely (above 0.05 keV) happening in the Klein-Nishina regime. Therefore, we do expect a correlation between X-rays and -rays if the variability in X-rays is characterized by a simple variation in the overall normalization of the synchrotron component; on the other hand, if the peak of the synchrotron component shifts towards higher energies, this would not affect the measured VHE flux, nor the spectral index.
6 Summary and Conclusions
VERITAS performed a long-term observation of the VHE HSP 1ES 0229+200 from 2010 to 2012 for a total time of 54.3 hours, providing the most detailed VHE SED of this blazar to date. The overall average integral flux during this time was m-2 s-1 ( 300 GeV) and the spectrum is well described by a power law with photon index . The detected VHE emission shows evidence for variability on yearly time scales (probability of the flux being constant is 1.6%), and a period of higher flux was detected in 2009 October where the integral flux was measured to be m-2 s-1 ( 300 GeV). No significant change in spectral shape is seen.
This is the first indication of variability at VHE for this blazar and, combined with the demonstrated variability of many TeV blazars and the measured variability at X-ray energies, implies that studies of the IGMF that depend on a constant flux should not be performed using this object. At the very least, the studies must include the systematic uncertainties inherent in time-averaged SED modeling of variable sources like 1ES 1218+304, as suggested by Arlen et al. (2012). The likely detection of variability weakens the IGMF lower limits based on 1ES 0229+200 and severely complicates any IGMF interpretation.
It has been suggested that the photons detected from the direction of distant () hard-spectrum VHE blazars are actually secondary -rays produced by the interaction of primary cosmic rays of energies eV with EBL background photons (Essey et al., 2010; Murase et al., 2012). This proposal has been used to explain the detection of distant VHE blazars and to provide a possible origin of ultra-high-energy cosmic rays (Essey & Kusenko, 2012). Finding evidence for VHE variability in 1ES 0229+200 challenges these models (Prosekin et al., 2012) because the reprocessed emission is not expected to show temporal variability.
The VHE observations were supported by several multi-wavelength data sets ranging over many orders of magnitude in energy from optical to GeV. This allowed for detailed SED modeling based on the code of Katarzyński et al. (2001). The best-fit model indicates that the emission region is relatively small and that the magnetic field is relatively large compared to previous modeling attempts. The Doppler factor of 53 is similar to that found by Tavecchio et al. (2009) and Weidinger & Spanier (2010), but is greater than what was assumed by Kaufmann et al. (2011) (although larger values could also have been used in that effort).
Since we can now constrain both the synchrotron peak and the high-energy peak due to the additional BAT and VHE data, we found that the synchrotron peak is located at a lower frequency than previously thought. This means that 1ES 0229+200 has a lower IC-to-synchrotron ratio, more in line with the rest of the VHE blazar population. The high-energy peak location is similar to that of the VHE HSP 1ES 1101-232 ( Hz, Aharonian et al., 2006) but an order of magnitude higher than that of 1ES 1218+304 ( Hz, Rüger et al., 2010). These measurements should be taken as order of magnitude estimates, since the SED coverage of these two blazars is sparse and both are known to be variable.
The observations of 1ES 0229+200 presented here are part of the VERITAS long-term blazar observing program. This program was developed to build up a database of SEDs from a variety of blazars. Under these auspices, we have produced the most detailed SED measurement of this hard-spectrum distant blazar to date, and we have discovered evidence for variability at VHE. Regular VERITAS observations of 1ES 0229+200 are continuing which will be used to further characterize the SED and the nature of the underlying variability.
References
- Abdo et al. (2011a) Abdo, A. A., Ackermann, M., Ajello, M., et al. 2011a, ApJ, 736, 131
- Abdo et al. (2011b) —. 2011b, ApJ, 727, 129
- Abramowski et al. (2012) Abramowski, A., Acero, F., Aharonian, F., et al. 2012, A&A, 539, A149
- Abramowski et al. (2013) —. 2013, A&A, 550, A4
- Acciari et al. (2008) Acciari, V. A., Beilicke, M., Blaylock, G., et al. 2008, ApJ, 679, 1427
- Ackermann et al. (2011) Ackermann, M., Ajello, M., Allafort, A., et al. 2011, ApJ, 743, 171
- Ackermann et al. (2012) Ackermann, M., Ajello, M., Allafort, A., et al. 2012, Science, 338, 1190
- Aharonian et al. (2003) Aharonian, F. A., Akhperjanian, A., Beilicke, M. , et al. 2003 A&A, 403, 523
- Aharonian et al. (2004) Aharonian, F., Akhperjanian, A., Beilicke, M., et al. 2004, A&A, 421, 529
- Aharonian et al. (2006) Aharonian, F., Akhperjanian, A. G., Bazer-Bachi, A. R., et al. 2006, Astronomy and Astrophysics, 457, 899
- Aharonian et al. (2007a) —. 2007a, A&A, 470, 475
- Aharonian et al. (2007b) Aharonian, F., Akhperjanian, A. G., Barres de Almeida, U., et al. 2007b, A&A, 473, L25
- Aharonian et al. (2007c) —. 2007c, A&A, 475, L9
- Aharonian et al. (2006) Aharonian, F. A., Akhperjanian, A. G., Bazer-Bachi, A. R., et al. 2006, Nature, 440, 1018
- Albert et al. (2006) Albert, J., Aliu, E., Anderhub, H., et al. 2006, ApJ, 642, L119
- Arlen & Vassiliev (2012) Arlen, T. C., & Vassiliev, V. V. 2012, in American Institute of Physics Conference Series, Vol. 1505, American Institute of Physics Conference Series, ed. F. A. Aharonian, W. Hofmann, & F. M. Rieger, 606–609
- Arlen et al. (2012) Arlen, T. C., Vassiliev, V. V., Weisgarber, T., Wakely, S. P., & Yusef Shafi, S. 2012, ArXiv e-prints, 1210.2802
- Baumgartner et al. (2013) Baumgartner, W. H., Tueller, J., Markwardt, C. B., et al. 2013, ApJS, 207, 19
- Böttcher (2010) Böttcher, M. 2010, in Fermi Meets Jansky - AGN at Radio and Gamma-Rays, ed. T. Savolainen, E. Ros, R. W. Porcas, & J. A. Zensus
- Bradt et al. (1993) Bradt, H. V., Rothschild, R. E., & Swank, J. H. 1993, A&AS, 97, 355
- Broderick et al. (2012) Broderick, A. E., Chang, P. & Pfrommer, C., 2012, ApJ, 752, 22
- Burrows et al. (2005) Burrows, D. N., Hill, J. E., Nousek, J. A., et al. 2005, Space Science Reviews, 120, 165
- Cerruti et al. (2013) Cerruti, M., Boisson, C., & Zech, A. 2013, A&A, 558, A47
- Coppi & Aharonian (1998) Coppi, P. S., & Aharonian, F. A. 1998, in 19th Texas Symposium on Relativistic Astrophysics and Cosmology, ed. J. Paul, T. Montmerle, & E. Aubourg
- Costamante & Ghisellini (2002) Costamante, L., & Ghisellini, G. 2002, A&A, 384, 56
- de la Calle Pérez et al. (2003) de la Calle Pérez, I., Bond, I. H., Boyle, P. J., et al. 2003, ApJ, 599, 909
- Dermer et al. (2011) Dermer, C. D., Cavadini, M., Razzaque, S., et al. 2011, ApJ, 733, L21
- Dolag et al. (2011) Dolag, K., Kachelriess, M., Ostapchenko, S. & Tomàs, R. 2011, ApJ, 727, L4
- Elbaz et al. (2002) Elbaz, D., Cesarsky, C. J., Chanial, P., et al. 2002, A&A, 384, 848
- Elvis et al. (1992) Elvis, M., Plummer, D., Schachter, J., & Fabbiano, G. 1992, ApJS, 80, 257
- Essey et al. (2010) Essey, W., Kalashev, O. E., Kusenko, A., & Beacom, J. F. 2010, Physical Review Letters, 104, 141102
- Essey & Kusenko (2012) Essey, W., & Kusenko, A. 2012, ApJ, 751, L11
- Falomo et al. (2000) Falomo, R., Scarpa, R., Treves, A., & Urry, C. M. 2000, ApJ, 542, 731
- Fazio et al. (2004) Fazio, G. G., Ashby, M. L. N., Barmby, P., et al. 2004, ApJS, 154, 39
- Fomin et al. (1994) Fomin, V. P., Stepanian, A. A., Lamb, R. C., et al. 1994, Astroparticle Physics, 2, 137
- Franceschini et al. (2008) Franceschini, A., Rodighiero, G., & Vaccari, M. 2008, A&A, 487, 837
- Georganopoulos et al. (2010) Georganopoulos, M., Finke, J. D., & Reyes, L. C. 2010, ApJ, 714, L157
- Gould & Schréder (1967) Gould, R. J., & Schréder, G. P. 1967, Physical Review, 155, 1408
- Henri & Saugé (2006) Henri, G., & Saugé, L. 2006, ApJ, 640, 185
- Hillas (1985) Hillas, A. M. 1985, in International Cosmic Ray Conference, Vol. 3, International Cosmic Ray Conference, ed. F. C. Jones, 445–448
- Holder et al. (2008) Holder, J., Acciari, V. A., Aliu, E., et al. 2008, in American Institute of Physics Conference Series, Vol. 1085, American Institute of Physics Conference Series, ed. F. A. Aharonian, W. Hofmann, & F. Rieger, 657–660
- Horan et al. (2002) Horan, D., Badran, H. M., Bond, I. H., et al. 2002, ApJ, 571, 753
- Huan et al. (2011) Huan, H., Weisgarber, T., Arlen, T., & Wakely, S. P. 2011, ApJ, 735, L28
- Katarzyński et al. (2006) Katarzyński, K., Ghisellini, G., Tavecchio, F., Gracia, J., & Maraschi, L. 2006, MNRAS, 368, L52
- Katarzyński et al. (2001) Katarzyński, K., Sol, H., & Kus, A. 2001, A&A, 367, 809
- Kaufmann et al. (2011) Kaufmann, S., Wagner, S. J., Tibolla, O., & Hauser, M. 2011, A&A, 534, A130
- Kneiske et al. (2002) Kneiske, T. M., Mannheim, K., & Hartmann, D. H. 2002, A&A, 386, 1
- Lister et al. (2013) Lister, M. L., Aller, M. F., Aller, H. D., et al. 2013, AJ, 146, 120
- Miniati & Elyiv (2013) Miniati, F. and Elyiv, A. 2013, ApJ, 770, 54
- Murase et al. (2012) Murase, K., Dermer, C. D., Takami, H., & Migliori, G. 2012, ApJ, 749, 63
- Neronov & Semikoz (2009) Neronov, A., & Semikoz, D. V. 2009, Phys. Rev. D, 80, 123012
- Neronov & Vovk (2010) Neronov, A., & Vovk, I. 2010, Science, 328, 73
- Orr et al. (2011) Orr, M. R., Krennrich, F., & Dwek, E. 2011, ApJ, 733, 77
- Poole et al. (2008) Poole, T. S., Breeveld, A. A., Page, M. J., et al. 2008, MNRAS, 383, 627
- Prosekin et al. (2012) Prosekin, A., Essey, W., Kusenko, A., & Aharonian, F. 2012, ApJ, 757, 183
- Raue & Mazin (2008) Raue, M., & Mazin, D. 2008, International Journal of Modern Physics D, 17, 1515
- Rolke & López (2001) Rolke, W. A., & López, A. M. 2001, Nuclear Instruments and Methods in Physics Research A, 458, 745
- Rüger et al. (2010) Rüger, M., Spanier, F., & Mannheim, K. 2010, MNRAS, 401, 973
- Schachter et al. (1993) Schachter, J. F., Stocke, J. T., Perlman, E., et al. 1993, ApJ, 412, 541
- Schlegel et al. (1998) Schlegel, D. J., Finkbeiner, D. P., & Davis, M. 1998, ApJ, 500, 525
- Schlickeiser et al. (2012) Schlickeiser, R., Elyiv, A., Ibscher, D. & Miniati, F. 2012, ApJ, 758, 101
- Seaton (1979) Seaton, M. J. 1979, MNRAS, 187, 73P
- Stecker et al. (1992) Stecker, F. W., de Jager, O. C., & Salamon, M. H. 1992, ApJ, 390, L49
- Stecker et al. (1996) —. 1996, ApJ, 473, L75
- Stecker et al. (2006) Stecker, F. W., Malkan, M. A., & Scully, S. T. 2006, ApJ, 648, 774
- Taylor (2011) Taylor, A. M. 2011, in Cosmic Rays for Particle and Astroparticle Physics, ed. S. Giani, C. Leroy & P. G. Rancoita, 563–568
- Tavecchio et al. (1998) Tavecchio, F., Maraschi, L., & Ghisellini, G. 1998, ApJ, 509, 608
- Tavecchio et al. (2009) Tavecchio, F., Ghisellini, G., Ghirlanda, G., Costamante, L., & Franceschini, A. 2009, MNRAS, 399, L59
- Vaughan et al. (2003) Vaughan, S., Edelson, R., Warwick, R. S, & Uttley, P. 2003, MNRAS, 345, 1271
- Vovk et al. (2012) Vovk, I., Taylor, A. M., Semikoz, D., & Neronov, A. 2012, ApJ, 747, L14
- Weidinger & Spanier (2010) Weidinger, M., & Spanier, F. 2010, A&A, 515, A18
- Williams (2005) Williams, D. A. 2005, in American Institute of Physics Conference Series, Vol. 745, High Energy Gamma-Ray Astronomy, ed. F. A. Aharonian, H. J. Völk, & D. Horns, 499–504
- Woo et al. (2005) Woo, J.-H., Urry, C. M., van der Marel, R. P., Lira, P., & Maza, J. 2005, ApJ, 631, 762