The 2nd order coherence of superradiance from a Bose–Einstein condensate
Abstract
We have measured the 2-particle correlation function of atoms from a Bose–Einstein condensate participating in a superradiance process, which directly reflects the 2nd order coherence of the emitted light. We compare this correlation function with that of atoms undergoing stimulated emission. Whereas the stimulated process produces correlations resembling those of a coherent state, we find that superradiance, even in the presence of strong gain, shows a correlation function close to that of a thermal state, just as for ordinary spontaneous emission.
pacs:
03.75.Kk, 67.10.Jn, 42.50.LcEver since the publication of Dicke’s 1954 paper Dicke (1954), the problem of the collective emission of radiation has occupied many researchers in the fields of light scattering, lasers and quantum optics. Collective emission is characterized by a rate of emission which is strongly modified compared to that of the individual atoms Gross and Haroche (1982). It occurs in many different contexts: hot gases, cold gases, solids and even planetary and astrophysical environments Letokhov and Johansson (2008). The case of an enhanced rate of emission, originally dubbed superradiance, is closely connected to stimulated emission and gain, and as such resembles laser emission Siegman (1986). Lasers are typically characterized by high phase coherence but also by a stable intensity, corresponding to a Poissonian noise, or a flat 2nd order correlation function Loudon (2000). Here we present measurements showing that the coherence properties of superradiance, when it occurs in an ultracold gas and despite strong amplified emission, are much closer to those of a thermal state, with super-Poissonian intensity noise.
Research has shown that the details of collective emission depend on many parameters such as pumping configuration, dephasing and relaxation processes, sample geometry, the presence of a cavity, etc. and, as a result, a complex nomenclature has evolved including the terms superradiance, superfluorescence, amplified spontaneous emission, mirrorless lasing, and random lasing Rehler and Eberly (1971); Allen and Peters (1973); Bonifacio and Lugiato (1975); MacGillivray and Feld (1976); Gross and Haroche (1982); Siegman (1986), the distinctions among which we will not attempt to summarize here. The problem has recently seen renewed interest in the field of cold atoms Inouye et al. (1999a); Moore et al. (1999); Müstecaplioglu and You (2000); Piovella et al. (2003); Pu et al. (2003); Yoshikawa et al. (2004); Bar-Gill et al. (2007); Wang et al. (2007); Paradis et al. (2008); Hilliard et al. (2008); Meiser and Holland (2010); Deng et al. (2010); Vogt et al. (2011); Bohnet et al. (2012); Greenberg and Gauthier (2012); Baudouin et al. (2013). This is partly because cold atoms provide a reproducible, easily characterized ensemble in which Doppler broadening effects are small and relaxation is generally limited to spontaneous emission. Most cold atom experiments differ in an important way from the archetypal situation first envisioned by Dicke: instead of creating an ensemble of excited atoms at a well defined time and then allowing this ensemble to evolve freely, the sample is typically pumped during a period long compared to the relaxation time and emission lasts essentially only as long as the pumping. The authors of reference Inouye et al. (1999a) however, have argued that there is a close analogy to the Dicke problem, and we will follow them in designating this process as superradiance.
In the literature on superradiance there has been relatively little discussion about the coherence and correlation properties of the light. The theoretical treatments we are aware of show that the coherence of collective emission can be quite complicated, but does not resemble that of a laser Haake and Glauber (1972); Gross and Haroche (1982); Moore and Meystre (1999); Piovella et al. (2003); Temnov and Woggon (2009); Meiser and Holland (2010). These results, however, were obtained for simple models that do not include all parameters relevant to laboratory experiments. Experimentally, a study performed on Rydberg atoms coupled to a millimeter-wave cavity Raimond et al. (1982) showed a thermal mode occupation, and an experiment in a cold atomic vapor in free space Greenberg and Gauthier (2012) observed a non-flat 2nd order correlation function. In the present work, we show that even if the initial atomic state is a Bose–Einstein condensate (BEC), the 2nd order correlation function looks thermal rather than coherent.
Such behavior, which may seem counter-intuitive, can be understood by describing superradiance as a four wave mixing process between two matter waves and two electromagnetic waves. The initial state consists of a condensate, a coherent optical pump beam, and empty modes for the scattered atoms and the scattered photons. If we make the approximation that the condensate and the pump beam are not depleted and can be treated as classical fields, the matter-radiation interaction Hamiltonian is given by:
| (1) |
where () and () denote atom and photon creation (annihilation) operators for a specific pair of momenta fixed by energy and momentum conservation and is a coupling constant. Textbooks Gerry and Knight (2005) show that, starting from an input vacuum state, this Hamiltonian leads to a product of two-mode squeezed states. When one traces over one of the two modes, or , the remaining mode has a thermal occupation with a normalized 2-particle or 2nd order correlator
| (2) |
whereas it is unity for a laser. The problem has also been treated for four wave mixing of matter waves Mølmer et al. (2008). We emphasize that, when starting from initially empty modes, the occupation remains thermal regardless of the gain.
In the experiment, we start from initially nearly motionless atoms of a BEC and observe their recoil upon photon emission. To the extent that each recoil corresponds to the emission of a single photon, we can obtain essentially the same information about the radiation from such measurements as by observing it directly. In doing this, we are following the approach pioneered in experiments such as Raimond et al. (1982); Inouye et al. (1999a) and followed by many others, which uses highly developed atom detection and imaging techniques to glean most of the experimental information about the process. We are able to make time-integrated measurements of the emission, resolved in transverse and longitudinal momentum as well as in polarization, and reconstruct the 2-particle correlation function of the recoiling atoms, or equivalently the 2nd order correlation function of the scattered light. We will show that in the configuration of our experiment, the 2nd order correlation is close to that of a thermal sample, and very different from the correlation properties of the initial, condensed atomic state.
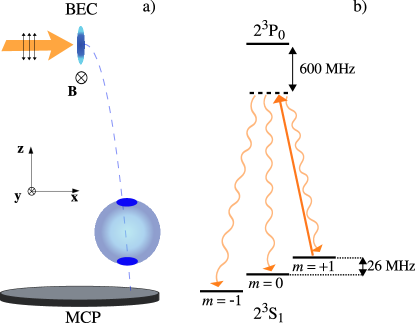
We use helium in the state confined in a crossed dipole trap (see Fig. 1a) with frequencies of 1300 Hz in the and directions and 130 Hz in the (vertical) direction. The dipole trap wavelength is m. The atom number is approximately 50 000 and the temperature of the remaining thermal cloud 140 nK. A 9 G magnetic field along the axis defines a quantization axis. After producing the condensate, we irradiate it with a laser pulse of 2.4 W/cm2 tuned 600 MHz to the red of the transition at nm and with natural linewidth 1.6 MHz. The excitation beam propagates with an angle of relative to the axis and its polarization is linear, with the same angle relative to the axis (see Fig. 1a). The pulse length is s and it is applied with a delay after switching off the trap. The expansion of the cloud during this delay is a convenient way to vary both the optical density and the anisotropy of the sample at constant atom number. The absorption dipole matrix element is of the form and thus one half of the laser intensity is coupled to the atomic transition corresponding to a Rabi frequency of 56 MHz. The excited atoms decay with equal branching ratios to the 3 ground states. During the pulse, less than 10 % of the atoms are pumped into each of these states. Because of the polarization selection rules, the atoms which are pumped into the state cannot reabsorb light from the excitation laser. By focusing on these atoms, we study the regime of “Raman superradiance” Schneble et al. (2004); Yoshikawa et al. (2004), by which we mean that an absorption and emission cycle is accompanied by a change of the internal state of the atom. When the trap is switched off, the atoms fall toward a micro-channel plate detector which detects individual atoms with 3 dimensional imaging capability and a 10 to quantum efficiency Jaskula et al. (2010). A magnetic field gradient is applied to sweep away all atoms except those scattered into the magnetic sublevel. The average time of flight to the detector is 310 ms and is long enough that the atoms’ positions at the detector reflect the atomic momenta after interaction with the excitation laser. Conservation of momentum then requires that these atoms lie on a sphere with a radius equal to the recoil momentum . Any additional scattering of light, whether from imperfect polarization of the excitation laser, or from multiple scattering by the atoms, will result in the atoms lying outside the sphere. We see no significant signal from such events, but in order to completely eliminate the possibility for multiple scattering we restrict our analysis of the data to the spherical shell with inner radius and outer radius 1.2 .
We excite atoms in an elongated BEC in such a way that an allowed emission dipole can radiate along the long axis. In an anisotropic source, collective emission builds up more efficiently in the directions of highest optical thickness. Superradiance is therefore expected to occur along the long axis of the BEC, in so called “endfire” modes Dicke (1964); Inouye et al. (1999a). An important parameter then is the Fresnel number of the sample Gross and Haroche (1982), , where and are the horizontal and vertical Thomas–Fermi radii of the condensate. The Fresnel number distinguishes between the diffraction limited () and multimode superradiance regimes (). In our case, m and m, yielding a Fresnel number of about unity.
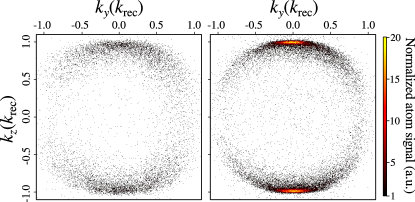
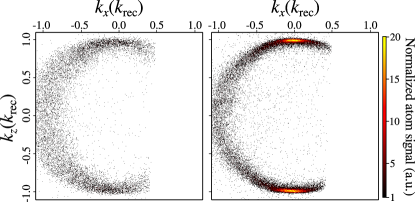
Typical cuts through the atomic momentum distribution in the plane are shown in Fig. 2, for s (left panel) and (right panel). In both cases, the spherical shell with radius appears clearly. For the short delay, when the atomic sample remains dense and anisotropic, we observe strong scattering in the endfire modes at the top and bottom poles of the sphere. In addition to this change in the profile of the distribution, we measure an increase of the total number of atoms on the sphere by a factor 5 from s to . Because each atom has scattered a single photon, this increase directly reflects an increase of the rate of emission in the sample and therefore demonstrates the collective nature of the scattering process. At long delays, the condensate has expanded sufficiently that the optical thickness and anisotropy have fallen dramatically, suppressing the collective scattering. By looking at the number of scattered atoms in the direction (perpendicular to the plane of Fig. 2), we have verified that, away from the endfire modes, the rate of emission varies by less than 10% for different delays sup .
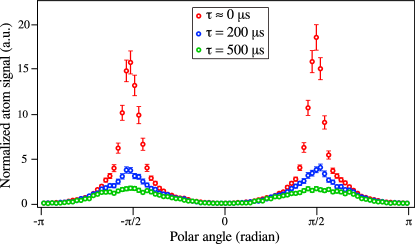
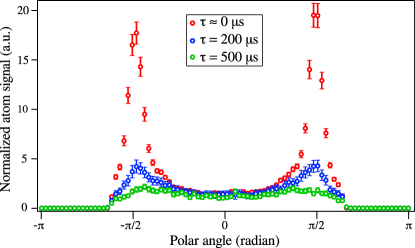
To see the distribution in a more quantitative way, we show in Fig. 3 an angular plot of the atom distribution in the plane. Data is shown for three different delays before application of the excitation pulse. For 500 s delay, the angular distribution follows the well-known “” linear dipole emission pattern with the angles and corresponding to the orientation of the dipole along the -axis sup . For 200 s delay, the superradiant peaks are already visible on top of the dipole emission profile. For the shortest delay, the half width of the superradiant peaks is , or rad, consistent with the diffraction angle and the aspect ratio of the source. In the vertical direction, the superradiant peaks are 10 times narrower than in the horizontal direction sup .
In the strongly superradiant case, we observe large and uncorrelated fluctuations of the heights of the two superradiant peaks on a shot-to-shot basis. These fluctuations directly reflect the fluctuations of the population of the superradiant modes. We investigate these fluctuations further by measuring the normalized 2-particle correlation function of the scattered atoms, defined as
| (3) |
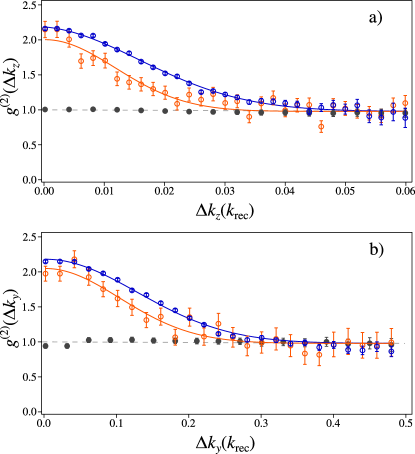
Here, is the atomic density and denotes normal ordering. In practice, this function is obtained from a histogram of pair separations normalized to the autoconvolution of the average particle momentum distribution Schellekens et al. (2005); Kheruntsyan et al. (2012). Figure 4 shows the experimentally measured correlation functions integrated over the momentum along two out of three axes, both for the superradiant peaks and on the scattering sphere away from the peaks sup .
We see that in both cases the correlation function at zero separation reaches a value close to 2. This shows clearly that, despite strong amplified emission in the endfire modes, the atoms undergoing a superradiant process have statistics comparable to that of a thermal sample. As underlined in the introduction, these large fluctuations can be simply understood by modeling the superradiant emission as a four wave mixing process; they arise from the fact that the emission is triggered by spontaneous emission. For the superradiant peaks, the correlation actually is slightly larger than 2. Similar behavior has appeared in some models Meiser and Holland (2010); Wasak et al. (2012), but these models may not be directly applicable to our situation.
Figure 4 also shows that the correlation widths of the superradiant modes are somewhat broader than those of the atoms scattered in other modes. The effect is a factor of about 1.5 in the vertical direction and about 1.25 in the horizontal direction sup . The broadening indicates that the effective source size for superradiance is slightly smaller than for spontaneous scattering. A decreased vertical source size for superradiance is consistent with the observations of Ref. Zobay and Nikolopoulos (2006); Sadler et al. (2007) which showed that the superradiant emission is concentrated near the ends of the sample. In the horizontal direction, one also expects a slightly reduced source size relative to the atom cloud since the gain is higher in the center, where the density is higher. The fact that the correlation widths are close to the widths of the momentum distribution sup indicates that the superradiant peaks are almost single mode as expected for samples with a Fresnel number close to unity Gross and Haroche (1982).
The spontaneous superradiant scattering process should be contrasted with stimulated Raman scattering. In terms of the model described by the Hamiltonian (1), stimulated Raman scattering corresponds to seeding one of the photon modes by a coherent state. In this case, vacuum fluctuations do not initiate the scattering process, and the resulting mode occupation is not thermal but coherent. To study stimulated scattering, we applied the excitation beam together with another beam polarized parallel to the magnetic field and detuned by the Zeeman shift (25 MHz) with respect to the -polarized beam, inducing a stimulated Raman transition. The laser intensities were adjusted to transfer a similar number of atoms to the state as in the superradiance experiment. The normalized correlation functions in this situation, shown in Fig. 4, are very nearly flat and equal to unity as we expect for a BEC Schellekens et al. (2005); Öttl et al. (2005); Hodgman et al. (2011). The complementary experiment, seeding the atomic mode with a coherent state has also been observed to produce a coherent amplified matter wave Inouye et al. (1999b); Kozuma et al. (1999). As a side remark, we have also observed that the superradiant atom peaks are 2.8 times narrower in the vertical direction than the vertical width of the transferred condensate sup . We attribute this to a longitudinal gain narrowing effect Moore and Meystre (1999).
We also investigated the influence of several other experimental parameters on the 2nd order coherence of the superradiant emission: We have excited the atomic sample with a longer and stronger pulse (s, 3.2 W/cm2), so that the initial condensate was entirely depleted. We have explored the Rayleigh scattering regime, in which the atoms scatter back to their initial internal state. We also changed the longitudinal confinement frequency of the BEC to 7 Hz, leading to a much greater aspect ratio. These different configurations led to 2-particle correlation functions which were very similar to the one discussed above. We believe that similar fluctuations will occur in superradiance from a thermal cloud provided that the gain in the medium is large enough. We were unable to confirm this experimentally in our system, precisely because of the vastly reduced optical density. However, non-coherent intensity fluctuations have been observed already using magneto-optically trapped atoms Greenberg and Gauthier (2012). This seems to confirm our interpretation that the large fluctuations of the superradiant mode occupation is an intrinsic property of superradiant emission, reflecting the seeding by spontaneous emission. The only way to suppress these fluctuations would be to restrict the number of scattering modes to one by means of a cavity and to saturate the gain by completely depleting the atomic cloud. The occupation of the superradiant mode would then simply reflect that of the initial atomic sample.
An interesting extension of the techniques used here is to examine superradiant Rayleigh scattering of a light pulse short enough and strong enough to populate oppositely directed modes Schneble et al. (2003). It has been predicted Piovella et al. (2003); Pu et al. (2003); Buchmann et al. (2010) that the modes propagating in opposite direction are entangled, similar to those produced in atomic four wave mixing RuGway et al. (2011); Bucker et al. (2011); Bonneau et al. (2013). A similar measurement technique should be able to reveal them.
Acknowledgements.
We acknowledge fruitful discussions with A. Browaeys, J.-J. Greffet and P. Pillet. This work was supported by the IFRAF institute, the Triangle de la Physique, the LABEX PALM, the ANR-ProQuP project, the ERC (Grant No. 267 775) Quantatop, J.R. by the DGA, R.L. by the FCT scholarship SFRH/BD/74352/2010.I Supplementary material
Distribution of atoms in the plane
The distribution of scattered atoms in the plane showed a vanishing population along the direction of the emission dipole (angles 0 and in the Fig. 3 of the main text). In the plane on the other hand, the angular distribution is, as expected, uniform between the superradiant peaks, see Fig. S1. The signal is zero on one side of each superradiant peak because the atomic cloud in the plane is off center with respect to the detector due to the recoil from the excitation laser and the part of the distribution corresponding to misses the detector as shown in Fig. S2.
Calculation of the correlation functions
The quantity actually displayed in Fig. 4 of the main text is not the correlation function as defined in Eq. 1, but the one defined by Eq. S1:
| (S1) |
The volume is defined by the boundary conditions , and by , . Integration in momentum space is performed over a specific volume for each of the three cases showed in Fig. 4:
-
•
superradiant peaks case: , and ;
-
•
scattered sphere away from the superradiant peaks: and no constraint in the plane;
-
•
stimulated Raman transfer: is the volume centered on the cloud with a width along of and no constraint in the plane.
Widths of the superradiant peaks
In order to obtain the widths of the superradiant peak, we first derive the contribution of ordinary spontaneous emission. Fig. S3 displays a close up of the superradiant peak around in the plane. The data corresponding to a long delay before application of the excitation pulse (green circles, s) are well described by a pure spontaneous emission profile , where is the polar angle in the plane (green curve). Since the contribution of the spontaneous emission should be the same for all delays, we subtract this background from the atomic signal before fitting the distribution with a Lorentzian function. The sum of the background and the fit is also displayed in Fig. S3 (blue and red curves). The choice of a Lorentzian fitting function is empirical and we expect the exact shape of the superradiant contribution to be more complex Wasak et al. (2012). From this fit we obtain half-widths at half-maximum of and rad for and s, respectively.
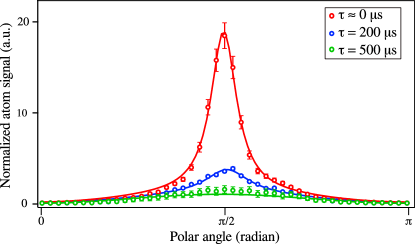
Table 1 summarizes the various widths measured in this experiment. The first three lines refer to the widths of the observed atomic distribution in momentum space. The "BEC" entry corresponds to the configuration in which the sublevel of the state was populated by stimulated Raman transfer (see main text).
| Configuration | vertical | horizontal | |
|---|---|---|---|
| BEC density | 0.039(1) | 0.190(2) | |
| Superradiance density, | 0.014(2) | 0.14(2) | |
| Superradiance density, s | 0.032(2) | 0.27(2) | |
| Superradiance correlation, | 0.021(2) | 0.15(1) | |
| Scattered sphere correlation, | 0.014(2) | 0.12(2) |
References
- Dicke (1954) R. H. Dicke, Phys. Rev. 93, 99 (1954).
- Gross and Haroche (1982) M. Gross and S. Haroche, Phys. Rep. 93, 301 (1982).
- Letokhov and Johansson (2008) V. Letokhov and S. Johansson, Astrophysical Lasers (Oxford University Press, 2008).
- Siegman (1986) A. E. Siegman, Lasers (University Science Books, Mill Valley, CA, 1986).
- Loudon (2000) R. Loudon, The quantum theory of light (Oxford University Press, Oxford; New York, 2000).
- Rehler and Eberly (1971) N. Rehler and J. Eberly, Phys. Rev. A 3, 1735 (1971).
- Allen and Peters (1973) L. Allen and G. Peters, Phys. Rev. A 8, 2031 (1973).
- Bonifacio and Lugiato (1975) R. Bonifacio and L. Lugiato, Phys. Rev. A 11, 1507 (1975).
- MacGillivray and Feld (1976) J. MacGillivray and M. Feld, Phys. Rev. A 14, 1169 (1976).
- Inouye et al. (1999a) S. Inouye, A. P. Chikkatur, D. M. Stamper-Kurn, J. Stenger, D. E. Pritchard, and W. Ketterle, Science 285, 571 (1999a).
- Moore et al. (1999) M. G. Moore, O. Zobay, and P. Meystre, Phys. Rev. A 60, 1491 (1999).
- Müstecaplioglu and You (2000) Ö. E. Müstecaplioglu and L. You, Phys. Rev. A 62, 063615 (2000).
- Piovella et al. (2003) N. Piovella, M. Cola, and R. Bonifacio, Phys. Rev. A 67, 013817 (2003).
- Pu et al. (2003) H. Pu, W. Zhang, and P. Meystre, Phys. Rev. Lett. 91, 150407 (2003).
- Yoshikawa et al. (2004) Y. Yoshikawa, T. Sugiura, Y. Torii, and T. Kuga, Phys. Rev. A 69, 041603 (2004).
- Bar-Gill et al. (2007) N. Bar-Gill, E. E. Rowen, and N. Davidson, Phys. Rev. A 76, 043603 (2007).
- Wang et al. (2007) T. Wang, S. Yelin, R. Côté, E. Eyler, S. Farooqi, P. Gould, M. Koštrun, D. Tong, and D. Vrinceanu, Phys. Rev. A 75, 033802 (2007).
- Paradis et al. (2008) E. Paradis, B. Barrett, A. Kumarakrishnan, R. Zhang, and G. Raithel, Phys. Rev. A 77, 043419 (2008).
- Hilliard et al. (2008) A. Hilliard, F. Kaminski, R. le Targat, C. Olausson, E. S. Polzik, and J. H. Müller, Phys. Rev. A 78, 051403 (2008).
- Meiser and Holland (2010) D. Meiser and M. J. Holland, Phys. Rev. A 81, 063827 (2010).
- Deng et al. (2010) L. Deng, E. W. Hagley, Q. Cao, X. Wang, X. Luo, R. Wang, M. G. Payne, F. Yang, X. Zhou, X. Chen, et al., Phys. Rev. Lett. 105, 220404 (2010).
- Vogt et al. (2011) T. Vogt, B. Lu, X. Liu, X. Xu, X. Zhou, and X. Chen, Phys. Rev. A 83, 053603 (2011).
- Bohnet et al. (2012) J. G. Bohnet, Z. Chen, J. M. Weiner, D. Meiser, M. J. Holland, and J. K. Thompson, Nature 484, 78 (2012).
- Greenberg and Gauthier (2012) J. A. Greenberg and D. J. Gauthier, Phys. Rev. A 86, 013823 (2012).
- Baudouin et al. (2013) Q. Baudouin, N. Mercadier, V. Guarrera, W. Guerin, and R. Kaiser, Nat. Phys. 9, 357 (2013).
- Haake and Glauber (1972) F. Haake and R. J. Glauber, Phys. Rev. A 5, 1457 (1972).
- Moore and Meystre (1999) M. G. Moore and P. Meystre, Phys. Rev. Lett. 83, 5202 (1999).
- Temnov and Woggon (2009) V. V. Temnov and U. Woggon, Opt. Express 17, 5774 (2009).
- Raimond et al. (1982) J.-M. Raimond, P. Goy, M. Gross, C. Fabre, and S. Haroche, Phys. Rev. Lett. 49, 1924 (1982).
- Gerry and Knight (2005) C. C. Gerry and P. Knight, Introductory quantum optics (Cambridge University Press, Cambridge, 2005).
- Mølmer et al. (2008) K. Mølmer, A. Perrin, V. Krachmalnicoff, V. Leung, D. Boiron, A. Aspect, and C. I. Westbrook, Phys. Rev. A 77, 033601 (2008).
- Schneble et al. (2004) D. Schneble, G. K. Campbell, E. W. Streed, M. Boyd, D. E. Pritchard, and W. Ketterle, Phys. Rev. A 69, 041601 (2004).
- Jaskula et al. (2010) J.-C. Jaskula, M. Bonneau, G. B. Partridge, V. Krachmalnicoff, P. Deuar, K. V. Kheruntsyan, A. Aspect, D. Boiron, and C. I. Westbrook, Phys. Rev. Lett. 105, 190402 (2010).
- Dicke (1964) R. H. Dicke, in Quantum electronics; proceedings of the third international congress, Paris., edited by P. Grivet and N. Bloembergen (Columbia University Press, 1964).
- (35) See supplemental material at http://link.aps.org/supplemental/XXX for the atomic distribution in the plane, details on the calculation of the correlation functions and a table summarizing the widths of the momentum distributions and correlation functions.
- Schellekens et al. (2005) M. Schellekens, R. Hoppeler, A. Perrin, J. V. Gomes, D. Boiron, A. Aspect, and C. I. Westbrook, Science 310, 648 (2005).
- Kheruntsyan et al. (2012) K. V. Kheruntsyan, J.-C. Jaskula, P. Deuar, M. Bonneau, G. B. Partridge, J. Ruaudel, R. Lopes, D. Boiron, and C. I. Westbrook, Phys. Rev. Lett. 108, 260401 (2012).
- Wasak et al. (2012) T. Wasak, J. Chwedeńczuk, P. Ziń, and M. Trippenbach, Phys. Rev. A 86, 043621 (2012).
- Zobay and Nikolopoulos (2006) O. Zobay and G. Nikolopoulos, Phys. Rev. A 73, 013620 (2006).
- Sadler et al. (2007) L. Sadler, J. Higbie, S. Leslie, M. Vengalattore, and D. Stamper-Kurn, Phys. Rev. Lett. 98, 110401 (2007).
- Öttl et al. (2005) A. Öttl, S. Ritter, M. Köhl, and T. Esslinger, Phys. Rev. Lett. 95, 090404 (2005).
- Hodgman et al. (2011) S. S. Hodgman, R. G. Dall, A. G. Manning, K. G. H. Baldwin, and A. G. Truscott, Science 331, 1046 (2011).
- Inouye et al. (1999b) S. Inouye, T. Pfau, S. Gupta, A. P. Chikkatur, A. Gorlitz, D. E. Pritchard, and W. Ketterle, Nature 402, 641 (1999b).
- Kozuma et al. (1999) M. Kozuma, Y. Suzuki, Y. Torii, T. Sugiura, T. Kuga, E. Hagley, and L. Deng, Science 286, 2309 (1999).
- Schneble et al. (2003) D. Schneble, Y. Torii, M. Boyd, E. W. Streed, D. E. Pritchard, and W. Ketterle, Science 300, 475 (2003).
- Buchmann et al. (2010) L. F. Buchmann, G. M. Nikolopoulos, O. Zobay, and P. Lambropoulos, Phys. Rev. A 81, 031606 (2010).
- RuGway et al. (2011) W. RuGway, S. S. Hodgman, R. G. Dall, M. T. Johnsson, and A. G. Truscott, Phys. Rev. Lett. 107, 075301 (2011).
- Bucker et al. (2011) R. Bucker, J. Grond, S. Manz, T. Berrada, T. Betz, C. Koller, U. Hohenester, T. Schumm, A. Perrin, and J. Schmiedmayer, Nat. Phys. 7, 608 (2011).
- Bonneau et al. (2013) M. Bonneau, J. Ruaudel, R. Lopes, J.-C. Jaskula, A. Aspect, D. Boiron, and C. I. Westbrook, Phys. Rev. A 87, 061603 (2013).