11email: [koichiro;niinuma]@yamaguchi-u.ac.jp 22institutetext: Research Institute for Time Studies, Yamaguchi University, 1677-1 Yoshida, Yamaguchi, Yamaguchi 753-8511, Japan
22email: [kenta;motogi]@yamaguchi-u.ac.jp 33institutetext: The Institute of Space and Astronautical Science, Japan Aerospace Exploration Agency, 3-1-1 Yoshinodai,
Chuou-ku, Sagamihara, Kanagawa 252-5210, Japan
33email: [akihiro.doi;murata]@vsop.isas.jaxa.jp 44institutetext: Department of Space and Astronautical Science, The Graduate University for Advanced Studies, 3-1-1 Yoshinodai,
Chuou-ku, Sagamihara, Kanagawa 252-5210, Japan 55institutetext: VERA Project, National Astronomical Observatory of Japan (NAOJ), 2-21-1 Osawa, Mitaka, Tokyo 181-8588, Japan
55email: [mareki.honma;hideyuki.kobayashi]@nao.ac.jp 66institutetext: Department of Astronomical Science, Graduate University for Advanced Studies, 2-21-1 Osawa, Mitaka, Tokyo 181-8588, Japan 77institutetext: Mizusawa VLBI Observatory, NAOJ, 2-12 Hoshigaoka-cho, Mizusawa-ku, Oshu, Iwate 023-0861, Japan
77email: satoko.ss@nao.ac.jp 88institutetext: Department of Physical Science, School of Science, Osaka Prefecture University, 1-1 Gakuen-cho, Nakaku,
Sakai, Osaka 599-8531, Japan
88email: ogawa@p.s.osakafu-u.ac.jp 99institutetext: Shanghai Astronomical Observatory, Chinese Academy of Sciences, 80 Nandan Road, Shanghai, 200030, China
99email: kwajima@shao.ac.cn 1010institutetext: School of Mathematics and Physics, University of Tasmania, Private Bag 37, Hobart, Tasmania 7001, Australia
1010email: Simon.Ellingsen@utas.edu.au
Rotating and infalling motion around the high-mass young stellar object Cepheus A-HW2 observed with the methanol maser at 6.7 GHz
Abstract
Context. Proper motion observations of masers can provide information on dynamic motions on scales of a few milliarcsecond per year (mas yr-1) at radii of 100–1000 au scales from central young stellar objects (YSOs).
Aims. The 6.7 GHz methanol masers are one of the best probes for investigations of the dynamics of high-mass YSOs, and in particular for tracing the rotating disk. We have measured the internal proper motions of the 6.7 GHz methanol masers associated with Cepheus A (Cep A) HW2 using Very Long Baseline Interferometery (VLBI) observations.
Methods. We conducted three epochs of VLBI monitoring observations of the 6.7 GHz methanol masers in Cep A-HW2 with the Japanese VLBI Network (JVN) over the period between 2006–2008. In 2006, we were able to use phase-referencing to measure the absolute coordinates of the maser emission with an accuracy of a few milliarcseconds. We compared the maser distribution with other molecular line observations that trace the rotating disk.
Results. We measured the internal proper motions for 29 methanol maser spots, of which 19 were identified at all three epochs and the remaining ten at only two epochs. The magnitude of proper motions ranged from 0.2 to 7.4 km s-1, with an average of 3.1 km s-1. Although there are large uncertainties in the observed internal proper motions of the methanol maser spots in Cep A, they are well fitted by a disk that includes both rotation and infall velocity components. The derived rotation and infall velocities at the disk radius of 680 au are and km s-1, respectively.
Conclusions. Assuming that the modeled disk motion accurately represents the accretion disk around the Cep A-HW2 high-mass YSO, we estimated the mass infall rate to be ( is the gas volume density in units of ). The combination of the estimated mass infall rate and the magnitude of the fitted infall velocity suggests that Cep A-HW2 is at an evolutionary phase of active gas accretion from the disk onto the central high-mass YSO. The infall momentum rate is estimated to be , which is larger than the estimated stellar radiation pressure of the HW2 object, supporting the hypothesis that this object is in an active gas accretion phase.
Key Words.:
Stars: formation – ISM: individual (Cepheus A) – masers: methanol – instrumentation: high angular resolution1 Introduction
In the last decade, high-resolution interferometric observations at submillimeter wavelengths have demonstrated the existence of rotating disks around high-mass young stellar objects (YSOs) (e.g., Cesaroni et al. 1997, 1999; Patel et al. 2005). These observations have shown that the spatial distribution of dust, or that of hot molecular core tracers (e.g., CH3CN lines) are elongated perpendicular to the direction of a radio jet or large-scale outflow, and that radial velocity gradients are observed along the direction of elongation. The recently developed capability to make near-infrared interferometric observations has been utilized to demonstrate the existence of a compact dusty disk (20 au) around the high-mass YSO IRAS 134816124 (Kraus et al. 2010). Kraus et al. found that the disk in IRAS 134816124 has a similar radial temperature gradient and scale for the dust-free region to those observed in low-mass star formation regions. A direct measurement of the distribution and 3-D motion of gas in a disk associated with a high-mass star represents the next step to be undertaken in studies of this type of object.
Molecular maser emission is potentially a useful tool for investigating the distribution and motion of gas around YSOs. The maser emission is typically compact (linear scales of 1–10 au), has a high brightness temperature ( K), and narrow line width ( km s-1). In particular, studies of the internal proper motion of individual maser spots (the compact emission centers detected at a given velocity channel) with Very Long Baseline Interferometery (VLBI) can provide directly information on the motion of the masing gas on scales of a few milliarcsecond per year (mas yr-1). Among the various common interstellar masers, the methanol masers at 6.7 GHz are perhaps the best probe of the gas motion around high-mass YSOs. This is because the 6.7 GHz methanol masers are only associated with high-mass star formation (Minier et al. 2003; Xu et al. 2008), the individual maser features have a long lifetime (van der Walt 2005; Ellingsen 2007), and they are typically associated with star formation regions at an early evolutionary phase prior to the formation of an ultra-compact (UC) H II region (Walsh et al. 1998; Minier et al. 2005; Ellingsen 2006). Interferometric imaging surveys of 6.7 GHz methanol masers (Norris et al. 1993; Phillips et al. 1998; Walsh et al. 1998; Minier et al. 2000; Sugiyama et al. 2008b; Bartkiewicz et al. 2009; De Buizer 2003; Dodson et al. 2004) show that they are often associated with disks and shocks around high-mass YSOs. Recently, Bartkiewicz et al. (2009) showed that nine of the 31 sources they observed (30%) have a ring-like morphology. They applied a disk model with rotation and expansion/contraction to the observed maser distribution and radial velocities and noted that, in general, the expansion/contraction velocity was larger than the rotation component. However, because the velocity was measured only along the line-of-sight (l.o.s.) the Bartkiewicz et al. models are poorly constrained due to geometrical ambiguity. Measuring the internal proper motions of the maser spots is required to derive the gas motion around the YSOs without ambiguity.
Rotational motion associated with a disk has been demonstrated by measuring the internal proper motions in a few methanol masers (Sanna et al. 2010a, b; Moscadelli et al. 2011), while outflow motion has been measured in other methanol sources (Rygl et al. 2010; Sugiyama et al. 2011; Matsumoto et al. 2011; Sawada-Satoh et al. 2013). Goddi et al. (2011) directly detected infall motion with a velocity of 5 km s-1 in the molecular envelope of the high-mass YSO AFGL 5142 MM-1 at a radius of 300 au.
The 6.7 GHz methanol masers associated with Cep A-HW2 represent one of the best targets for measuring the rotation and infall motions through an accretion disk toward a high-mass YSO. The high-mass star-forming region Cep A is located at a close distance of 0.70 kpc (Moscadelli et al. 2009; Dzib et al. 2011). The HW2 object is the brightest source in the Cep A complex contributing half of the total luminosity of the region (Evans et al. 1981; Rodriguez et al. 1994; Hughes et al. 1995; Garay et al. 1996). The binding mass enclosed in HW2 is estimated to be (Patel et al. 2005; Jiménez-Serra et al. 2009) and a fast, bipolar, highly collimated radio jet is being ejected from the HW2 YSO at an ejection velocity km s-1, size au, and position angle (PA) (Curiel et al. 2006). Observations of both dust and CH3CN line emission made with the Submillimeter Array (SMA) show a rotating disklike structure elongated perpendicularly to the radio jet, and with a l.o.s. velocity gradient along the direction of elongation (Patel et al. 2005). This discovery has been confirmed through investigations of the spatial distribution and velocity gradients of NH3, SO2, and HC3N emission (Torrelles et al. 2007; Jiménez-Serra et al. 2007, 2009).
Observations of the 6.7 GHz methanol maser emission show an elliptical morphology, with the HW2 YSO at the center of the ellipse (Sugiyama et al. 2008a; Vlemmings et al. 2010; Torstensson et al. 2011b). The elliptical distribution of the masers is similar to that observed in the molecular and dust emission and the size of the ellipse (1300–1400 au) is similar to that of the CH3CN and the NH3 disks. Torstensson et al. (2011b) fitted a ring model with rotation and infall motions (Uscanga et al. 2008) to the observed methanol maser positions and l.o.s. velocities, and derived an infall velocity of km s-1 and a rotation velocity of km s-1. Torstensson et al. concluded that the infall component of velocity prevailed over the rotation component. Vlemmings et al. (2010) determined the 3-D magnetic field structure around HW2 and found the magnetic field to lie perpendicular to the molecular and dust disks, indicating that the magnetic field likely regulates the accretion onto the disk.
We have conducted VLBI monitoring observations of the 6.7 GHz methanol masers in Cep A-HW2, using the Japanese VLBI Network (JVN: Fujisawa 2008) at three epochs spanning 779 days, to measure the maser internal proper motions. We describe these observations and the details of data reduction in section 2. In section 3, we show the maser spatial distribution and internal proper motions. Finally, we discuss the interpretation of the measured motion of the methanol masers in section 4.
2 Observations and data reduction
| Epoch | Date and Time | Telescopes∗*∗*Telescope code — YM: Yamaguchi, UD: Usuda, MZ: VERA-Mizusawa, IR: VERA-Iriki, OG: VERA-Ogasawara, IG: VERA-Ishigaki. | 1 | Synthesized beam | |||
| PA | |||||||
| (yyyy/mm/dd, UT) | (hr) | (Jy beam-1) | (masmas) | () | |||
| 1 | 2006/09/09, 14:3022:00 | YM, UD, MZ, IG | 2.8 | 0.06 | 9.44.3 | 70 | 84 |
| 2 | 2007/07/28, 14:0022:00 | YM, UD, MZ, IR, IG | 2.1 | 0.09 | 9.24.3 | 43 | 92 |
| 3 | 2008/10/25, 10:0018:00 | YM, MZ, IR, OG, IG | 1.6 | 0.12 | 7.03.9 | 79 | 60 |
We made the JVN observations at three epochs: 2006 September 9, 2007 July 28, and 2008 October 25. The results of the imaging from the first epoch were reported by Sugiyama et al. (2008a). The array for each epoch consisted of four or five of the following radio telescopes: Yamaguchi 32 m, Usuda 64 m, and VERA (four 20 m stations: Mizusawa, Iriki, Ogasawara, and Ishigaki). The telescopes used in each observation are listed in Table 1 along with other relevant observational parameters, such as the duration of the observation and the size of the synthesized beam. The projected baselines ranged from 6 M (Yamaguchi–Iriki) to 50 M (Mizusawa–Ishigaki), corresponding to fringe spacings of 34.4 mas and 4.1 mas at 6.7 GHz, respectively.
We made the observations using phase-referencing to determine the absolute position of the 6.7 GHz masers in Cep A with an accuracy of a few milliarcseconds. We used the extragalactic continuum source J23026405 (2.19 from Cep A) as the phase calibrator. We determined the coordinates of J23026405 to an accuracy of 0.62 mas in the third VLBA Calibrator Survey catalog (VCS3: Petrov et al. 2005). The observation strategy employed in all epochs was to alternate between the position of the Cep A methanol masers and the phase calibrator with a cycle time of 5 min (2 min on Cep A, 1.6 min on the continuum source and 1.4 min slewing between sources). The total on-source times were 2.8, 2.1, and 1.6 h for Cep A and 0.7, 1.0, and 0.9 h for J23026405 in epochs 1 to 3, respectively. The absolute coordinates obtained at the first epoch were previously reported by Sugiyama et al. (2008a). The nearby radio continuum sources J23225057 and J01025824, and the strong continuum sources 3C454.3 and 3C84, selected from the International Celestial Reference Frame (ICRF: Ma et al. 1998; Fey et al. 2004), were also observed every 1.5 hour for clock (delay and rate) and bandpass calibration, respectively.
For the first epoch, we observed left-circular polarization (LCP) at the Yamaguchi and Usuda stations, while received linear polarization at the Mizusawa and Ishigaki stations. At the following epochs, we observed LCP at Yamaguchi, Usuda, Mizusawa, and Ishigaki stations, while received linear polarization at the Ogasawara and Iriki stations. Employing a bandwidth of 32 MHz, we recorded the data to magnetic tape using the VSOP-terminal system at a data rate of 128 Mbps with 2-bit quantization, and correlated at the Mitaka FX correlator (Shibata et al. 1998). From the recorded 32 MHz bandwidth, we correlated 2 MHz (6668–6670 MHz) and 4 MHz (6666–6670 MHz) sub-bands with 512 and 1024 spectral channels for epochs 1 and epochs 2/3, respectively. Both spectral setups yielded a channel spacing of 0.18 km s-1. The VLBI data were reduced using the Astronomical Image Processing System (AIPS: Greisen 2003) using the same procedure described in Sugiyama et al. (2008b), which includes special amplitude calibration for different polarization correlations (circular/linear, linear/linear). The image rms noise (1 ) in a line-free channel was 0.06, 0.09, and 0.12 Jy beam-1 for epochs 1, 2, and 3, respectively, as listed in Table 1. Phase-referencing was successful only at the first epoch with the best image sensitivity.
We performed single-dish observations using the Yamaguchi 32 m telescope to enable absolute flux calibration of the VLBI observations. We made the single-dish observations on 2006 September 7, 2007 August 5, and 2008 November 5, respectively, each of them separated by at most ten days from the corresponding VLBI epoch. The flux density calibration template spectrum for each epoch is shown in Figure 1. The channel spacing of these single-dish observations was four times higher than that of the VLBI data, i.e., 0.044 km s-1. In 2007, the 6.7 GHz methanol masers in Cep A were observed to show rapid variations in flux density within a 30 day period (Sugiyama et al. 2008a). Assuming that flux density variations of up to 50% within 30 days are possible, we estimate the absolute flux density calibration for the VLBI observations to be accurate to 20–30%. The estimated uncertainty is calculated from the accuracy of the absolute flux calibration for the single-dish, at 15–20%, and the expected maximum flux variation within 10 days, at 15–20%. For each epoch, the amplitude calibration was performed by fitting the telescope total-power spectra to the single-dish template spectrum.
We used the brightest 6.7 GHz maser emission at a local standard of rest (LSR) velocity of 2.60 km s-1 as the reference maser spot (Sugiyama et al. 2008a) in fringe fitting, and applied the phase solution from this spectral channel to the visibilities of all velocity channels. We searched for maser emission over an area of using the Difmap software (Shepherd 1997) by model fitting the visibility data with point sources and iteratively self-calibrating. We determined the peak positions and intensities of maser spots by fitting an elliptical Gaussian brightness distribution to the emission pattern in each spectral channel using the task JMFIT in AIPS. We used one or more independent Gaussian components with about the same dimensions as the synthesized beam to prevent the fitted Gaussians from being significantly larger than the beam. Maser components are considered real if detected with signal-to-noise ratio (SNR) at similar (within the beam FWHM) positions in two or more consecutive channels. Maser structure is not resolved even on the longer baselines, and the correlated flux density recovered from the final images contains more than 80% of the single-dish flux density.
3 Results
3.1 Spatial distributions
We detected 84, 92, and 60 methanol maser spots in epochs 1, 2, and 3, respectively. The total number of observed, distinct maser spots is 131 if we take the fact that many spots are observed at more than one epoch into account. The spot peak intensities range from 0.4 to 92.2 Jy beam-1. The lower number of detected spots in our first epoch run, compared with the observation by Sugiyama et al. (2008a), is due to our higher detection threshold to select spots strong enough to allow for an accurate measure of the proper motion. Maser variability, as evidenced by the single-dish spectra, can explain the different number of maser detections over the three observing epochs. The parameters of each maser spot, as derived by the Gaussian fit, are summarized in Table LABEL:longtab1, which lists: the ID number of each maser spot and cluster; the relative positional offset with respect to the reference spot (ID 53) (and estimated uncertainty); the spot LSR velocity; the internal proper motion (and estimated uncertainty) and the tangential velocity (converted on the basis of a source distance of 0.70 kpc); and the peak intensity at each epoch.
The spatial distribution of the 6.7 GHz methanol maser spots in Cep A is shown in Figure 2 and includes all 131 spots detected in at least one epoch and listed in Table LABEL:longtab1. The absolute coordinates of the reference maser emission at 2.60 km s-1 was measured by Sugiyama et al. (2008a) to be , , with a positional uncertainy of less than 1 mas. The reference maser spot (at the origin of Fig. 2) was the brightest at all epochs. Our result is consistent with previous published images of the 6.7 GHz methanol masers in Cep A observed by Sugiyama et al. (2008a), Vlemmings et al. (2010), and Torstensson et al. (2011b). The methanol maser spots in Cep A are arranged in a number of isolated clusters, which we have labeled I to V using the same designation as Sugiyama et al. (2008a).
The 6.7 GHz maser spots in Cep A are distributed along a curved line with size 1900 mas, corresponding to 1400 au at a distance of 0.70 kpc. The peak of the 43 GHz continuum emission, corresponding to the likely location of the YSO (Curiel et al. 2006), is located near the center of the curved line. The elongation of the maser line is nearly perpendicular to the sky-projected axis of the high-velocity collimated radio jet. The position, size, and orientation of the 6.7 GHz maser distribution agrees with that of the molecular disk observed in CH3CN and NH3 lines (Patel et al. 2005; Torrelles et al. 2007), and the velocity range covered by the 6.7 GHz masers is similar to that of these lines. Although we found a simple velocity gradient along the major axis of elongation is not observed in the maser emission. We fitted the observed distribution of maser spots at each epoch with an ellipse. The parameters of the fit for each epoch are summarized in Table 2. The fitted parameters are the center of the ellipse relative to the reference position , the length of the semi-major axis of the ellipse , the position angle of the major axis PAmj (north is , and counterclockwise is positive), and the inclination angle . The inclination angle is determined by assuming that the maser distribution is circular and the observer is looking at it obliquely (face-on corresponds to ). The fit ellipse parameters are consistent with those derived from observations with the Multi-Element Radio Linked Interferometer Network of Vlemmings et al. (2010) and with the European VLBI Network of Torstensson et al. (2011b), who found au, PA, and au, PA, , respectively.


| Epoch | Coordinates | PAmj | |||
| (mas) | (mas) | (au) | () | () | |
| 1 | 436 | 118 | 680 | 110 | 73 |
| 2 | 385 | 125 | 756 | 114 | 75 |
| 3 | 378 | 141 | 720 | 112 | 74 |
3.2 Proper motion
To establish the correspondence of maser spots observed at all the three epochs, we set the following criteria: i) LSR velocity to be the same to within the velocity width of a single spectral channel (0.18 km s-1), ii) relative positions of the three epochs to differ by less than 9.6 mas (corresponding to 15 km s-1 at 0.70 kpc, which is equivalent to three times the LSR velocity range), iii) stable intensity for the maser spectrum consisting of a maser spot and its nearby companions (within 10 mas) to avoid the “Christmas tree effect” (see below), iv) spots assumed to move approximately along a straight line in both RA and Dec directions. The purpose of the third criterion listed above is to ensure that the proper motions are real, and not due to the “Christmas tree effect,” where changes in the relative intensity of nearby maser spots with similar LSR velocity mimic proper motion. However, in the case where the derived proper motions are not parallel with the line connecting the nearby maser spots, we accept these proper motions as real gas motions even if the third criterion is not satisfied. Proper motions of spots identified in only two of the three epochs are considered only for spots persistent over consecutive epochs (i.e., between the first and second epoch and the second and third epoch, but not between the first and third epoch). The maximum allowed tangential velocity of 15 km s-1 fixes the maximum position change between the epochs to 4.0 mas for maser spots observed only in the first and second epoch, and 5.6 mas for those observed only in the second and third epoch. After identifying all spots that satisfy the maximum tangential velocity two-epoch criteria, we compared their amplitude and direction of motion with that of nearby, three epoch persistent, linearly moving spots. Only two-epoch spots, which have proper motions similar (both in amplitude and direction) to those of nearby three-epoch spots, were included in the final analysis. In the case of cluster V, the two-epoch proper motions were accepted if the amplitude of the tangential velocities were similar to those of three-epoch persistent, linearly moving spots in other clusters. Most of the accepted proper motions in cluster V move toward E-SE. On the basis of these criteria, 19 maser spots were found to be persistent over the three epochs, six spots between the first and the second epoch, and four spots between the second and third epoch. In total, we have 29 persistent maser spots and of these nine are associated with cluster I/II (located near the origin), three with cluster III, seven with cluster IV, and ten with cluster V.
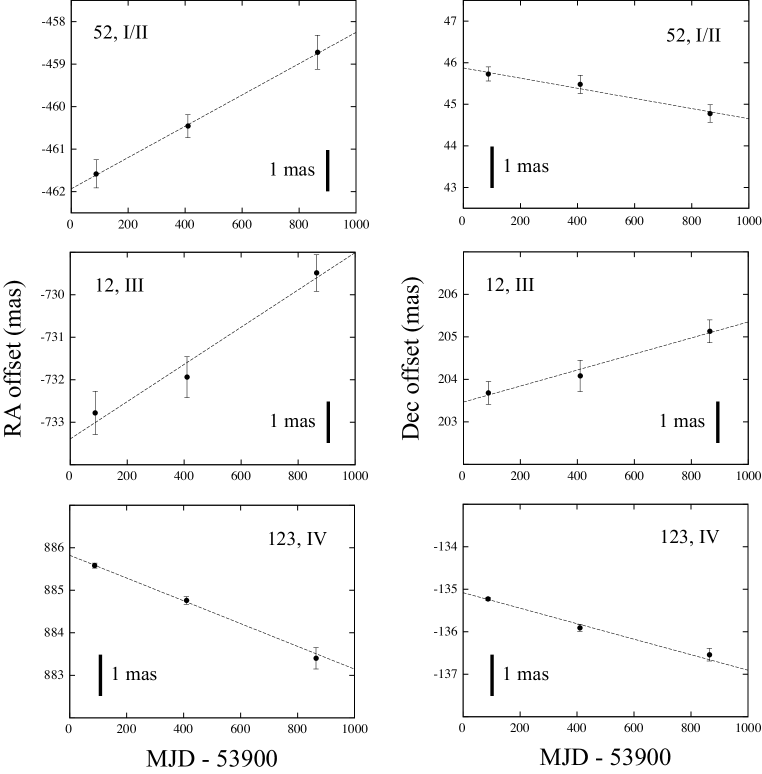
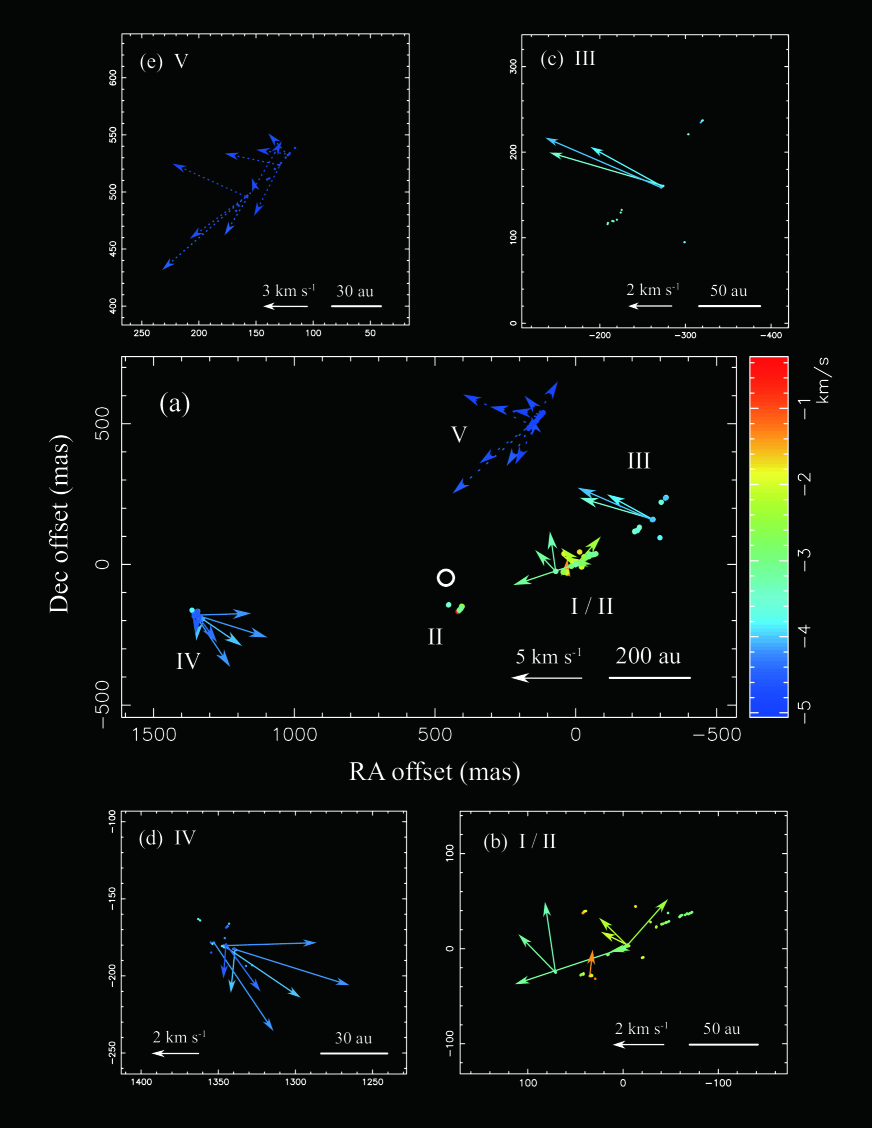
Internal proper motions are measured relative to the barycenter, defined as the average position of the 19 spots persistent over the three epochs. The barycenter position relative to the reference maser spot at km s-1 is estimated to be [461.01, 45.05] mas, [461.02, 45.39] mas, and [460.71, 44.97] mas in epochs 1, 2, and 3, respectively. The subtraction of the average position in each epoch is effective in removing random errors owing to the changes in the reference spot structure. Proper motions are estimated by fitting a straight line to the positional offsets with respect to time. Linear fits for representative maser spots in each cluster are shown in Figure 3 to demonstrate the general quality of the fits. The measured internal proper motions are given in columns 8-13 in Table LABEL:longtab1. The tangential velocities () vary in the range of km s-1 with an average of 3.1 km s-1. The measured internal proper motion vectors are shown in Figure 4. The barycenter of epoch 1 is indicated by an open circle in this figure. This figure shows that the observed proper motions have a large (apparently random) scatter, particularly for cluster I/II, with no coherent motions readily apparent on these scales.
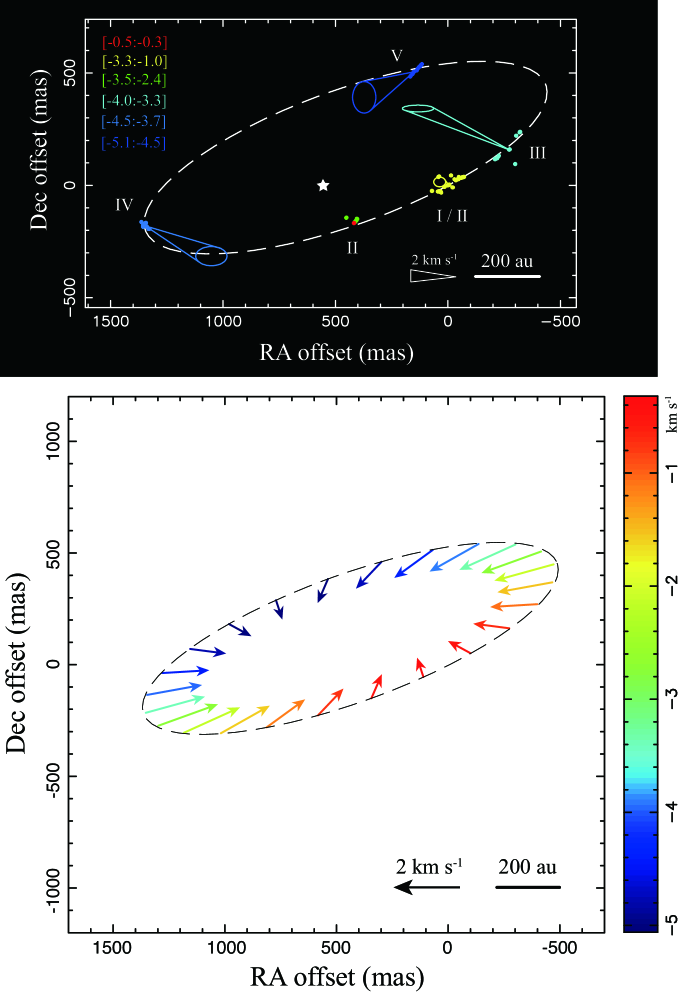
Taking the average of the proper motions of spots belonging to maser clusters I-V, we derived the maser cluster proper motions listed in Table 3, and shown in the upper-panel of Figure 5. All the vectors, except that for cluster I/II, show rotation in a counterclockwise direction around the ellipse center. In addition, all the cluster proper motion vectors are directed toward the inside of the maser ellipse.
| Cluster | ||||
|---|---|---|---|---|
| (km s-1) | (km s-1) | (km s-1) | ||
| I/II | [3.3, 1.0] | 9 | ||
| II | [0.5, 0.3] | |||
| [3.5, 2.4] | ||||
| III | [4.0, 3.3] | 3 | ||
| IV | [4.5, 3.7] | 7 | ||
| V | [5.1, 4.5] | 10 |
4 Discussion
4.1 Rotating and infalling motions around Cep A-HW2
| Coordinates (J2000.0) | PAmj | ||||
| RA | Dec | ||||
| () | () | (au) | () | () | |
| Maser | 22 56 17.97 | 62 01 49.7 | 680 | 110 | 73 |
| CH3CN | 22 56 17.96 | 62 01 49.6 | 560 | 124 | 68 |
The ellipse fitted to the methanol maser emission has very similar parameters to the disk traced by the CH3CN emission (Patel et al. 2005), although the radius of the maser ellipse is slightly larger than that of the CH3CN disk (see Table 4). This close agreement supports the hypothesis that the 6.7 GHz methanol masers around Cep A-HW2 are associated with the CH3CN and NH3 disks.
We have fit a model of a rotating and expanding/contracting disk to the positions and 3-D velocities of the 6.7 GHz masers. The model was applied to the 29 maser spots for which we measured the internal proper motions, under the assumption that all of the spots lie on a circular ring. The rotation velocity , the expansion velocity , and the systemic velocity of the model were related to the observed velocities as follows:
where are the tangential velocities along the ellipse major and minor axis and is the l.o.s. velocity, is the angle between the position vector to the spot and the ellipse major axis, and the inclination angle of the disk. The factors and can be expressed with and , where is the semi-major axis and and are the coordinates along the major and minor axis of the ellipse, respectively. The parameters and are given by:
where and are the position offsets of the maser relative to the reference spot along the RA and Dec axis, respectively, and are the position offsets of the center of the ellipse and is the position angle of the ellipse major-axis. Similar conversion formulae apply for the tangential velocity components as follows:
where and are the components of the tangential velocity along the RA and Dec axis, respectively.
The ellipse parameters (), (), , PAmj, and are derived and fixed from the first epoch data (Table 2). The model parameters are derived by taking the partial derivative of Equation (1) with respect to , , , respectively, and solving for when it is set equal to 0:
| (1) |
In Equation (1), is the number of maser spots, and are the components of the tangential velocity of the maser spot with ID (projected along the ellipse major and minor axis), is the LSR velocity, and is a weighting factor calculated as . The factors are the estimated uncertainties in the tangential velocity components and , the uncertainty in the LSR velocity, was set to the spectral-channel spacing (0.18 km s-1).
We derived the best-fit parameters from the data , and km s-1, respectively. The negative expansion velocity indicates infall. The uncertainties for each fit parameter were estimated by finding the variation from the best-fit value for which the value increased by 10%. As a test of the reliability of the barycenter as the reference for the proper motions, we redid the fit, including among the derived model parameters the tangential velocity of the reference maser spot, and using spot velocities relative to the reference maser spot as inputs to the model. From this test, we are able to estimate that the fitted velocity of the barycenter is zero within an uncertainty of km s-1. This uncertainty is smaller than the model-fit error, which confirms that the barycenter is a suitable reference system for the proper motions.
We applied the same model to the cluster-averaged proper motions listed in Table 3, and obtained best-fit parameters , , km s-1, which are consistent with those derived using all 29 spots within the estimated uncertainties. In the following discussion, we use the best-fit parameters derived with the 29 spots.
The lower-panel in Figure 5 shows the velocity distribution of the fitted model. The fitted model is superposed on the maser distribution and the detected proper motions in Figure 6. The tangential velocity of all the maser clusters is reproduced within the relatively large uncertainties. Considering the l.o.s. velocity, maser clusters I/II (located near the origin), II, IV, and V are in good agreement with the model within the uncertainties. The difference in the l.o.s. velocity between observation and the model for cluster III may be caused by random motions due to turbulence driven by the magneto-rotational instability (see Section 4.2 for further discussion).
The detected internal proper motions provide the information necessary to resolve the ambiguity in the geometry of the accretion disk and the high-velocity radio jet in Cep A-HW2. Since cluster V is located on the far side, and cluster I/II is on the near side of the accretion disk, the north-east component of the radio jet must be ejected in the direction of the observer (if it is assumed that the jet is ejected in a direction nearly perpendicular to the disk). This geometry is consistent with that inferred from the 3-D magnetic field structure determined by Vlemmings et al. (2010), and also with the blue- and red-shifted lobes of the outflow detected in the CO line emission (blue: north-east, red: south-west, e.g., Rodriguez et al. 1980; Cunningham et al. 2009). The high-velocity radio jet is likely powering the low-velocity CO outflow.
We note that there is a discrepancy in the geometry derived here and that determined from the time delay in the synchronized flux density variations measured by Sugiyama et al. (2008a). Sugiyama et al. observed methanol maser spectral features I-V to show rapid flux density variation, with the flux variation of different spectral features occurring with small delays. Time delays of 2, 1, 6, and 4 days (with respect to the strongest feature II) were observed for spectral features I, III, IV, and V, respectively. Under the assumption that the flux density variations are intrinsically synchronized and the time delay is caused by the light-crossing time, the observed time delay suggests that cluster V is located on the near side of the disk, i.e., the reverse geometry to that inferred from the proper motions. We do not currently have a satisfactory explanation for the disagreement between these two independent results. In the following, we investigate further the implications of the rotating and infalling disk model based on our proper motion observations.

4.2 Mass accretion
The fitted rotation velocity of 0.5 km s-1 is less than half of the observed LSR velocity range ( to km s-1). On the other hand, the infall velocity of 1.8 km s-1 estimated from our model is closer to half of the LSR velocity range. This suggests that the infall motions dominate over rotation, at least in the vicinity of the masing zone (around a radius of 700 au). This implies that the Cep A-HW2 region is in an evolutionary phase characterized by active gas accretion from the disk onto the high-mass YSO.
The mass infall rate can be estimated, using a method similar to that employed by Goddi et al. 2011, by using the equation , where is the radius of the maser ring, are the volume density and mass of molecular hydrogen, is the infall velocity onto the central YSO, and . The parameter is the opening angle from the central YSO to the edge of the disk. Vlemmings et al. (2010) estimated the thickness of the maser disk to be 300 au, which implies . If we assume that au and km s-1, we obtain , where is the gas volume density in units of . Observations of thermal methanol lines in Cep A imply a gas density of at the masing site (Torstensson et al. 2011a). However, Torstensson et al. note that the derived gas volume density might be diluted by the large beam () of their observations. Considering the dilution factor, the true gas volume density could be within a region around the Cep A-HW2 object. A gas volume density of is also consistent with the values required by the models of methanol maser excitation (Cragg et al. 2005). Our mass infall rate is similar to that estimated by Goddi et al. (2011) from their observations of the high-mass star forming region AFGL5142. As indicated in the following calculations, this mass infall rate is high enough to continue mass accretion onto a central high-mass YSO and so this region could be forming a central star of (Hosokawa & Omukai 2009; Hosokawa et al. 2010).
Our observations and model fitting estimate the infall momentum rate to be . On the other hand, the momentum output rate produced by the stellar radiation pressure can be estimated using , where is the stellar luminosity, the average optical depth of accreting gas, and the velocity of light. Taking for the Cep A-HW2 object and as an upper limit in a typical star forming region (Lamers & Cassinell 1999), the momentum output rate of the stellar radiation pressure is estimated to be . Consequently, the infall momentum rate exceeds the stellar radiation pressure (), which is consistent with the infall motion observed at the radius of the maser emission.
The infall might be caused by the transportation of angular momentum owing to turbulence driven by the magneto-rotational instability (Balbus & Hawley 1991). The turbulent velocity can be estimated from a comparison of the magnetic energy density with the kinetic energy density due to the turbulence . The magnetic energy density at the masing site can be estimated using the equation , where is the magnetic field strength and the magnetic permeability in a vacuum. Taking mG ( T) at the masing site in Cep A-HW2, as measured by Vlemmings (2008), the magnetic energy density is . In the case of , the turbulent velocity can be estimated to be 1.3 km s-1. The estimated turbulent velocity is comparable with the turbulent linewidth of 1.1 km s-1 calculated using the maser polarization, radiative transfer model for the methanol masers in Cep A-HW2 (Vlemmings et al. 2010). This level of turbulence exceeds the estimated uncertainties for the disk model velocities (0.7 km s-1). Consequently, it is plausible that random motions could be caused by magnetically-induced turbulence and could account for the differences between the model and observed maser velocities occurring in some parts of the system. This turbulence could be responsible for the measured infall velocities in maser regions, where the fitted rotational velocity of 0.5 km s-1 is smaller than the Keplerian velocity gradient of 6 km s-1 derived from the l.o.s. velocity of the CH3CN line emission.
The differences observed in the kinematics of the 6.7 GHz methanol maser and CH3CN line emissions, despite the very similar ring structures traced in both emissions (see Table 4), might be due to their arising in different locations within the disk because of differing gas volume densities. The 6.7 GHz methanol masers can arise at high densities () and may occur in infalling gas located at the mid-plane of the disk, where dense neutral materials are self-shielded from ionizing photons and can participate in the gas accretion onto the central YSO (e.g., Bik et al. 2008). On the other hand, the CH3CN emission is associated with moderate density gas () and may arise on the surface of the disk where it is strongly affected by the ionizing photon pressure. It is difficult for the gas in these regions to be accreted and hence no infall motions are expected.
4.3 Enclosed mass
If we assume Keplarian rotation of the maser disk then we can estimate the enclosed mass using the expression , where G is the gravitational constant. For (implied from our modeling), this yields an enclosed mass of . An alternative method for calculating the enclosed mass uses the free fall velocity and the equation . For , the implied enclosed mass is . Both of these estimates are significantly smaller than those of a high-mass star (), and they are also much smaller than the enclosed mass inferred from the velocity gradient observed in the CH3CN line emissions (). We discuss two possible explanations as to why the masses estimated from the 3-D velocities of the methanol masers may be smaller than those determined from the thermal lines: radiation pressure and magnetic pressure. If the infall momentum rate is roughly equal to the momentum output rate produced by a stellar radiation pressure (i.e. ), the apparent enclosed mass will approach in the free fall model. For Cep A-HW2, we have shown that is only a factor 2 or so higher than (see Section 4.2), and thus radiation pressure may play a role in supporting the cloud against infall, which in turn reduces the apparent enclosed mass. To see if magnetic pressure provides an alternative explanation, we need to compare the kinetic energy density (due to the rotation of the methanol gas) to the magnetic energy density. The kinetic energy density of the methanol gas is given by , which equates to for Cep A-HW2. The magnetic energy density at the masing site is estimated to be (see Section 4.2). Since , the disk gas may be partially supported by the magnetic field at the radius of the maser ring in which case the rotation speed estimated from the methanol maser would be slower than that for the CH3CN emission. This is predicted by the magnetic braking theory (which appears to work for low-mass star formation regions), according to which an efficient way of transporting angular momentum is through outgoing helical Alfvn waves (Basu & Mouschovias 1994). For high-mass star formation Peters et al. (2011) suggest that magnetic braking might become qualitatively important for the local accretion onto YSOs, despite it being of minor importance for the global gas dynamics. This magnetic support may be occurring only at the higher densities associated with the maser-gas clouds (), while not being relevant in the moderately dense CH3CN gas regions (), if scales with the empirical relation (Crutcher 1999; Vlemmings 2008). This hypothesis can be tested in the near future through dust polarization measurement with the SMA to derive more accurate values of and in the CH3CN emission region.
5 Conclusions
We have used three epochs of JVN observations over the period between 2006–2008 (spanning a total of 779 days) to measure the spatial distribution and internal proper motions of the 6.7 GHz methanol maser spots associated with the Cep A-HW2 YSO. The maser spots were found to be distributed in a curved structure surrounding the HW2 object, similar to previous results obtained by other authors. The maser distribution closely matches that of the observed CH3CN and NH3 disks in terms of the position, size, elongation, and the range of the radial velocities.
We measured internal proper motions in a total of 29 maser spots, and the amplitude of the proper motions ranged from 0.2 to 7.4 km s-1, with an average value of 3.1 km s-1. The detected motions were modeled as originating in a disk with both rotation and infall velocity components. The derived rotation and infalling velocities at the disk radius of 680 au for our observations are km s-1 and km s-1, respectively. The magnitude of the infall velocity compared to the rotational component suggests that the Cep A-HW2 object is at an evolutionary phase where there is active gas accretion from the disk onto the central high-mass YSO. The mass infall rate estimated from the derived infall velocity is consistent with the possibility of the HW2 object having a final mass of , and the infall momentum rate appears sufficient to overcome the stellar radiation pressure.
Acknowledgements.
The authors thank the JVN team for assistance and support during the observations. The authors also thank the anonymous referee for many useful suggestions and comments, which improved this paper. The JVN project is led by the National Astronomical Observatory of Japan, which is a branch of the National Institutes of Natural Sciences, Hokkaido University, The University of Tsukuba, Ibaraki University, Gifu University, Osaka Prefecture University, Yamaguchi University, and Kagoshima University, in cooperation with the Geospatial Information Authority of Japan, the Japan Aerospace Exploration Agency, and the National Institute of Information and Communications Technology.References
- Balbus & Hawley (1991) Balbus, S. A. & Hawley, J. F. 1991, ApJ, 376, 214
- Bartkiewicz et al. (2009) Bartkiewicz, A., Szymczak, M., van Langevelde, H. J., Richards, A. M. S., & Pihlström, Y. M. 2009, A&A, 502, 155
- Basu & Mouschovias (1994) Basu, S. & Mouschovias, T. C. 1994, ApJ, 432, 720
- Bik et al. (2008) Bik, A., Lenorzer, A., Thi, W. F., et al. 2008, in Astronomical Society of the Pacific Conference Series, Vol. 387, Massive Star Formation: Observations Confront Theory, ed. H. Beuther, H. Linz, & T. Henning, 78
- Cesaroni et al. (1999) Cesaroni, R., Felli, M., Jenness, T., et al. 1999, A&A, 345, 949
- Cesaroni et al. (1997) Cesaroni, R., Felli, M., Testi, L., Walmsley, C. M., & Olmi, L. 1997, A&A, 325, 725
- Cragg et al. (2005) Cragg, D. M., Sobolev, A. M., & Godfrey, P. D. 2005, MNRAS, 360, 533
- Crutcher (1999) Crutcher, R. M. 1999, ApJ, 520, 706
- Cunningham et al. (2009) Cunningham, N. J., Moeckel, N., & Bally, J. 2009, ApJ, 692, 943
- Curiel et al. (2006) Curiel, S., Ho, P. T. P., Patel, N. A., et al. 2006, ApJ, 638, 878
- De Buizer (2003) De Buizer, J. M. 2003, MNRAS, 341, 277
- Dodson et al. (2004) Dodson, R., Ojha, R., & Ellingsen, S. P. 2004, MNRAS, 351, 779
- Dzib et al. (2011) Dzib, S., Loinard, L., Rodríguez, L. F., Mioduszewski, A. J., & Torres, R. M. 2011, ApJ, 733, 71
- Ellingsen (2006) Ellingsen, S. P. 2006, ApJ, 638, 241
- Ellingsen (2007) Ellingsen, S. P. 2007, MNRAS, 377, 571
- Evans et al. (1981) Evans, II, N. J., Slovak, M. H., Becklin, E. E., et al. 1981, ApJ, 244, 115
- Fey et al. (2004) Fey, A. L., Ma, C., Arias, E. F., et al. 2004, AJ, 127, 3587
- Fujisawa (2008) Fujisawa, K. 2008, in The role of VLBI in the Golden Age for Radio Astronomy
- Garay et al. (1996) Garay, G., Ramirez, S., Rodriguez, L. F., Curiel, S., & Torrelles, J. M. 1996, ApJ, 459, 193
- Goddi et al. (2011) Goddi, C., Moscadelli, L., & Sanna, A. 2011, A&A, 535, L8
- Greisen (2003) Greisen, E. W. 2003, Information Handling in Astronomy - Historical Vistas, 285, 109
- Hosokawa & Omukai (2009) Hosokawa, T. & Omukai, K. 2009, ApJ, 691, 823
- Hosokawa et al. (2010) Hosokawa, T., Yorke, H. W., & Omukai, K. 2010, ApJ, 721, 478
- Hughes et al. (1995) Hughes, V. A., Cohen, R. J., & Garrington, S. 1995, MNRAS, 272, 469
- Jiménez-Serra et al. (2009) Jiménez-Serra, I., Martín-Pintado, J., Caselli, P., et al. 2009, ApJ, 703, L157
- Jiménez-Serra et al. (2007) Jiménez-Serra, I., Martín-Pintado, J., Rodríguez-Franco, A., et al. 2007, ApJ, 661, L187
- Kraus et al. (2010) Kraus, S., Hofmann, K.-H., Menten, K. M., et al. 2010, Nature, 466, 339
- Lamers & Cassinell (1999) Lamers, H. J. G. L. M. & Cassinell, J. P. 1999, Irish Astronomical Journal, 26, 171
- Ma et al. (1998) Ma, C., Arias, E. F., Eubanks, T. M., et al. 1998, AJ, 116, 516
- Matsumoto et al. (2011) Matsumoto, N., Honma, M., Isono, Y., et al. 2011, PASJ, 63, 1345
- Minier et al. (2000) Minier, V., Booth, R. S., & Conway, J. E. 2000, A&A, 362, 1093
- Minier et al. (2005) Minier, V., Burton, M. G., Hill, T., et al. 2005, A&A, 429, 945
- Minier et al. (2003) Minier, V., Ellingsen, S. P., Norris, R. P., & Booth, R. S. 2003, A&A, 403, 1095
- Moscadelli et al. (2011) Moscadelli, L., Cesaroni, R., Rioja, M. J., Dodson, R., & Reid, M. J. 2011, A&A, 526, A66+
- Moscadelli et al. (2009) Moscadelli, L., Reid, M. J., Menten, K. M., et al. 2009, ApJ, 693, 406
- Norris et al. (1993) Norris, R. P., Whiteoak, J. B., Caswell, J. L., Wieringa, M. H., & Gough, R. G. 1993, ApJ, 412, 222
- Patel et al. (2005) Patel, N. A., Curiel, S., Sridharan, T. K., et al. 2005, Nature, 437, 109
- Peters et al. (2011) Peters, T., Banerjee, R., Klessen, R. S., & Mac Low, M.-M. 2011, ApJ, 729, 72
- Petrov et al. (2005) Petrov, L., Kovalev, Y. Y., Fomalont, E., & Gordon, D. 2005, AJ, 129, 1163
- Phillips et al. (1998) Phillips, C. J., Norris, R. P., Ellingsen, S. P., & McCulloch, P. M. 1998, MNRAS, 300, 1131
- Rodriguez et al. (1994) Rodriguez, L. F., Garay, G., Curiel, S., et al. 1994, ApJ, 430, L65
- Rodriguez et al. (1980) Rodriguez, L. F., Ho, P. T. P., & Moran, J. M. 1980, ApJ, 240, L149
- Rygl et al. (2010) Rygl, K. L. J., Brunthaler, A., Reid, M. J., et al. 2010, A&A, 511, A2+
- Sanna et al. (2010a) Sanna, A., Moscadelli, L., Cesaroni, R., et al. 2010a, A&A, 517, A71+
- Sanna et al. (2010b) Sanna, A., Moscadelli, L., Cesaroni, R., et al. 2010b, A&A, 517, A78+
- Sawada-Satoh et al. (2013) Sawada-Satoh, S., Fujisawa, K., Sugiyama, K., Wajima, K., & Honma, M. 2013, PASJ, 65, in press
- Shepherd (1997) Shepherd, M. C. 1997, in Astronomical Society of the Pacific Conference Series, Vol. 125, Astronomical Data Analysis Software and Systems VI, ed. G. Hunt & H. Payne, 77–+
- Shibata et al. (1998) Shibata, K. M., Kameno, S., Inoue, M., & Kobayashi, H. 1998, in Astronomical Society of the Pacific Conference Series, Vol. 144, IAU Colloq. 164: Radio Emission from Galactic and Extragalactic Compact Sources, ed. J. A. Zensus, G. B. Taylor, & J. M. Wrobel, 413–+
- Sugiyama et al. (2008a) Sugiyama, K., Fujisawa, K., Doi, A., et al. 2008a, PASJ, 60, 1001
- Sugiyama et al. (2011) Sugiyama, K., Fujisawa, K., Doi, A., et al. 2011, PASJ, 63, 53
- Sugiyama et al. (2008b) Sugiyama, K., Fujisawa, K., Doi, A., et al. 2008b, PASJ, 60, 23
- Torrelles et al. (2007) Torrelles, J. M., Patel, N. A., Curiel, S., et al. 2007, ApJ, 666, L37
- Torstensson et al. (2011a) Torstensson, K. J. E., van der Tak, F. F. S., van Langevelde, H. J., Kristensen, L. E., & Vlemmings, W. H. T. 2011a, A&A, 529, A32+
- Torstensson et al. (2011b) Torstensson, K. J. E., van Langevelde, H. J., Vlemmings, W. H. T., & Bourke, S. 2011b, A&A, 526, A38+
- Uscanga et al. (2008) Uscanga, L., Gómez, Y., Raga, A. C., et al. 2008, MNRAS, 390, 1127
- van der Walt (2005) van der Walt, J. 2005, MNRAS, 360, 153
- Vlemmings (2008) Vlemmings, W. H. T. 2008, A&A, 484, 773
- Vlemmings et al. (2010) Vlemmings, W. H. T., Surcis, G., Torstensson, K. J. E., & van Langevelde, H. J. 2010, MNRAS, 404, 134
- Walsh et al. (1998) Walsh, A. J., Burton, M. G., Hyland, A. R., & Robinson, G. 1998, MNRAS, 301, 640
- Xu et al. (2008) Xu, Y., Li, J. J., Hachisuka, K., et al. 2008, A&A, 485, 729
5
| ID | Cluster | Relative positional offset | LSR | Internal proper motion | Peak intensity | |||||||||||
|---|---|---|---|---|---|---|---|---|---|---|---|---|---|---|---|---|
| RA | Dec | Velocity | 1st | 2nd | 3rd | |||||||||||
| (mas) | (km s-1) | (mas yr-1) | (km s-1) | (mas yr-1) | (km s-1) | (Jy beam-1) | ||||||||||
| 1 | III | 320.49 | 0.68 | 237.24 | 0.46 | 3.83 | 1.45 | 7.16 | ||||||||
| 2 | III | 319.99 | 0.41 | 236.96 | 0.31 | 3.65 | 2.10 | 7.51 | ||||||||
| 3 | III | 319.45 | 0.45 | 236.78 | 0.34 | 3.48 | 1.40 | 3.55 | ||||||||
| 4 | III | 317.90 | 0.59 | 234.75 | 0.49 | 4.01 | 2.72 | |||||||||
| 5 | III | 303.73 | 0.40 | 220.89 | 0.32 | 3.48 | 1.33 | |||||||||
| 6 | III | 303.30 | 0.30 | 220.80 | 0.19 | 3.65 | 2.13 | |||||||||
| 7 | III | 299.02 | 0.74 | 94.65 | 0.30 | 3.83 | 3.50 | |||||||||
| 8 | III | 298.73 | 0.86 | 94.70 | 0.34 | 3.65 | 3.53 | |||||||||
| 9 | III | 274.34 | 0.25 | 160.71 | 0.13 | 3.48 | 1.57 | 0.40 | 5.21 | 0.46 | 0.19 | 1.52 | 2.64 | 1.90 | 2.42 | |
| 10 | III | 273.89 | 0.14 | 160.43 | 0.10 | 3.65 | 5.60 | 6.30 | 8.32 | |||||||
| 11 | III | 273.22 | 0.26 | 159.77 | 0.11 | 3.83 | 0.98 | 0.19 | 3.26 | 0.54 | 0.08 | 1.80 | 4.79 | 8.40 | 10.41 | |
| 12 | III | 271.77 | 0.51 | 158.62 | 0.27 | 4.01 | 1.60 | 0.30 | 5.31 | 0.69 | 0.18 | 2.29 | 2.30 | 3.83 | 8.02 | |
| 13 | III | 225.53 | 0.51 | 132.59 | 0.52 | 3.30 | 1.01 | |||||||||
| 14 | III | 224.40 | 0.40 | 129.49 | 0.45 | 3.48 | 1.88 | |||||||||
| 15 | III | 219.96 | 0.21 | 121.00 | 0.26 | 3.65 | 4.96 | |||||||||
| 16 | III | 216.10 | 0.27 | 119.06 | 0.16 | 3.48 | 2.21 | 3.83 | ||||||||
| 17 | III | 214.45 | 0.23 | 119.65 | 0.15 | 3.30 | 1.46 | 1.53 | ||||||||
| 18 | III | 209.55 | 0.33 | 117.36 | 0.33 | 3.30 | 1.43 | |||||||||
| 19 | III | 208.87 | 0.21 | 115.73 | 0.22 | 3.48 | 2.59 | |||||||||
| 20 | I/II | 72.49 | 0.27 | 38.53 | 0.14 | 3.13 | 2.08 | 3.74 | 3.18 | |||||||
| 21 | I/II | 71.69 | 0.11 | 37.99 | 0.05 | 2.95 | 10.04 | 11.73 | 9.71 | |||||||
| 22 | I/II | 70.24 | 0.13 | 37.35 | 0.07 | 2.78 | 16.92 | 13.94 | 8.59 | |||||||
| 23 | I/II | 68.47 | 0.12 | 36.38 | 0.06 | 2.60 | 13.36 | 11.69 | ||||||||
| 24 | I/II | 67.42 | 0.14 | 37.00 | 0.09 | 2.95 | 12.22 | 8.40 | ||||||||
| 25 | I/II | 65.30 | 0.19 | 35.43 | 0.15 | 2.78 | 19.11 | 13.72 | ||||||||
| 26 | I/II | 61.87 | 0.17 | 35.37 | 0.09 | 2.95 | 6.97 | 14.15 | 4.93 | |||||||
| 27 | I/II | 60.54 | 0.12 | 34.43 | 0.06 | 2.78 | 19.02 | 31.03 | 9.13 | |||||||
| 28 | I/II | 60.41 | 0.50 | 34.83 | 0.28 | 3.13 | 1.12 | 2.74 | ||||||||
| 29 | I/II | 59.37 | 0.08 | 33.63 | 0.03 | 2.60 | 22.60 | 26.64 | ||||||||
| 30 | I/II | 59.25 | 0.26 | 33.52 | 0.11 | 2.42 | 9.87 | |||||||||
| 31 | I/II | 48.20 | 0.15 | 28.78 | 0.14 | 2.95 | 7.55 | 6.29 | ||||||||
| 32 | I/II | 47.33 | 0.48 | 37.66 | 0.39 | 3.13 | 1.11 | |||||||||
| 33 | I/II | 46.39 | 0.15 | 28.04 | 0.08 | 2.78 | 13.59 | 25.88 | 18.06 | |||||||
| 34 | I/II | 45.23 | 0.06 | 27.48 | 0.03 | 2.60 | 24.24 | 34.45 | 25.46 | |||||||
| 35 | I/II | 44.96 | 0.17 | 27.57 | 0.09 | 2.42 | 17.14 | 12.80 | 14.29 | |||||||
| 36 | I/II | 42.18 | 0.16 | 26.38 | 0.12 | 2.78 | 19.93 | 15.09 | ||||||||
| 37 | I/II | 40.79 | 0.09 | 25.79 | 0.07 | 2.60 | 35.11 | 25.68 | ||||||||
| 38 | I/II | 40.37 | 0.18 | 25.80 | 0.09 | 2.42 | 14.22 | 21.52 | 18.62 | |||||||
| 39 | I/II | 34.91 | 0.20 | 23.20 | 0.16 | 2.42 | 17.96 | |||||||||
| 40 | I/II | 34.73 | 0.18 | 22.63 | 0.19 | 2.25 | 15.54 | 9.31 | ||||||||
| 41 | I/II | 28.73 | 0.29 | 28.04 | 0.16 | 2.25 | 6.65 | |||||||||
| 42 | I/II | 21.21 | 0.19 | 8.92 | 0.10 | 2.07 | 10.22 | |||||||||
| 43 | I/II | 19.97 | 0.23 | 9.64 | 0.13 | 1.90 | 7.57 | |||||||||
| 44 | I/II | 13.36 | 0.45 | 44.29 | 0.43 | 1.72 | 2.78 | |||||||||
| 45 | I/II | 13.02 | 0.51 | 44.62 | 0.49 | 1.55 | 1.18 | |||||||||
| 46 | I/II | 6.27 | 0.07 | 3.04 | 0.04 | 2.07 | 0.33 | 0.09 | 1.09 | 0.16 | 0.07 | 0.54 | 24.59 | 21.44 | 15.12 | |
| 47 | I/II | 5.41 | 0.05 | 2.56 | 0.03 | 2.25 | 0.35 | 0.04 | 1.15 | 0.34 | 0.03 | 1.12 | 46.03 | 48.59 | 35.85 | |
| 48 | I/II | 4.74 | 0.04 | 2.90 | 0.03 | 2.60 | 27.33 | |||||||||
| 49 | I/II | 4.10 | 0.19 | 2.39 | 0.11 | 1.90 | 8.70 | |||||||||
| 50 | I/II | 2.04 | 0.04 | 0.91 | 0.02 | 2.42 | 0.52 | 0.05 | 1.74 | 0.59 | 0.03 | 1.97 | 63.74 | 73.17 | 45.07 | |
| 51 | I/II | 0.94 | 0.46 | 0.31 | 0.24 | 3.30 | 0.85 | 0.93 | ||||||||
| 52 | I/II | 0.57 | 0.33 | 0.68 | 0.17 | 3.13 | 1.35 | 0.24 | 4.47 | 0.45 | 0.13 | 1.49 | 1.75 | 2.25 | 1.53 | |
| 53∗ | I/II | 0.00 | 0.02 | 0.00 | 0.01 | 2.60 | 0.13 | 0.02 | 0.44 | 0.03 | 0.01 | 0.10 | 68.78 | 92.19 | 46.06 | |
| 54 | I/II | 0.88 | 0.15 | 0.07 | 0.07 | 2.95 | 7.61 | 13.78 | 8.82 | |||||||
| 55 | I/II | 0.99 | 0.07 | 0.29 | 0.03 | 2.78 | 0.06 | 0.04 | 0.20 | 0.02 | 0.02 | 0.07 | 36.96 | 55.84 | 29.14 | |
| 56 | I/II | 15.43 | 0.47 | 5.97 | 0.27 | 2.78 | 5.23 | |||||||||
| 57 | I/II | 16.35 | 0.25 | 6.69 | 0.14 | 2.60 | 6.12 | |||||||||
| 58 | I/II | 29.20 | 0.75 | 31.63 | 0.46 | 1.19 | 0.43 | |||||||||
| 59 | I/II | 32.44 | 0.86 | 28.53 | 0.49 | 1.02 | 0.37 | |||||||||
| 60 | I/II | 32.77 | 0.24 | 28.11 | 0.14 | 2.07 | 6.79 | 8.58 | 8.96 | |||||||
| 61 | I/II | 32.93 | 0.07 | 28.36 | 0.04 | 1.90 | 25.63 | 28.96 | 18.07 | |||||||
| 62 | I/II | 33.61 | 0.07 | 28.61 | 0.03 | 1.72 | 34.02 | 33.90 | 17.00 | |||||||
| 63 | I/II | 33.62 | 0.37 | 27.30 | 0.21 | 1.19 | 0.87 | |||||||||
| 64 | I/II | 34.14 | 0.08 | 28.72 | 0.04 | 1.55 | 18.96 | 13.93 | 5.97 | |||||||
| 65 | I/II | 34.95 | 0.12 | 28.73 | 0.05 | 1.37 | 0.03 | 0.21 | 0.11 | 0.30 | 0.13 | 1.01 | 3.53 | 1.41 | 0.75 | |
| 66 | I/II | 39.13 | 0.63 | 39.68 | 0.50 | 1.90 | 5.15 | |||||||||
| 67 | I/II | 40.76 | 0.43 | 39.13 | 0.41 | 1.72 | 3.38 | |||||||||
| 68 | I/II | 41.41 | 0.41 | 38.33 | 0.41 | 1.55 | 1.64 | |||||||||
| 69 | I/II | 41.60 | 0.32 | 25.99 | 0.19 | 2.07 | 5.88 | |||||||||
| 70 | I/II | 41.71 | 0.21 | 26.99 | 0.13 | 1.90 | 8.44 | |||||||||
| 71 | I/II | 42.39 | 0.55 | 37.45 | 0.45 | 1.37 | 0.63 | |||||||||
| 72 | I/II | 43.88 | 0.41 | 27.14 | 0.31 | 2.60 | 7.10 | |||||||||
| 73 | I/II | 44.57 | 0.58 | 27.80 | 0.43 | 2.42 | 5.81 | |||||||||
| 74 | I/II | 70.86 | 0.28 | 24.90 | 0.21 | 2.95 | 3.33 | 3.28 | ||||||||
| 75 | I/II | 71.10 | 0.28 | 24.70 | 0.18 | 3.30 | 0.13 | 0.30 | 0.42 | 0.86 | 0.14 | 2.86 | 1.26 | 2.74 | 1.33 | |
| 76 | I/II | 71.25 | 0.15 | 24.85 | 0.10 | 3.13 | 0.44 | 0.11 | 1.47 | 0.46 | 0.07 | 1.53 | 3.13 | 5.32 | 2.38 | |
| 77 | V | 115.92 | 0.48 | 538.56 | 0.41 | 4.88 | 1.09 | |||||||||
| 78 | V | 120.52 | 0.67 | 534.02 | 0.71 | 5.06 | 0.59 | |||||||||
| 79 | V | 121.12 | 0.26 | 533.02 | 0.27 | 4.88 | 0.62 | 0.24 | 2.04 | 0.09 | 0.24 | 0.29 | 1.68 | 2.93 | ||
| 80 | V | 122.16 | 0.34 | 532.20 | 0.35 | 4.71 | 0.36 | 0.66 | 1.20 | 0.41 | 0.69 | 1.34 | 1.75 | 3.29 | ||
| 81 | V | 124.18 | 0.21 | 530.14 | 0.22 | 4.88 | 2.38 | |||||||||
| 82 | V | 128.07 | 0.33 | 525.42 | 0.34 | 4.88 | 0.53 | 0.32 | 1.74 | 1.03 | 0.31 | 3.41 | 1.41 | 2.15 | ||
| 83 | V | 129.54 | 0.31 | 523.64 | 0.33 | 4.71 | 1.06 | 0.75 | 3.51 | 0.22 | 0.78 | 0.74 | 1.91 | 2.85 | ||
| 84 | V | 133.56 | 0.40 | 520.15 | 0.31 | 4.88 | 1.32 | |||||||||
| 85 | V | 138.41 | 0.63 | 511.83 | 0.59 | 4.88 | 0.69 | |||||||||
| 86 | V | 140.27 | 0.52 | 511.04 | 0.53 | 4.71 | 1.00 | |||||||||
| 87 | V | 151.31 | 0.25 | 504.58 | 0.18 | 4.71 | 0.04 | 0.34 | 0.13 | 0.13 | 0.29 | 0.43 | 1.43 | 3.57 | ||
| 88 | V | 151.40 | 0.92 | 504.26 | 0.68 | 4.88 | 0.53 | 1.08 | 1.75 | 0.88 | 0.84 | 2.93 | 0.45 | 1.56 | ||
| 89 | V | 151.96 | 0.23 | 504.27 | 0.18 | 4.53 | 0.57 | 0.45 | 1.88 | 0.93 | 0.46 | 3.10 | 1.55 | 2.75 | ||
| 90 | V | 157.68 | 0.23 | 496.85 | 0.19 | 4.53 | 1.69 | 0.46 | 5.60 | 1.48 | 0.49 | 4.89 | 1.51 | 2.81 | ||
| 91 | V | 157.90 | 0.72 | 495.60 | 0.53 | 4.88 | 1.46 | 0.86 | 4.85 | 0.66 | 0.68 | 2.17 | 0.46 | 1.59 | ||
| 92 | V | 158.16 | 0.26 | 496.37 | 0.19 | 4.71 | 1.11 | 0.37 | 3.69 | 0.83 | 0.32 | 2.76 | 1.33 | 3.10 | ||
| 93 | V | 165.18 | 0.55 | 488.11 | 0.41 | 4.71 | 0.65 | 1.15 | ||||||||
| 94 | V | 167.38 | 0.69 | 483.48 | 0.81 | 4.88 | 0.58 | |||||||||
| 95 | II | 402.69 | 0.60 | 149.27 | 0.34 | 2.60 | 1.87 | |||||||||
| 96 | II | 405.57 | 0.82 | 148.12 | 0.36 | 2.42 | 2.81 | |||||||||
| 97 | II | 406.40 | 0.64 | 155.93 | 0.37 | 2.78 | 3.25 | |||||||||
| 98 | II | 407.92 | 0.30 | 156.50 | 0.18 | 2.95 | 3.44 | 1.92 | ||||||||
| 99 | II | 408.88 | 0.37 | 156.78 | 0.25 | 3.13 | 1.36 | |||||||||
| 100 | II | 413.36 | 1.04 | 161.94 | 0.71 | 2.78 | 2.08 | |||||||||
| 101 | II | 413.61 | 0.39 | 162.63 | 0.27 | 2.95 | 2.53 | |||||||||
| 102 | II | 413.71 | 0.45 | 163.00 | 0.29 | 3.13 | 1.15 | 1.11 | ||||||||
| 103 | II | 417.61 | 0.76 | 167.09 | 0.35 | 0.49 | 0.39 | |||||||||
| 104 | II | 418.01 | 0.50 | 166.97 | 0.27 | 0.32 | 0.43 | |||||||||
| 105 | II | 451.96 | 0.48 | 142.77 | 0.54 | 3.48 | 1.06 | |||||||||
| 106 | II | 452.28 | 0.49 | 143.34 | 0.60 | 3.30 | 0.73 | |||||||||
| 107 | IV | 1327.92 | 0.49 | 193.17 | 0.47 | 4.01 | 6.27 | |||||||||
| 108 | IV | 1331.99 | 0.23 | 193.64 | 0.15 | 4.18 | 9.09 | |||||||||
| 109 | IV | 1338.30 | 0.11 | 183.16 | 0.06 | 3.83 | 8.25 | 3.47 | ||||||||
| 110 | IV | 1339.17 | 0.11 | 183.07 | 0.06 | 4.01 | 0.05 | 0.13 | 0.17 | 0.53 | 0.07 | 1.76 | 17.80 | 5.81 | 13.41 | |
| 111 | IV | 1339.22 | 0.24 | 182.58 | 0.14 | 4.36 | 7.09 | 8.61 | ||||||||
| 112 | IV | 1339.60 | 0.35 | 182.07 | 0.20 | 4.53 | 1.28 | |||||||||
| 113 | IV | 1340.21 | 0.12 | 182.46 | 0.07 | 4.18 | 1.48 | 0.09 | 4.91 | 0.46 | 0.04 | 1.54 | 18.66 | 13.59 | 17.48 | |
| 114 | IV | 1343.04 | 0.16 | 166.12 | 0.17 | 4.01 | 6.80 | 11.68 | ||||||||
| 115 | IV | 1343.92 | 0.12 | 167.71 | 0.12 | 4.18 | 11.82 | |||||||||
| 116 | IV | 1344.40 | 0.11 | 168.19 | 0.13 | 4.36 | 8.10 | 9.14 | ||||||||
| 117 | IV | 1344.84 | 0.18 | 168.65 | 0.22 | 4.53 | 2.76 | 2.61 | ||||||||
| 118 | IV | 1344.95 | 0.11 | 179.55 | 0.06 | 4.36 | 0.43 | 0.12 | 1.43 | 0.59 | 0.07 | 1.95 | 15.19 | 23.24 | 15.42 | |
| 119 | IV | 1345.05 | 0.19 | 179.65 | 0.10 | 4.53 | 0.03 | 0.11 | 0.10 | 0.41 | 0.06 | 1.35 | 2.41 | 6.73 | 4.53 | |
| 120 | IV | 1345.68 | 0.07 | 180.35 | 0.05 | 4.18 | 1.16 | 0.06 | 3.86 | 0.04 | 0.04 | 0.12 | 30.94 | 29.77 | 19.45 | |
| 121 | IV | 1345.75 | 0.13 | 175.55 | 0.07 | 4.18 | 17.06 | |||||||||
| 122 | IV | 1346.17 | 0.18 | 181.41 | 0.10 | 3.65 | 2.13 | |||||||||
| 123 | IV | 1346.58 | 0.06 | 180.29 | 0.04 | 4.01 | 0.98 | 0.09 | 3.24 | 0.66 | 0.06 | 2.20 | 28.78 | 13.40 | 13.95 | |
| 124 | IV | 1347.64 | 0.09 | 180.68 | 0.05 | 3.83 | 11.53 | |||||||||
| 125 | IV | 1352.70 | 0.12 | 178.68 | 0.07 | 4.01 | 16.28 | 6.18 | ||||||||
| 126 | IV | 1352.85 | 0.20 | 178.36 | 0.10 | 4.18 | 0.76 | 0.16 | 2.51 | 1.13 | 0.08 | 3.74 | 12.43 | 10.02 | 9.21 | |
| 127 | IV | 1353.82 | 0.15 | 179.17 | 0.09 | 3.83 | 6.22 | |||||||||
| 128 | IV | 1354.54 | 0.48 | 184.84 | 0.43 | 4.53 | 1.43 | |||||||||
| 129 | IV | 1354.72 | 0.49 | 178.35 | 0.26 | 4.36 | 3.52 | 5.46 | ||||||||
| 130 | IV | 1361.74 | 0.15 | 164.10 | 0.09 | 3.65 | 2.52 | |||||||||
| 131 | IV | 1362.97 | 0.18 | 163.11 | 0.10 | 3.83 | 4.36 | |||||||||