P.O. Box 68, FI-00014 University of Helsinki, Finland
11email: otto.solin@helsinki.fi 22institutetext: Finnish Centre for Astronomy with ESO
University of Turku, Väisäläntie 20, FI-21500 PIIKKIÖ, Finland 33institutetext: University of Helsinki, Department of Physics, Division of Geophysics and Astronomy
P.O. Box 64, FI-00014 University of Helsinki, Finland
Mining the VVV: star formation and embedded clusters ††thanks: Appendices A, B and C are only available in electronic form via http://www.edpsciences.org
Abstract
Aims. To locate previously unknown stellar clusters from the VISTA variables in the Vía Láctea Survey (VVV) catalogue data.
Methods. The method, fitting a mixture model of Gaussian densities and background noise using the expectation maximization algorithm to a pre-filtered NIR survey stellar catalogue data, was developed by the authors for the UKIDSS Galactic Plane Survey (GPS).
Results. The search located 88 previously unknown mainly embedded stellar cluster candidates and 39 previously unknown sites of star formation in the 562 deg2 covered by VVV in the Galactic bulge and the southern disk.
Key Words.:
open clusters and associations: general – methods: statistical – catalogs – surveys – infrared: stars1 Introduction
The ESO public survey VISTA variables in the Vía Láctea (VVV; Saito et al. (2012)) is mapping 562 deg2 in the Galactic bulge and the southern disk in the ZYJHKs filters (Minniti et al. 2010). The VVV survey was designed to complement among others the UKIDSS Galactic Plane Survey (GPS) (Lucas et al. 2008) which is mapping in Galactic latitude in the northern plane.
In Solin et al. (2012, hereafter Paper I) we presented an application of Gaussian mixture modelling, optimised with the Expectation Maximization (EM) algorithm (Dempster et al. 1977) to automatically locate stellar clusters in the UKIDSS GPS (Lucas et al. 2008). This study applies the same method to the VVV survey first data release (DR1). The background and motivation for this work and the data mining approach to the cluster search is described in Paper I.
The search algorithm and filtering of the catalogue artefacts have been presented in detail in Paper I. The data is described in Sect. 2 and the search method and results in Sects. 3 and 4. In Sect. 5 the results, supplementary information on the cluster candidates and selected individual cluster candidates are discussed. Conclusions are drawn in Sect. 6.
2 The data
The VVV survey began in May 2010 and is expected to run in total for about five years. The DR1 catalogues contain stellar sources detected in at least one of the five photometric bands (ZYJHKs). There are no overall limiting magnitudes as they depend strongly on crowding in the inner Galactic regions. The VVV survey is carried out by the VIRCAM (VISTA InfraRed CAMera; Dalton et al. (2006)) on the VISTA (Visible and Infrared Survey Telescope for Astronomy) at ESO Paranal observatory. The VISTA Data Flow System pipeline processing and science archive are described in Irwin et al. (2004) and Hambly et al. (2008). We have used data from the first data release, which is described in detail in Saito et al. (2012). The catalogue data is used for the automated search, and the image data for visual inspection of the cluster candidate areas given by the detection algorithm. Stars brighter than from the 2MASS survey are used for locating potential false positive clusters created by these bright stars (see online Appendix B).
3 Search method
The search method and algorithm are described in detail in Ch. 3 in Paper I. In the following we present a short summary and outline the differencies between these two studies.
The catalogue parameter mergedClass classifies as stars or galaxies every object both in the WFCAM Science Archive (WSA) (Hambly et al. 2008) catalogue data table gpsSource used in Paper I and the VISTA Science Archive (VSA) (Cross et al. 2012) catalogue data table vvvSource used in this study. These catalogues tend to classify objects seen superposed on variable surface brightness as ”galaxies”. This can be utilised in the search of stellar clusters either embedded in or near molecular/dust clouds and locations of star formation. The clusters and newly formed single stars which are associated with dust clouds create variable surface brightness which broadens the stellar point spread function or creates false, extended sources. ”Galaxy” in the archive parlance is more precisely described as ”non-stellar” or ”extended” object.
A fraction of the catalogue sources are due to data artefacts. In Paper I a few different types of artefacts in the UKIDSS survey data were addressed. In this study only false mergedClass classifications caused by diffraction patterns around bright stars are addressed. The other types addressed in Paper I are either not numerous or not at all present in the VVV survey data. Comparison between UKIDSS and VVV survey data and artefacts in them is done in online Appendices B and C.
The catalogue data table vvvSource contains 113 attributes for each detected object. These parameters strongly resemble those of the UKIDSS GPS. In addition to the mergedClass parameter we also tested in Paper I the usefulness of other parameters in our clustering effort, but ultimately both studies make use only of this star/non-stellar classifier.
As in UKIDSS the VVV classification of sources fainter than in H and Ks as stellar/non-stellar objects is highly unreliable. These sources were filtered out from the data as they would create strong erratic background noise.
Different from Paper I we use in addition to the K magnitude also the H magnitude. This is because in VVV DR1 the H magnitude is given for many tiles where the Ks magnitude is missing. Indeed many candidates were found in areas where only the H magnitude is given. In order not to loose true positives we now also do not reject any sources based on the quality error bit flags for each source detection (VSA 2011). Indeed cluster candidate 12 lies in a region where the parameters hppErrBits and ksppErrBits often have a high value. In any case hppErrBits and ksppErrBits mostly fall below the value 17 and only a negligible part of the parameters hErrBits and ksErrBits are other than zero.
The VVV DR1 catalogue data table vvvSource contains sources measured in the H or Ks filter with magnitude brighter than . These sources are divided according to the mergedClass parameter so that a negligible fraction are probable galaxies or noise, 6% probable stars, 64% stars, and 30% galaxies. We end up using for the detection algorithm sources with H or Ks magnitude brighter than and mergedClass . These amount to sources ( out of all sources measured in the H or Ks filter in VVV DR1). Besides step 3 below the magnitudes listed in the VVV catalogue are in no way used in the automated search.
The automated search proceeds in the following steps which are similar to those in Paper I where the model and its parameters are presented in detail. When Ks band data is not available H band data is used in the search.
-
1.
The pre-filtered catalogue data is divided into smaller overlapping spatial bins of size 4′ by 4′. Apart from bins at the dataset edges each bin overlaps one half of its neighbouring bins. 4′ by 4′ was chosen as a suitable size for the bin based on experiments with the cluster candidates in the UKIDSS GPS list by Lucas.
-
2.
Remove false mergedClass classifications around bright stars as explained in Appendix A1 in Paper I.
-
3.
In order to track clusters with bright members the detection algorithm is run five times: once with all (filtered) input data and then using 80, 60, 40 and 20% of these sources arranged in descending order of the H or Ks magnitude.
-
4.
The spatial coordinates are rescaled to the interval [0,1] to make all bins equally important but still allowing them to have differing means and variances. This step is relevant only for bins at the dataset edges and which are smaller than 4′ by 4′.
-
5.
In order to initialise the model parameters the data bin is divided into 16 subgrids to find the area with the highest spatial density. The initial value of the cluster mean is the center point of the subgrid with the highest density. The covariance matrix of the data points assigned to the subgrid with the highest density give the initial values for the cluster covariance . The weights have as initial values the same value: .
-
6.
Each data bin is represented by a mixture model of a background component and one Gaussian cluster component as explained in Paper I.
-
7.
The EM-algorithm returns for each data bin a candidate cluster, i.e. an ellipse with the center point at the mean and half-axes determined by the covariance .
-
8.
Rearrange the candidates in descending order of the Bayesian information criterion (BIC, Schwarz (1978)).
-
9.
Merge cluster candidates closer than one arcmin to each other.
-
10.
Remove from the list the cluster candidates catalogued in Dutra & Bica (2000, hereafter [DB2000]); Dutra et al. (2003, [DBS2003]); Bica et al. (2003a, [BDB2003]); Bica et al. (2003b, [BDS2003]) (200 covered by VVV), Mercer et al. (2005, [MCM2005b]) (67 covered by VVV), Froebrich et al. (2007) (17 covered by VVV), Lucas (17 out of the 331 cluster candidates from UKIDSS GPS DR4 are covered also by VVV), and Borissova et al. (2011) (96 cluster candidates from VVV).
The source screening was done in exactly the manner as in Paper I (Ch. 3.3 there) with the exception that the BIC threshold was lowered to 0 (BIC can also have a negative value) in order not to loose true positives that give only a weak signal to our system. As in Paper I only a small fraction () of the candidates given by the automated search are true cluster candidates.
We note that the center point for the cluster given by the automated search is not always exactly at the cluster center. Often during the source screening the coordinates for the candidates need to be slightly adjusted.
4 Results
The search located 88 cluster and 39 star formation location candidates which, to our knowledge, are previously unknown. The cluster candidates are listed in Table Mining the VVV: star formation and embedded clusters ††thanks: Appendices A, B and C are only available in electronic form via http://www.edpsciences.org and the candidate locations of star formation in Table 1. In addition we list in Table 2 26 faint nebulae whose nature cannot be clearly defined. The division of the candidates into these three groups is very subjective and is based on the optical appearance of the candidates and also on their SIMBAD associations:
-
•
A cluster candidate has more than a few stars.
-
•
A location for star formation candidate has bright nebular emission but only one or a few stars. Also SIMBAD associations that are star formation indicators are considered as evidence.
-
•
Faint nebula candidates are similar to location for star formation candidates but are considered too weak in terms of the criteria mentioned. These sources are often in the direction of infrared dark clouds (IRDC) where a large number of other indications of star formation (IRAS, MSX and (sub)mm sources, masers and HII regions) are present. No stellar cluster can be resolved but the surface brightness (red nebulous, compact objects or only faint red surface brightness) created by putative star formation triggers the classification of the VVV mergedClass parameter and thus the cluster search algorithm.
The columns in the tables list (1) a running number, (2) source identification, (3,4) Galactic coordinates, (5,6) J2000.0 equatorial coordinates, (7) description of selected SIMBAD sources within 2′ of the direction of the candidate and (8) references to selected publications in Table 3.
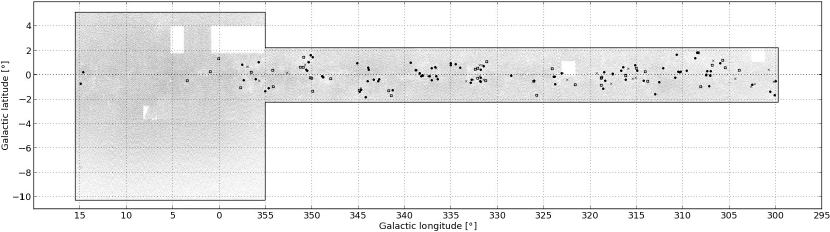
The distribution of the candidates is shown superposed on the VVV area in Fig. 1. The grey area marks the VVV DR1 coverage in the H or Ks filter. Some areas in the VVV mapping do not contain observations in neither filter. These locations are shown blank in Fig. 1. The cluster candidates (Table Mining the VVV: star formation and embedded clusters ††thanks: Appendices A, B and C are only available in electronic form via http://www.edpsciences.org) are marked with filled circles, the star formation location candidates (Table 1) as open circles, and the faint nebulae (Table 2) as crosses. Most candidates are in in the galactic plane outside the bulge area. This is explained by the fact that in the bulge the contamination from the field stars, despite filtering sources fainter than 17 magnitudes, is overwhelming and our method is not able to trap the clusters.
4′ by 4′ images in JHKs bands of the new cluster candidate areas are available in electronic form111http://www.helsinki.fi/~osolin/clusters. Most images show clear signs of reflected light in particular in the Ks band thus indicating embedded clusters or sites of star formation.
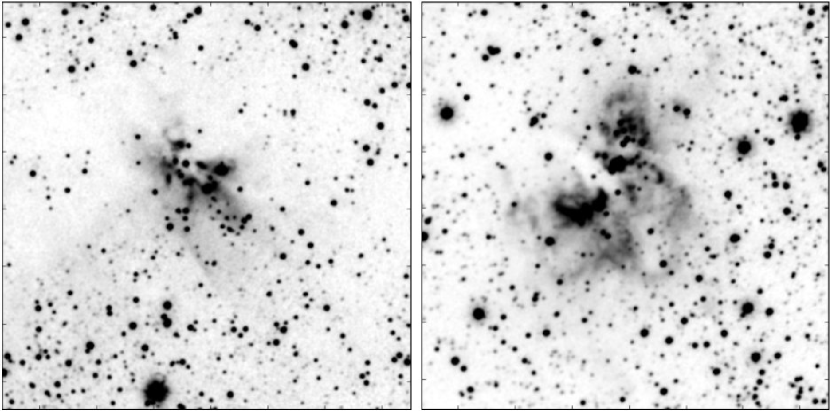
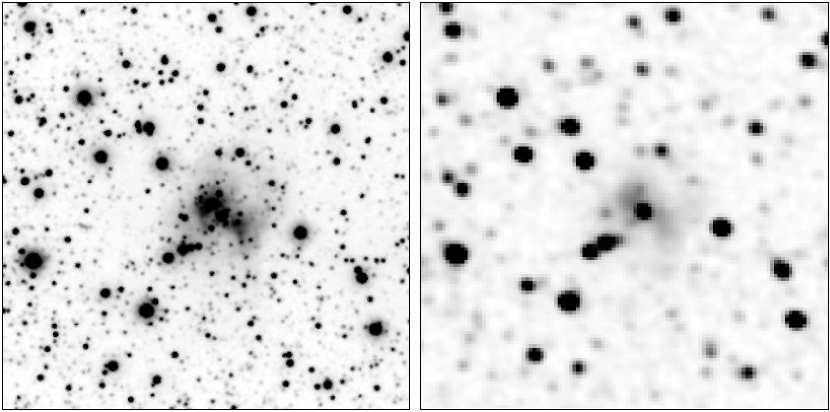
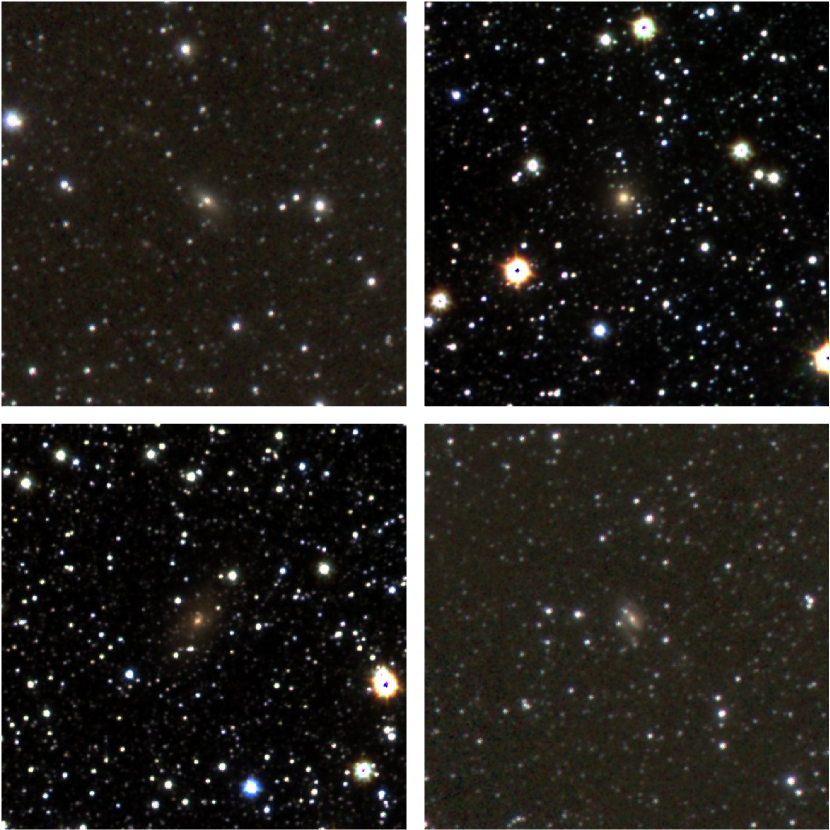
Example 2′ by 2′ Ks band images of candidates are shown in Figs. 2 and 3. Cluster candidate 85 (Fig. 2 on the left) has so far been identified as a bubble. Cluster candidate 87 (Fig. 2 on the right) has around its location an IRAS source and a millimetre source. Cluster candidate 21 (Fig. 3) has so far been identified as an IRAS source and an extended 2MASS extended source (2MASX). It is also included in the list of new embedded clusters by Morales et al. (2013) which appeared in arXiv at the time of submission of this paper. The cluster area is shown in Fig. 3 on the left as a VVV image and on the right as a 2MASS image. No cluster can be seen in the 2MASS image.
Further example images of cluster candidates including their colour-colour and colour-magnitude diagrams are shown in Appendix A.
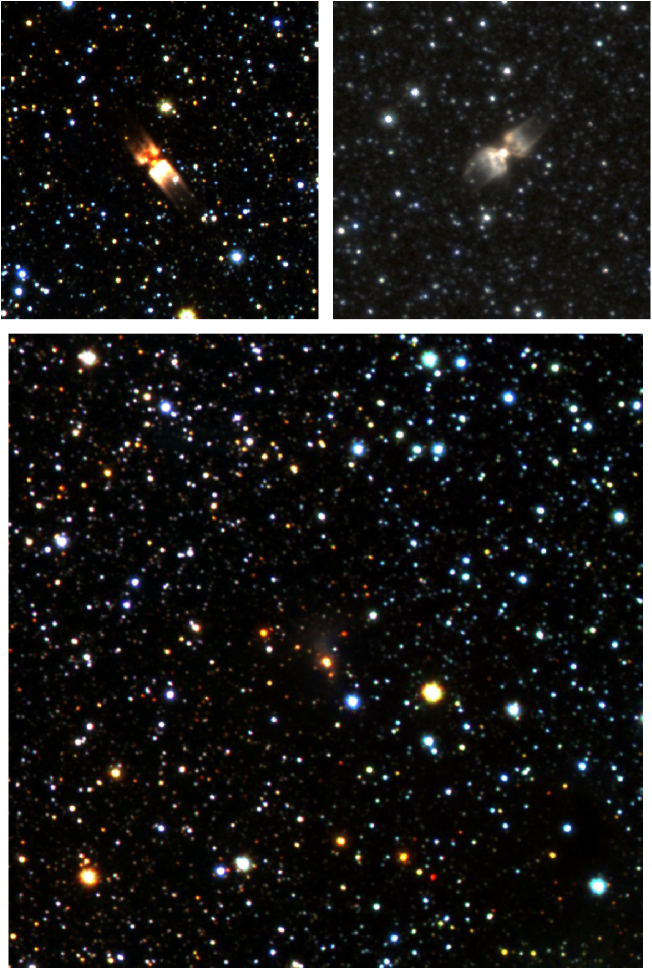
Besides the sources in Tables Mining the VVV: star formation and embedded clusters ††thanks: Appendices A, B and C are only available in electronic form via http://www.edpsciences.org-2 the search algorithm found number of sources which are not clusters and sources which can not be clearly classified using data available presently. Some of these may be of general interest. IRAS 17340-3757 and IRAS 13428-6232 are two post AGB stars. Possible zone of avoidance galaxies are 2MASS J16353747-4459364, 2MASS J16361578-4448452, 2MASS J18054356-4130103 and 2MASS J18164114-3816136. Object 2MASS J13065758-6212037 is a bright, compact source in the middle of a small dark cloud. The sources are listed in Table 4. Colour images of these sources are shown in online Figs. 5 and 6.
5 Discussion
As in Paper I SIMBAD was used to search for sources within 2′ from the candidates in Tables Mining the VVV: star formation and embedded clusters ††thanks: Appendices A, B and C are only available in electronic form via http://www.edpsciences.org-2 and 4 with the following results (the number of sources are given in parenthesis): IRAS point source (89), MSX source (54), (sub)millimetre source (38), maser (42), outflow candidate (31) and HII region (41).
98 candidates are seen in the direction of an Infrared Dark Cloud (IRDC). IRDCs are compact, cold, dense and massive dark clouds seen in absorption against the high Galactic mid-IR surface brightness. Many IRDCs have no indication of active star formation (e.g. Pillai et al. 2006). These clouds have been suggested to be the cold precursors to high mass star clusters (e.g. Rathborne et al. 2006). The rest of the IRDCs are associated with typical signs of star formation, e.g. masers, IR and (sub)mm sources. In this paper some IRDCs are simply visually classified as star forming regions or faint nebulae.
Even though the search was made using only VVV stellar data the search located IRDC clouds which were not associated with clustered stars but with the faint nebulae in Table 2. We argue that this surface brightness is not due to dark clouds reflecting the ambient Galactic radiation field but due to embedded star formation. The high dust extinction hides the stars and only a small fraction of the diffuse radiation produced by the star formation process is able to escape. The optical extinction of IRDCs is high even in mid-IR. Because of multiple scattering no scattered Galactic NIR radiation field is expected (cf. Lehtinen & Mattila 1996; Juvela et al. 2008) and the surface brightness must have a local source. E.g. objects 21 and 23 in Table 2 are small angular size localised spots seen in the (H and) Ks band. Reflected light from the general ambient Galactic interstellar radiation field would rather cause a broadly distributed surface brightness at the boundaries of the densest region.
As in Paper I only IRAS point sources with fluxes typical for embedded sources in star forming clouds (a good quality flux rising from 12 microns to 60 or 100 microns) were included and cirrus-like IRAS point sources were excluded. Mostly more than one of these indicators were seen in the direction of the candidates. Only one cluster candidate (71), one star formation region candidate (23) and two objects (3 and 7) in Table 4 had no entry within 2′ in the SIMBAD data base.
5.1 Notes on individual sources
Cluster candidate 8 is proposed to be a young stellar object candidate (Ramos-Larios et al. 2012). This candidate is also included in a study on embedded structures within IRDCs and other cold, massive molecular clouds (Ragan et al. 2012).
Cluster candidates 16, 17, 18 and 20 and cluster [DBS2003] 131 are in the G305 star-forming complex.
Cluster candidates 34 and 40 are included in a study on circumstellar environments of MYSOs (Wheelwright et al. 2012).
Cluster candidate 50: the cluster is dense but the cluster stars are not reddened.
Cluster candidates 59, 65 and 69 are in massive star formation complexes studied in Rahman & Murray (2010).
Cluster candidate 71 has no associated SIMBAD sources within 5′. This is a dense clustering of stars. No VVV Ks magnitudes are available for this field in DR1 but the colour-colour diagram using 2MASS data indicates homogeneous visual reddening of magnitudes on the assumption that the cluster stars are early type stars. See online Figure 4.
\onlfig
Cluster candidate 81 is 35″ away from cluster [MCM2005b] 88 but seems to be an individual compact cluster.
Faint nebula 8 is included in a study on embedded structures within IRDCs and other cold, massive molecular clouds (Ragan et al. 2012).
At least signs of cluster candidates 17, 43 and 87 can be seen also in 2MASS images, but they have not been listed as clusters in SIMBAD.
Many candidates are located near each other and/or near already known clusters as noted in the comments to Tables Mining the VVV: star formation and embedded clusters ††thanks: Appendices A, B and C are only available in electronic form via http://www.edpsciences.org-2.
6 Conclusions
We have applied the method developed in Paper I for the UKIDSS GPS to the VVV survey. The search from the UKIDSS GPS resulted in 137 previously unknown cluster candidates and 30 previously unknown sites of star formation. The corresponding figures for the VVV are 88 and 39 with additional 26 faint nebulae of unknown nature. There are many similarities in the results obtained from these two surveys. For both cases only a few percent of the cluster candidates produced by the automated search turn out not to be data artefacts or false positives. References 1-7 to selected publications in Table 3 are also listed in the equivalent table in Paper I. Particularly many of the VVV candidate SIMBAD associations are infrared dark clouds. This is not surprising as these clouds are assumed to be the forming sites of massive clusters. Similar to the UKIDDS cluster candidates in Paper I the VVV candidates do not form a homogeneous cluster sample but they vary both in size and stellar number density. Besides clustered stars (Table Mining the VVV: star formation and embedded clusters ††thanks: Appendices A, B and C are only available in electronic form via http://www.edpsciences.org) the search algorithm is triggered by locations of star formation with only one or only a few stars (Table 1) and even faint dark cloud surface brightness spots (see Table 2). The number of star formation indicators seen in the direction of the candidates, and structures of surface brightness and single stars in both the UKIDSS and VVV images give confidence that most of the candidates are real entities. Like in the UKIDSS search most VVV cluster and location of star formation candidates are tightly concentrated on the Galactic plane. Most of the VVV candidates are in the disk area and only a few in the bulge where our method is not able to handle the contamination from the field stars.
Acknowledgements.
This work was funded by the Finnish Ministry of Education under the project ”Utilizing Finland’s membership in the European Southern Observatory”. This work was supported by the Academy of Finland under grants 118653 (ALGODAN) and 132291. This work uses data products from the Two Micron All Sky Survey, the United Kingdom Infrared Telescope Infrared Deep Sky Survey, and the Visible and Infrared Survey Telescope for Astronomy. This research uses the SIMBAD astronomical database service operated at CCDS, Strasbourg.References
- Bica et al. (2003a) Bica, E., Dutra, C. M., & Barbuy, B. 2003a, A&A, 397, 177 ([BDB2003])
- Bica et al. (2003b) Bica, E., Dutra, C. M., Soares, J., & Barbuy, B. 2003b, A&A, 404, 223 ([BDS2003])
- Borissova et al. (2011) Borissova, J., Bonatto, C., Kurtev, R., et al. 2011, A&A, 532, A131
- Churchwell et al. (2006) Churchwell, E., Povich, M. S., Allen, D., et al. 2006, ApJ, 649, 759
- Cross et al. (2012) Cross, N. J. G., Collins, R. S., Mann, R. G., et al. 2012, A&A, 548, A119
- Culverhouse et al. (2011) Culverhouse, T., Ade, P., Bock, J., et al. 2011, ApJS, 195, 8
- Cyganowski et al. (2008) Cyganowski, C. J., Whitney, B. A., Holden, E., et al. 2008, AJ, 136, 2391
- Dalton et al. (2006) Dalton, G. B., Caldwell, M., Ward, A. K., et al. 2006, in Society of Photo-Optical Instrumentation Engineers (SPIE) Conference Series, Vol. 6269, Society of Photo-Optical Instrumentation Engineers (SPIE) Conference Series
- Dempster et al. (1977) Dempster, A. P., Laird, M. M., & Rubin, D. B. 1977, J. R. Stat. Soc. Ser. B, 39, 1
- Dutra & Bica (2000) Dutra, C. M. & Bica, E. 2000, A&A, 359, L9 ([DB2000])
- Dutra et al. (2003) Dutra, C. M., Bica, E., Soares, J., & Barbuy, B. 2003, A&A, 400, 533 ([DBS2003])
- Fontani et al. (2005) Fontani, F., Beltrán, M. T., Brand, J., et al. 2005, A&A, 432, 921
- Froebrich et al. (2007) Froebrich, D., Scholz, A., & Raftery, C. L. 2007, MNRAS, 374, 399
- Hambly et al. (2008) Hambly, N. C., Collins, R. S., Cross, N. J. G., et al. 2008, MNRAS, 384, 637
- Harju et al. (1998) Harju, J., Lehtinen, K., Booth, R. S., & Zinchenko, I. 1998, A&AS, 132, 211
- Hill et al. (2005) Hill, T., Burton, M. G., Minier, V., et al. 2005, MNRAS, 363, 405
- Hofner & Churchwell (1996) Hofner, P. & Churchwell, E. 1996, A&AS, 120, 283
- Irwin et al. (2004) Irwin, M. J., Lewis, J., Hodgkin, S., et al. 2004, in Society of Photo-Optical Instrumentation Engineers (SPIE) Conference Series, Vol. 5493, Society of Photo-Optical Instrumentation Engineers (SPIE) Conference Series, ed. P. J. Quinn & A. Bridger, 411–422
- Juvela et al. (2008) Juvela, M., Pelkonen, V.-M., Padoan, P., & Mattila, K. 2008, A&A, 480, 445
- Lehtinen & Mattila (1996) Lehtinen, K. & Mattila, K. 1996, A&A, 309, 570
- Lucas et al. (2008) Lucas, P. W., Hoare, M. G., Longmore, A., et al. 2008, MNRAS, 391, 136
- Mercer et al. (2005) Mercer, E. P., Clemens, D. P., Meade, M. R., et al. 2005, ApJ, 635, 560
- Minniti et al. (2010) Minniti, D., Lucas, P. W., Emerson, J. P., et al. 2010, New A, 15, 433
- Morales et al. (2013) Morales, E. F. E., Wyrowski, F., Schuller, F., & Menten, K. M. 2013, ArXiv e-prints
- Mottram et al. (2007) Mottram, J. C., Hoare, M. G., Lumsden, S. L., et al. 2007, A&A, 476, 1019
- Peretto & Fuller (2009) Peretto, N. & Fuller, G. A. 2009, A&A, 505, 405
- Pillai et al. (2006) Pillai, T., Wyrowski, F., Carey, S. J., & Menten, K. M. 2006, A&A, 450, 569
- Ragan et al. (2012) Ragan, S., Henning, T., Krause, O., et al. 2012, A&A, 547, A49
- Rahman & Murray (2010) Rahman, M. & Murray, N. 2010, ApJ, 719, 1104
- Ramos-Larios et al. (2012) Ramos-Larios, G., Guerrero, M. A., Suárez, O., Miranda, L. F., & Gómez, J. F. 2012, A&A, 545, A20
- Rathborne et al. (2006) Rathborne, J. M., Jackson, J. M., & Simon, R. 2006, ApJ, 641, 389
- Saito et al. (2012) Saito, R. K., Hempel, M., Minniti, D., et al. 2012, A&A, 537, A107
- Schwarz (1978) Schwarz, G. 1978, Ann. Statist., 6, 461
- Solin et al. (2012) Solin, O., Ukkonen, E., & Haikala, L. 2012, A&A, 542, A3 (Paper I)
- Stead & Hoare (2009) Stead, J. J. & Hoare, M. G. 2009, MNRAS, 400, 731
- Thompson et al. (2006) Thompson, M. A., Hatchell, J., Walsh, A. J., MacDonald, G. H., & Millar, T. J. 2006, A&A, 453, 1003
- VSA (2011) VSA. 2011, Quality Error Bit Flags, presented at http://horus.roe.ac.uk/vsa/ppErrBits.html
- Wheelwright et al. (2012) Wheelwright, H. E., de Wit, W. J., Oudmaijer, R. D., et al. 2012, A&A, 540, A89
[x]l*8c
List of cluster candidates.
# ID (J2000) (J2000) Associated sourcesS𝑆SS𝑆SSource classification from SIMBAD: IRDC stands for infrared dark cloud, of? for outflow candidate, bub for bubble, Mas for maser, (s)mm for (sub-)millimetre source, 2MASX for 2MASS extended source, RNe for reflection nebula and DNe for dark nebula.
Notes on individual sources: cluster candidate 2 is 3.1′ away from cluster candidate 315 in the UKIDSS GPS list by Lucas, cluster candidate 16 is 3.7′ away from [DBS2003] 131, cluster candidate 17 is 2.9′ away from cluster VVV CL022, cluster candidate 38 and location of star formation candidate 17 are 1.8′ apart, cluster candidate 51 is 2.1′ away from cluster VVV CL063, cluster candidate 52 and faint nebula 18 are 2.8′ apart, cluster candidate 56 is 4.5′ away from cluster VVV CL064, cluster candidates 56 and 57 are 3.7′ apart, cluster candidates 61 and 62 are 2.1′ apart, cluster candidate 75 and faint nebula 21 are 2.4′ apart, cluster candidates 76 and 77 are 1.3′ apart, cluster candidate 80 and faint nebula 22 are 3.8′ apart. Cluster candidates 7, 21, 25, 34, 36, 40, 43, 70 and 88 are included in the list of new embedded clusters by Morales et al. (2013) which appeared in arXiv at the time of submission of this paper. References
[] [] [ ] [ ’ “]
\endfirstheadcontinued.
# ID (J2000) (J2000) Associated sourcesS𝑆SS𝑆SSource classification from SIMBAD: IRDC stands for infrared dark cloud, of? for outflow candidate, bub for bubble, Mas for maser, (s)mm for (sub-)millimetre source, 2MASX for 2MASS extended source, RNe for reflection nebula and DNe for dark nebula.
Notes on individual sources: cluster candidate 2 is 3.1′ away from cluster candidate 315 in the UKIDSS GPS list by Lucas, cluster candidate 16 is 3.7′ away from [DBS2003] 131, cluster candidate 17 is 2.9′ away from cluster VVV CL022, cluster candidate 38 and location of star formation candidate 17 are 1.8′ apart, cluster candidate 51 is 2.1′ away from cluster VVV CL063, cluster candidate 52 and faint nebula 18 are 2.8′ apart, cluster candidate 56 is 4.5′ away from cluster VVV CL064, cluster candidates 56 and 57 are 3.7′ apart, cluster candidates 61 and 62 are 2.1′ apart, cluster candidate 75 and faint nebula 21 are 2.4′ apart, cluster candidates 76 and 77 are 1.3′ apart, cluster candidate 80 and faint nebula 22 are 3.8′ apart. Cluster candidates 7, 21, 25, 34, 36, 40, 43, 70 and 88 are included in the list of new embedded clusters by Morales et al. (2013) which appeared in arXiv at the time of submission of this paper. References
[] [] [ ] [ ’ “]
\endhead\endfoot1 G009.6170.197 009.617 0.197 18 06 14 20 31 44 IRAS,MSX,HII,smm,mm,Mas,IRDC,bub 1,2,3,6,7
2 G009.9270.746 009.927 0.746 18 10 24 20 42 54 smm,mm,IRDC,bub 3,7
3 G294.9880.539 294.988 0.539 11 42 10 62 20 13 … …
4 G295.1031.677 295.103 1.677 11 40 27 63 27 54 IRAS 10
5 G295.5571.378 295.557 1.378 11 45 04 63 17 46 IRAS,MSX,2MASX 8
6 G297.5330.823 297.533 0.823 12 03 17 63 11 20 IRDC 7
7 G300.9470.911 300.947 0.911 12 34 35 61 53 46 IRAS,IRDC 7
8 G302.0210.253 302.021 0.253 12 43 31 62 36 18 IRAS,MSX,IRDC 7
9 G302.0320.061 302.032 0.061 12 43 32 62 55 08 IRAS,MSX,HII,mm,Mas,IRDC 3,7
10 G302.1510.948 302.151 0.948 12 44 22 63 48 32 IRAS,MSX 8
11 G302.3900.280 302.390 0.280 12 46 44 62 35 13 IRAS,IRDC 7
12 G302.4870.032 302.487 0.032 12 47 32 62 54 00 IRAS,IRDC 7
13 G303.4051.789 303.405 1.789 12 55 21 61 04 44 … …
14 G303.6411.338 303.641 1.338 12 57 23 61 31 34 RNe …
15 G304.5590.329 304.559 0.329 13 05 32 62 29 53 IRAS,IRDC 7
16 G305.2010.208 305.201 0.208 13 11 10 62 34 37 MSX,HII,mm,Mas,IRDC 3,6,7
17 G305.3500.194 305.350 0.194 13 12 28 62 34 44 IRAS,HII,mm,Mas,IRDC,bub 3,5,6,7
18 G305.4840.224 305.484 0.224 13 13 36 62 32 17 MSX,IRDC 7
19 G305.6341.648 305.634 1.648 13 13 50 61 06 22 IRAS …
20 G305.8000.250 305.800 0.250 13 16 44 62 58 52 IRAS,MSX,HII,mm,Mas,of?,IRDC 3,4,7
21 G307.1000.527 307.100 0.527 13 27 08 62 03 22 IRAS,2MASX …
22 G307.5600.587 307.560 0.587 13 32 31 63 05 20 IRAS,HII,mm,IRDC 7
23 G307.9731.595 307.973 1.595 13 37 42 64 00 47 IRAS …
24 G309.2210.463 309.221 0.463 13 46 38 62 39 32 2MASX,IRDC 7
25 G309.9090.325 309.909 0.325 13 50 54 61 44 20 of?,IRDC 4,7
26 G310.1460.758 310.146 0.758 13 52 00 61 15 47 IRAS,MSX,2MASX,Mas,of?,IRDC 4,7
27 G311.1770.400 311.177 0.400 14 02 53 62 07 23 IRAS,IRDC 7
28 G311.4260.597 311.426 0.597 14 02 36 61 05 46 IRAS,HII,2MASX,IRDC 7
29 G311.6390.301 311.639 0.301 14 04 59 61 19 16 MSX,HII,Mas,IRDC 6,7,8
30 G312.5970.047 312.597 0.047 14 13 14 61 16 48 IRAS,MSX,HII,mm,Mas,IRDC 7
31 G313.3170.463 313.317 0.463 14 20 18 61 31 48 IRAS,IRDC 7,10
32 G313.4570.194 313.457 0.194 14 19 35 60 51 50 MSX,HII,Mas,IRDC 7,8
33 G313.5761.154 313.576 1.154 14 24 23 62 05 20 IRAS …
34 G318.0510.087 318.051 0.087 14 53 43 59 08 49 IRAS,MSX,HII,Mas,of?,IRDC 4,6,7
35 G318.7230.752 318.723 0.752 15 01 27 59 34 37 IRAS,IRDC 7
36 G318.7740.151 318.774 0.151 14 59 34 59 01 26 IRAS,MSX,HII,mm,IRDC 7
37 G318.9150.164 318.915 0.164 15 00 35 58 58 08 HII,mm,2MASX,Mas,IRDC 3,7
38 G321.0320.484 321.032 0.484 15 15 53 58 11 10 MSX,HII,Mas,IRDC 7
39 G323.4600.079 323.460 0.079 15 29 20 56 31 23 IRAS,MSX,HII,mm,Mas,IRDC 7,8
40 G326.4770.697 326.477 0.697 15 43 19 54 07 26 IRAS,MSX,mm,Mas,of?,IRDC 4,6,7,8,9
41 G326.7830.241 326.783 0.241 15 48 56 54 40 34 IRAS,Mas,of? 4,6
42 G326.7890.553 326.789 0.553 15 50 19 54 54 58 IRAS,IRDC,bub 5,7
43 G326.7940.381 326.794 0.381 15 46 21 54 10 48 IRAS,MSX,of?,IRDC 4,7
44 G326.8780.514 326.878 0.514 15 50 38 54 49 48 … …
45 G327.7350.393 327.735 0.393 15 54 40 54 11 38 mm,of?,IRDC 4,7
46 G327.8090.632 327.809 0.632 15 56 07 54 19 48 IRAS,mm,Mas,IRDC 6,7,9
47 G328.9580.567 328.958 0.567 15 56 51 52 40 23 IRAS,MSX,HII,IRDC 7
48 G329.4770.842 329.477 0.842 15 58 17 52 07 41 IRAS,MSX,IRDC 7,8
49 G330.0200.917 330.020 0.917 16 00 38 51 43 01 IRDC 7
50 G330.0330.752 330.033 0.752 16 01 24 51 50 02 … …
51 G331.4190.354 331.419 0.354 16 12 50 51 43 26 HII,IRDC 7
52 G331.6030.108 331.603 0.108 16 12 37 51 25 08 IRAS,Mas,IRDC 7
53 G331.7090.603 331.709 0.603 16 10 01 50 49 34 MSX,mm,of? 4,9
54 G332.0620.508 332.062 0.508 16 12 04 50 39 18 IRAS,IRDC,bub 5,7,10
55 G332.0950.421 332.095 0.421 16 16 17 51 18 22 MSX,mm,Mas,IRDC 7
56 G332.2940.096 332.294 0.096 16 15 46 50 56 02 IRAS,MSX,HII,mm,Mas,of?,IRDC 4,7
57 G332.3520.116 332.352 0.116 16 16 07 50 54 29 Mas,of?,IRDC 4,7
58 G333.0290.065 333.029 0.065 16 18 57 50 24 00 MSX,2MASX,Mas,IRDC 7
59 G333.1630.100 333.163 0.100 16 19 42 50 19 52 MSX,HII,mm,Mas,of?,IRDC 4,7,8
60 G333.3150.106 333.315 0.106 16 19 29 50 04 41 MSX,Mas,of? 4
61 G333.7250.371 333.725 0.371 16 20 08 49 36 04 IRAS,HII,mm,IRDC 7
62 G333.7600.364 333.760 0.364 16 20 19 49 34 55 MSX,IRDC 7
63 G334.3320.965 334.332 0.965 16 20 13 48 45 07 IRAS,HII …
64 G336.2901.250 336.290 1.250 16 38 10 48 51 47 RNe …
65 G337.6910.346 337.691 0.346 16 39 43 47 12 58 IRAS,IRDC,bub 5,7
66 G337.7840.508 337.784 0.508 16 40 48 47 15 14 IRDC 7
67 G338.3240.408 338.324 0.408 16 42 27 46 46 55 of?,IRDC 4,7
68 G338.8510.409 338.851 0.409 16 40 55 45 50 49 IRAS,IRDC 7
69 G338.9190.548 338.919 0.548 16 40 34 45 42 14 MSX,Mas,of?,IRDC 4,7,8
70 G338.9260.501 338.926 0.501 16 45 09 46 23 17 IRAS,IRDC 7
71 G339.1911.854 339.191 1.854 16 52 12 47 03 22 … …
72 G339.6821.206 339.682 1.206 16 51 06 46 15 54 IRAS,MSX,HII,mm,Mas 8,9
73 G339.8011.391 339.801 1.391 16 52 22 46 17 28 IRAS …
74 G340.0710.927 340.071 0.927 16 43 16 44 35 17 IRAS,MSX,IRDC 7,8
75 G343.7240.183 343.724 0.183 17 00 48 42 28 26 MSX,mm,of?,IRDC 4,7
76 G343.8340.106 343.834 0.106 17 00 51 42 20 20 HII,IRDC,bub 7
77 G343.8550.099 343.855 0.099 17 00 53 42 19 08 IRAS,HII,IRDC,bub 7,10
78 G344.8741.435 344.874 1.435 16 57 49 40 34 08 MSX 8
79 G345.1191.589 345.119 1.589 16 57 59 40 16 52 IRAS,Mas …
80 G345.3271.020 345.327 1.020 17 01 00 40 28 12 IRAS,IRDC 7
81 G345.4890.316 345.489 0.316 17 04 28 40 46 19 IRAS,HII,mm,Mas,IRDC 7,9
82 G345.5900.374 345.590 0.374 17 04 33 40 39 22 IRDC 7
83 G349.6431.092 349.643 1.092 17 23 00 38 13 48 IRAS,MSX,mm 8
84 G350.0111.340 350.011 1.340 17 25 06 38 03 58 IRAS,mm,Mas 9
85 G350.7071.026 350.707 1.026 17 17 20 36 08 46 bub 9
86 G351.0430.335 351.043 0.335 17 23 50 36 38 49 IRAS,HII,mm,bub 9
87 G352.3140.442 352.314 0.442 17 27 48 35 39 14 IRAS,mm …
88 G352.4880.797 352.488 0.797 17 23 15 34 48 58 IRAS,MSX,DNe 9
| # | ID | (J2000) | (J2000) | Associated sourcesS𝑆SS𝑆Sfootnotemark: | References | ||
|---|---|---|---|---|---|---|---|
| [] | [] | [ ] | [ ’ “] | ||||
| 1 | G298.9030.358 | 298.903 | 0.358 | 12 16 44 | 62 14 31 | of?,IRDC | 4,7 |
| 2 | G300.4010.546 | 300.401 | 0.546 | 12 29 42 | 62 13 08 | IRAS,2MASX | … |
| 3 | G300.7201.200 | 300.720 | 1.200 | 12 32 50 | 61 35 31 | IRAS,MSX | 8 |
| 4 | G301.8140.781 | 301.814 | 0.781 | 12 41 53 | 62 04 12 | IRAS | … |
| 5 | G303.1170.971 | 303.117 | 0.971 | 12 53 07 | 63 50 31 | IRAS,HII,2MASX | … |
| 6 | G303.3461.821 | 303.346 | 1.821 | 12 54 51 | 61 02 53 | IRAS | … |
| 7 | G308.7340.508 | 308.734 | 0.508 | 13 42 33 | 62 48 11 | IRAS | … |
| 8 | G309.0140.208 | 309.014 | 0.208 | 13 43 42 | 62 02 42 | IRAS | … |
| 9 | G309.9990.504 | 309.999 | 0.504 | 13 51 18 | 61 32 38 | of?,IRDC | 4,7 |
| 10 | G311.1790.072 | 311.179 | 0.072 | 14 02 08 | 61 48 22 | MSX | 8 |
| 11 | G313.7100.189 | 313.710 | 0.189 | 14 22 36 | 61 08 17 | IRAS,Mas,of? | 4 |
| 12 | G313.7630.859 | 313.763 | 0.859 | 14 24 59 | 61 44 53 | IRAS,MSX,HII,Mas,of?,IRDC | 4,7 |
| 13 | G313.7870.251 | 313.787 | 0.251 | 14 23 23 | 61 10 12 | MSX,IRDC | 7 |
| 14 | G316.5880.809 | 316.588 | 0.809 | 14 46 24 | 60 35 46 | IRAS,MSX,IRDC | 7,8,10 |
| 15 | G319.0880.460 | 319.088 | 0.460 | 14 59 29 | 58 20 13 | IRAS,2MASX,IRDC | 7 |
| 16 | G320.7381.700 | 320.738 | 1.700 | 15 18 55 | 59 22 26 | DNe | … |
| 17 | G321.0510.507 | 321.051 | 0.507 | 15 16 05 | 58 11 46 | MSX,HII,Mas,IRDC | 6,7,9 |
| 18 | G326.1451.071 | 326.145 | 1.071 | 15 39 58 | 54 01 30 | IRAS | … |
| 19 | G326.2700.486 | 326.270 | 0.486 | 15 47 11 | 55 11 10 | IRAS,of?,IRDC | 4,7 |
| 20 | G327.1180.506 | 327.118 | 0.506 | 15 47 34 | 53 52 55 | IRAS,MSX,HII,Mas,of? | 4,6 |
| 21 | G327.1310.264 | 327.131 | 0.264 | 15 50 54 | 54 28 34 | IRAS,Mas,bub | 5,10 |
| 22 | G327.4030.445 | 327.403 | 0.445 | 15 49 19 | 53 45 11 | IRAS,MSX,HII,mm,Mas,of?,IRDC | 4,6,7,9 |
| 23 | G336.4261.733 | 336.426 | 1.733 | 16 40 55 | 49 04 55 | … | … |
| 24 | G336.7401.300 | 336.740 | 1.300 | 16 40 13 | 48 33 36 | … | … |
| 25 | G339.8871.263 | 339.887 | 1.263 | 16 52 06 | 46 08 35 | IRAS,MSX,HII,Mas | 6 |
| 26 | G342.9580.318 | 342.958 | 0.318 | 16 58 48 | 43 09 32 | IRAS,IRDC | 7 |
| 27 | G344.9041.357 | 344.904 | 1.357 | 17 09 44 | 42 14 38 | IRAS | … |
| 28 | G344.9890.268 | 344.989 | 0.268 | 17 05 20 | 41 31 23 | HII,mm,IRDC | 7 |
| 29 | G345.1450.217 | 345.145 | 0.217 | 17 05 37 | 41 22 05 | IRDC | 7 |
| 30 | G345.8531.416 | 345.853 | 1.416 | 17 01 04 | 39 48 43 | … | … |
| 31 | G345.9550.612 | 345.955 | 0.612 | 17 04 43 | 40 13 16 | IRAS,IRDC | 7 |
| 32 | G346.2810.586 | 346.281 | 0.586 | 17 05 51 | 39 58 41 | of?,IRDC,RNe | 4,7 |
| 33 | G349.1450.976 | 349.145 | 0.976 | 17 21 05 | 38 34 26 | IRAS,of?,IRDC | 4,7 |
| 34 | G349.1870.344 | 349.187 | 0.344 | 17 15 42 | 37 46 48 | … | … |
| 35 | G351.5560.205 | 351.556 | 0.205 | 17 23 04 | 35 55 08 | mm,bub | … |
| 36 | G352.6301.067 | 352.630 | 1.067 | 17 31 14 | 35 44 10 | IRAS,MSX,HII,mm,Mas | 9 |
| 37 | G355.0311.323 | 355.031 | 1.323 | 17 28 00 | 32 24 54 | … | … |
| 38 | G355.9370.207 | 355.937 | 0.207 | 17 34 46 | 32 16 08 | mm | … |
| 39 | G358.3850.484 | 358.385 | 0.484 | 17 43 38 | 30 33 58 | IRAS,MSX,HII,mm,Mas | … |
| # | ID | (J2000) | (J2000) | Associated sourcesS𝑆SS𝑆Sfootnotemark: | References | ||
|---|---|---|---|---|---|---|---|
| [] | [] | [ ] | [ ’ “] | ||||
| 1 | G295.1760.574 | 295.176 | 0.574 | 11 43 39 | 62 25 16 | HII,IRDC | 7 |
| 2 | G295.7330.386 | 295.733 | 0.386 | 11 50 17 | 61 37 41 | … | … |
| 3 | G297.2530.754 | 297.253 | 0.754 | 12 00 58 | 63 04 05 | IRAS,2MASX,IRDC | 7 |
| 4 | G297.6580.975 | 297.658 | 0.975 | 12 04 07 | 63 21 40 | IRAS,HII,Mas,bub | 5 |
| 5 | G299.3250.308 | 299.325 | 0.308 | 12 19 37 | 62 57 25 | IRDC,RNe | 7 |
| 6 | G301.7201.121 | 301.720 | 1.121 | 12 41 12 | 61 43 37 | MSX,mm,2MASX | 8 |
| 7 | G310.0760.228 | 310.076 | 0.228 | 13 53 23 | 62 14 13 | of?,IRDC | 4,7 |
| 8 | G310.3750.298 | 310.375 | 0.298 | 13 56 01 | 62 13 59 | IRAS,MSX,of?,IRDC,DNe | 4,7 |
| 9 | G310.8660.473 | 310.866 | 0.473 | 13 58 24 | 61 21 47 | IRDC | 7 |
| 10 | G312.7420.716 | 312.742 | 0.716 | 14 16 26 | 61 57 29 | IRAS,IRDC | 7 |
| 11 | G314.2740.096 | 314.274 | 0.096 | 14 26 08 | 60 40 23 | MSX,HII,Mas,IRDC | 7 |
| 12 | G317.4630.398 | 317.463 | 0.398 | 14 51 18 | 59 50 42 | of?,IRDC | 4,7 |
| 13 | G326.4660.381 | 326.466 | 0.381 | 15 47 49 | 54 58 55 | IRAS,MSX,HII,mm,IRDC | 7,8 |
| 14 | G326.6470.749 | 326.647 | 0.749 | 15 44 01 | 53 58 44 | of?,IRDC | 4,7 |
| 15 | G326.8840.104 | 326.884 | 0.104 | 15 48 53 | 54 30 22 | IRDC | 7 |
| 16 | G326.9330.783 | 326.933 | 0.783 | 15 45 25 | 53 46 41 | IRAS,IRDC | 7 |
| 17 | G328.3360.528 | 328.336 | 0.528 | 15 58 24 | 53 54 40 | IRDC | 7 |
| 18 | G331.5610.128 | 331.561 | 0.128 | 16 12 30 | 51 27 43 | MSX,HII,mm,Mas,IRDC | 7,8 |
| 19 | G331.6230.523 | 331.623 | 0.523 | 16 09 58 | 50 56 35 | IRAS,MSX,mm,of?,IRDC | 4,7,9,10 |
| 20 | G339.7241.120 | 339.724 | 1.120 | 16 50 52 | 46 10 41 | IRAS,IRDC | 7 |
| 21 | G343.7220.224 | 343.722 | 0.224 | 17 00 59 | 42 30 00 | IRAS,HII,IRDC | 7 |
| 22 | G345.3791.056 | 345.379 | 1.056 | 17 01 02 | 40 24 25 | IRDC,bub | 5,7 |
| 23 | G345.7130.815 | 345.713 | 0.815 | 17 03 06 | 40 17 24 | IRAS,MSX,mm,of?,IRDC | 4,7,9 |
| 24 | G347.6170.152 | 347.617 | 0.152 | 17 11 48 | 39 09 54 | Mas,IRDC | 7 |
| 25 | G350.6920.492 | 350.692 | 0.492 | 17 23 30 | 37 01 34 | IRAS,MSX,mm,Mas,IRDC,bub | 7,9 |
| 26 | G351.9220.642 | 351.922 | 0.642 | 17 22 19 | 35 22 12 | IRAS,bub | … |
| # | BibCode | Aut | Description |
|---|---|---|---|
| 1 | 1996A&AS..120..283H | Hofner & Churchwell | Water maser emission of UC HII regions |
| 2 | 2006A&A…453.1003T | Thompson et al. | SCUBA smm survey of IRAS and UC HII regions |
| 3 | 2005MNRAS.363..405H | Hill et al. | mm observations of SFRs |
| 4 | 2008AJ….136.2391C | Cyganowski et al. | MYSO outflow candidates |
| 5 | 2006ApJ…649..759C | Churchwell et al. | Bubble candidates from GLIMPSE |
| 6 | 1998A&AS..132..211H | Harju et al. | SiO emission of masers |
| 7 | 2009A&A…505..405P | Peretto & Fuller | GLIMPSE IRDCs: initial conditions of stellar protocluster formation |
| 8 | 2007A&A…476.1019M | Mottram et al. | Mid-infrared observations of candidate massive YSOs |
| 9 | 2011ApJS..195….8C | Culverhouse et al. | A Compact Source Catalog from the QUaD Galactic Plane Survey |
| 10 | 2005A&A…432..921F | Fontani et al. | Search for massive protostellar candidates |
| # | ID | (J2000) | (J2000) | Associated sourcesS𝑆SS𝑆Sfootnotemark: | References | ||
|---|---|---|---|---|---|---|---|
| [] | [] | [ ] | [ ’ “] | ||||
| 1 | G304.7410.617 | 304.741 | 0.617 | 13 06 58 | 62 12 00 | IRDC | 7 |
| 2 | G309.1590.593 | 309.159 | 0.593 | 13 46 21 | 62 47 56 | IRAS,MSX,2MASX | … |
| 3 | G338.8661.669 | 338.866 | 1.669 | 16 35 37 | 44 59 38 | … | … |
| 4 | G339.0751.708 | 339.075 | 1.708 | 16 36 16 | 44 48 47 | … | … |
| 5 | G351.0859.794 | 351.085 | 9.794 | 18 05 44 | 41 30 11 | … | … |
| 6 | G351.4123.339 | 351.412 | 3.339 | 17 37 29 | 37 59 20 | … | … |
| 7 | G354.97910.189 | 354.979 | 10.189 | 18 16 41 | 38 16 16 | … | … |
Appendix A Examples of cluster candidates
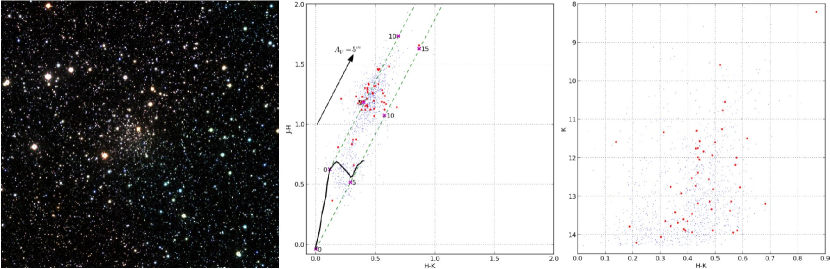
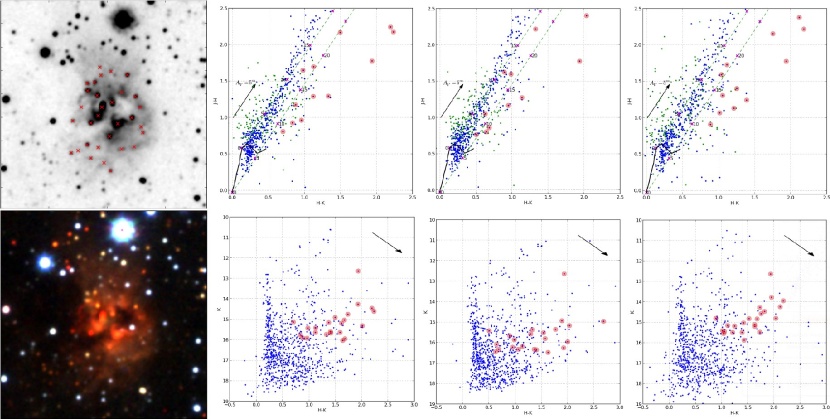
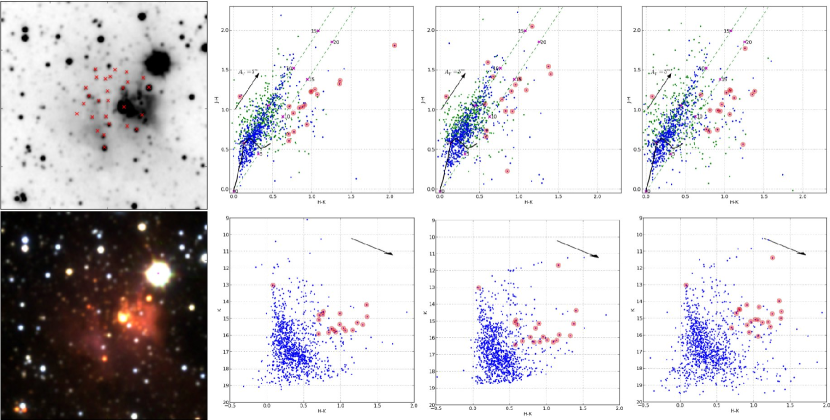
Example cluster candidates are shown in Figs. 7 and 8. The different panels in the figures are as follows. On the left 1′ by 1′ VVV grey scale Ks band and false colour image of the cluster area. The images are produced using the J, H and Ks fits files obtained from the VSA. In the Ks band image sources (both stellar and non-stellar) in the cluster direction brighter than in Ks are marked with red crosses. All the sources within a 4′ by 4′ box around the cluster candidate are plotted in the colour-colour and colour-magnitude plots. The red filled circles mark the same sources as the red crosses in the grey scale image. As in Paper I the automated search uses by default the AperMag3 magnitudes (2.0″ aperture diameter). For the colour-colour and colour-magnitude plots we experimented also with the AperMag1 (1.0″ aperture diameter) and AperMag4 (2.8″ aperture diameter) extended source magnitudes. The arrow indicates an optical extinction of 5 magnitudes. In the colour-colour plot blue dots mark sources brighter than and green dots sources fainter than in Ks. The approximate unreddened main sequence is plotted with a continuous line and approximate main sequence reddening lines are shown with dashed lines. The numbers on the reddening lines show the optical extinction in case the star originates from the early or late main sequence. The value of 1.6 for the reddening slope is the mean of all the reddening tracks in Stead & Hoare (2009).
Both example cluster candidates are in crowded fields. As in Paper I in an effort to get better precision than with AperMag3 magnitudes (2.0″ aperture diameter) we experimented also with the AperMag1 (1.0″ aperture diameter) and AperMag4 (2.8″ aperture diameter) magnitudes. However the colour plots show only little variation depending on the magnitudes used.
For both cases all three colour-colour plots indicate infrared excess and all three colour-magnitude plots suggest that the cluster members are of early type.
Appendix B VVV and GPS catalogue artefacts
Only catalogue artefacts created around bright stars coincide in the GPS and VVV surveys. This is because of the different optics of the UKIRT/WFCAM and VISTA/VIRCAM. The typical artefacts in the GPS survey are the bow-tie, beam, array edge flare, and persistence image (see App. A.1 in Paper I). Many of these artefacts either do not exist in the VVV survey or their number is greatly reduced in comparison with the GPS survey. Most importantly the automatic search algorithm used in this work does not produce as many false positive clusters due to artefacts in the VVV survey catalogue as in the UKIDSS GPS catalogue. In the latter particularly the persistence images and array edge flares produce a large number of strong false positive clusters.
B.1 False positive clusters caused by bright stars
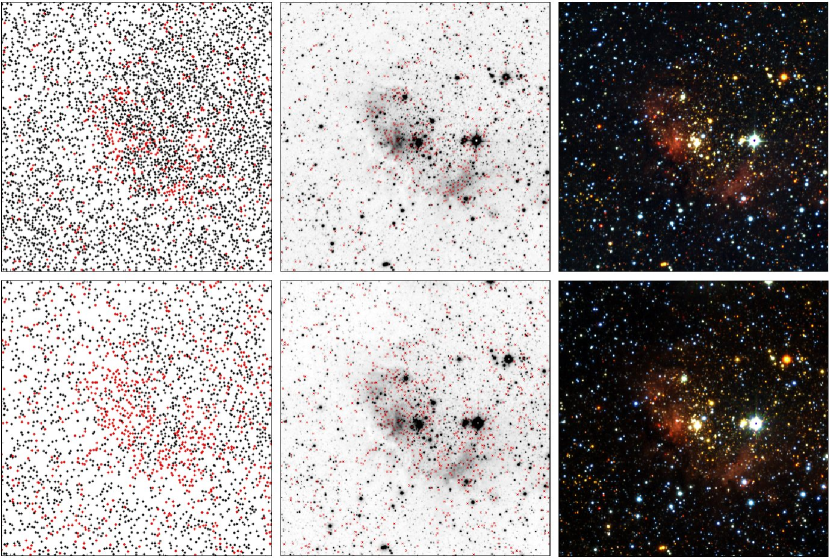
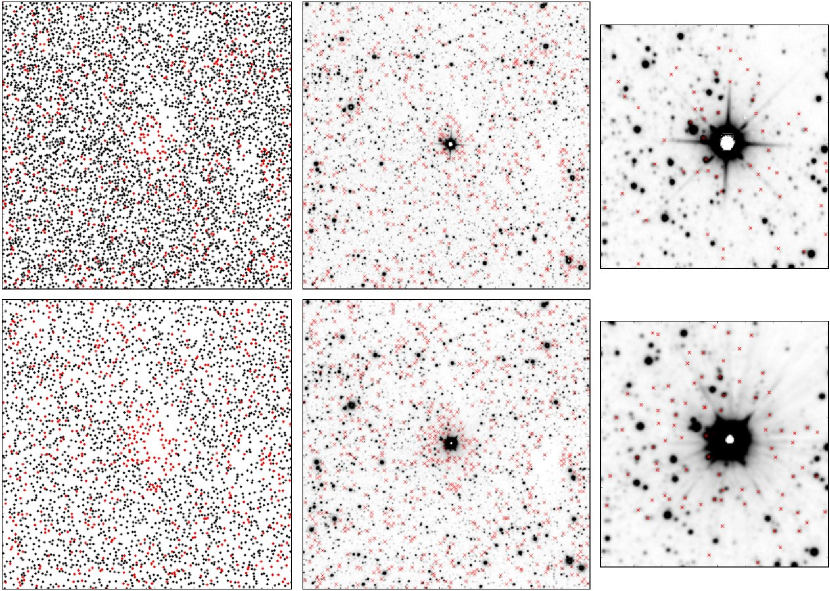
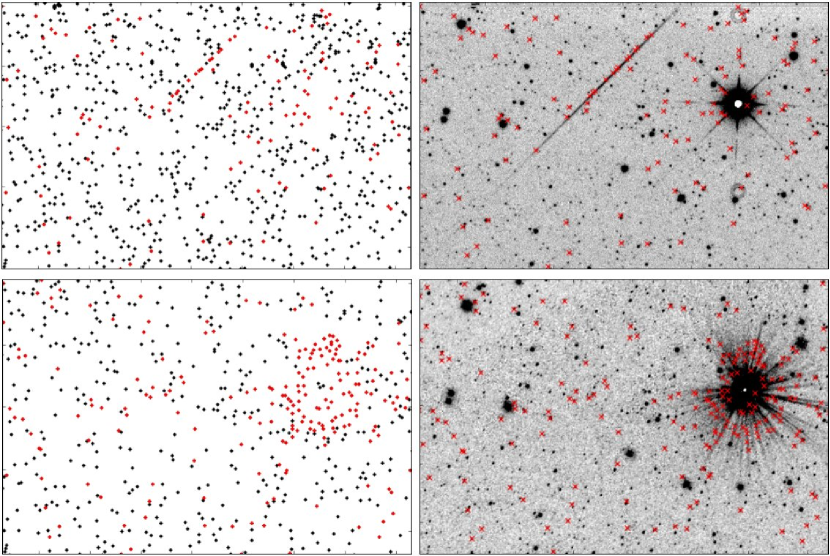
The most common catalogue artefact from the point of view of this work is that caused by bright stars. The extended halo around the bright stars and diffraction spikes cause varying surface brightness which either broadens the image of real stars or produces spatially extended false sources both of which are classified as non-stellar sources. An example of a false positive cluster caused by a bright star is shown in Fig. 9. This field is included both in the GPS and VVV surveys. The upper three images, from left to right, in Fig. 9 show the catalogue plot, catalogue Ks image and zoom on bright star in the Ks image, respectively. The field size is 4′ by 4′ in the left and centre and 1′ by 1′ on the right. The objects classified as extended are indicated with a red cross. The corresponding VVV images are shown in the three lower images. The number of visible strong diffraction spikes is fewer in the GPS image (eight) than in the VVV image where they are weaker. The bright star produces more non-stellar classifications into the VVV catalogue than in the GPS catalogue. In the VVV catalogue all of the sources within this area are brighter than in K but only 85% in the UKIDSS catalogue. Bright stars produce false positive clusters in both the GPS and VVV catalogues. For both catalogues the remedy is to discard non-stellar sources very near 2MASS stars brighter than in K. The brighter the star, the greater the distance to which it produces false classifications (see App. A.1 in Paper I).
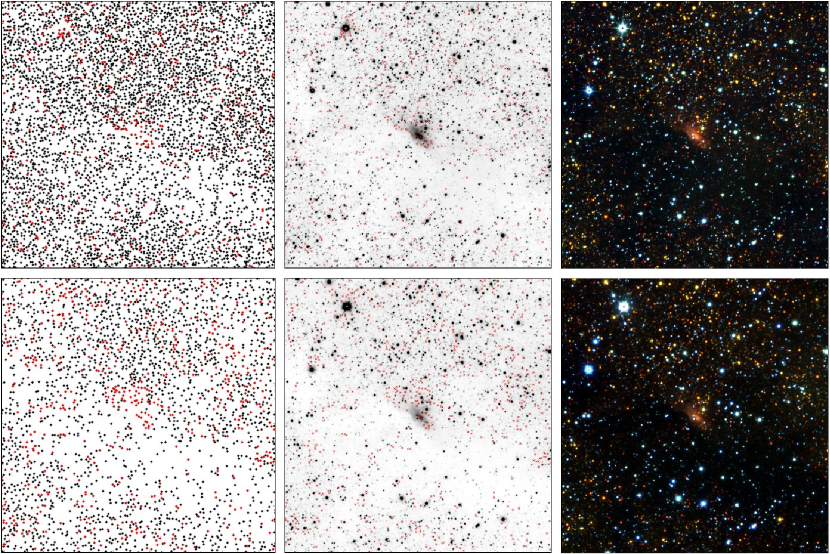
In Fig. 10 the bright star produces many more non-stellar classifications into the VVV catalogue than into the UKIDSS catalogue. In the UKIDSS image there are visible two more artefacts: a beam across the image and two cross-talk images above and below the bright star. Within this area 68% of the sources are brighter than in K in the VVV survey catalogue but only 48% in the UKIDSS catalogue.
In Fig. 11 the two bright stars produce a hole into the UKIDSS catalogue and a cluster of non-stellar sources into the VVV catalogue. In Fig. 11 is also presented the persistence image artefact of UKIDSS. Due to differencies in the telescope and camera optics and observation procedures in the surveys artefacts like the persistence image are not expected to happen at the same locations in the two surveys.
Appendix C Known clusters
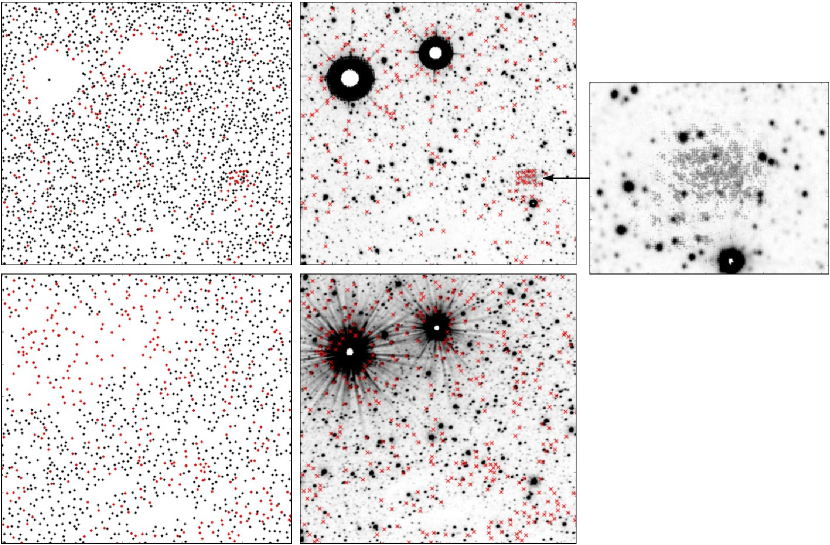
The longitude range is surveyed by both the UKIDSS GPS and the VVV surveys which allows to compare the two data sets (this area is not included in Fig. 1 in Paper I as no cluster candidates were found in this area). A sample of true positive clusters in the fields covered by the both the surveys are shown in Figs. 12-14. The number of entries in the GPS survey is larger than in the VVV survey but the fraction of sources brighter than in K is larger in the latter. Because of the lower background level (the surplus of faint sources in the GPS survey) the true positive clusters trigger more strongly the search algorithm used in this work.
In Fig. 12 are the clusters [BDS2003] 112 and [BDS2003] 113 and in Fig. 13 is the cluster [DB2000] 26. The UKIDSS catalogue has more entries but the cluster of non-stellar sources is much clearer in the VVV catalogue. The K band image and false colour images are very alike for UKIDSS and VVV. For the area around clusters [BDS2003] 112 and 113 98% of the sources are brighter than in K in the VVV survey catalogue but only 69% in the UKIDSS catalogue.
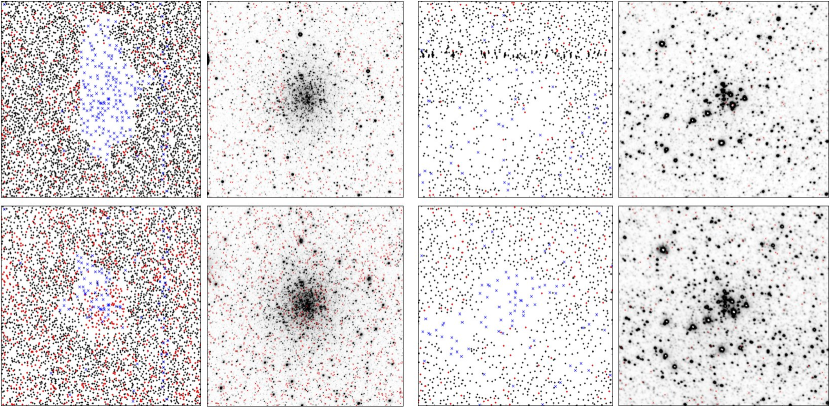
In Fig. 14 are the clusters UKS 1751-24.1 in the first two columns and [BDB2003] G000.16-00.06 in the last two columns. The globular cluster UKS 1751-24.1 produces a hole into the UKIDSS catalogue and a cluster of non-stellar sources into the VVV catalogue. The cluster [BDB2003] G000.16-00.06 produces a hole into the VVV catalogue but leaves no clear traces into the UKIDSS catalogue. Sources listed in 2MASS but not in UKIDSS or VVV are plotted with blue crosses. The 2MASS sources clearly fill the empty spaces in the UKIDSS and VVV survey catalogues. Particularly in the case of UKS 1751-24.1 this bright object produces a fairly large gap into the UKIDSS catalogue.