The Price of a Dark Matter Annihilation
Interpretation of AMS-02 Data
Vassilis C. Spanos
Institute of Nuclear & Particle Physics, NCSR “Demokritos”, GR-15310 Athens, Greece
Abstract
We discuss challenges to a dark matter annihilation interpretation of the excess positron fraction in the cosmic rays observed by the PAMELA, Fermi-LAT and AMS-02 collaborations. The spectra of positrons from annihilations into the leptonic two-body final states like or , fit well the AMS-02 data for the positron ratio and the electron flux. Furthermore, we discuss the hadronic annihilation channels and . However, this interpretation requires a very large annihilation cross section especially for the hadronic channels, conflicting with the unitarity upper limit, unless the positron flux due to annihilations is boosted by a large factor due to inhomogeneities in the galactic halo. In addition, we present predictions within this interpretation for the positron fraction at higher energies for the antiproton flux, and discuss constraints from -ray measurements.
December 2013
1 Introduction
The recent precise data from the AMS-02 experiment [1] have rekindled speculation about the origin of the cosmic-ray positron excess observed previously by the PAMELA [2] and Fermi-LAT [3] collaborations. Similar data have been reported earlier by the HEAT [4] and AMS-01 [5] experiments. The AMS-02 positron ratio data are much more precise than those from PAMELA and Fermi-LAT, and agree better with the former. In addition, they are extending to higher energies. On the other hand, the Fermi-LAT data for the positron ratio (fraction) are less precise and agree less well with PAMELA, thus they will not be used in our analysis. Therefore, in the following, we discuss mainly fits to AMS-02 positron ratio data.
The most conservative interpretation of the positron excess is based on local astrophysical sources such as nearby pulsars [6, 7, 8] or secondary effects [9], whereas less conservative interpretations are based on the annihilations or decays of massive cold dark matter (DM) [10] particles [11, 12, 13, 14, 15]. The positron spectra produced by local sources cannot be predicted precisely, but seem capable of fitting the positron excesses observed by PAMELA, Fermi-LAT and AMS-02. The ‘smoking gun’ for an astrophysical interpretation would be an isotropy in the excess positron flux, but the current sensitivity of the AMS experiment is not enough to test this possibility. The positron spectra produced in DM annihilations depend on the final states, but precise predictions can be made once a specific final state is assumed. Moreover, once the final state is specified, definite predictions can be made for the spectra of other annihilation products such as -rays and antiprotons.
Many theoretical papers have explored potential DM annihilation interpretations of the positron excess, both before and after the recent AMS-02 data release. Our focus here is primarily on challenges that such interpretations must overcome. There is, however, another issue concerning the required annihilation cross section, namely that it may exceed the unitarity limit [16] for plausible values of the initial state angular momentum, . As we see later, this constraint would be violated over much of the DM mass range, that would otherwise be a favored fit to the AMS data. In particular, only the DM annihilation channel , and partly then , survive the unitarily bound.
This challenge may be surmounted by postulating a suitable boost factor originating from inhomogeneities in the density of DM in the galactic halo, e.g., a boost factor would be required to respect the unitarity constraint if TeV. A further boost by a factor would be needed if the cosmological density of DM particles had an exclusively thermal origin. We leave it to astrophysicists to assess whether such large boost factors are plausible, but they do seem rather large.
If one could overcome these challenges arising from the DM annihilation rate, these scenarios can be used to make predictions for the fluxes of antiprotons and -rays. The experimental constraints on the antiproton flux are not yet sufficient to exclude the leptonic annihilation channels and , though future AMS data may provide an interesting constraint. The constraints imposed by available -ray data are, however, already quite severe. Those provided by the flux from the galactic centre (GC) are rather dependent on the halo model, but the constraints on the flux from other sources like the dwarfs spheroidal galaxies (dSph) [17, 18] are not so model-dependent and can provide reliable bounds to the DM annihilation models.
There are two basic approaches to interpret the AMS-02 data using the DM annihilation products. One is to fit the data and interpret them as the cosmic ray (CR) background [11]. Thus, the room that is left to the DM contribution is minute, yielding to masses of the DM particles of the order of few hundreds of GeV and to annihilation cross-section of the order of or less. This results doesn’t require big boost factors to reconcile the AMS-02 constraint with the cosmological DM abundance bound. Similarly, one can interpret the AMS-02 positron ratio data as an effect of secondary reactions [9]. Unfortunately, it appears that this interpretation may not be compatible to the boron to carbon radioactive nuclei ratio data (B/C) [19].
The second approach, which we have adopted here, is more conventional. We adjust the GALPROP conventional model, that is compatible to B/C data, in order to fit precisely, not only the AMS-02 positron ratio data, but also the data that are available for the electron and positron flux by AMS-02 [1] and Fermi-LAT [20] experiments. Having fixed the background we estimate the two main quantities that generally parametrize a simplified DM model: the and , for the four main annihilation channels we study, the leptonic and and the hadronic and . The parameters of any DM annihilation fit are determined mainly by the data in the range GeV, so we use this range in our subsequent fits. One quite important advantage of this choice is that in this energy region, the solar modulation effects are relatively unimportant.
These issues are discussed in section 2. In section 3 we discuss in details the prediction of these DM models for the antiprotons and -ray fluxes. Consequently, we discuss the effects of these constraints on the various DM models. Finally, in the section 4 we give a summary of this paper and we discuss the corresponding perspectives.
2 Background and fits to the electron and positron data
The first step is to model the background positron fraction induced by cosmic-ray interactions, using the GALPROP version 54 [21]. Adjusting its parameters appropriately, and choosing the solar modulation potential MeV, a value compatible to the period that the experimental data were accumulated. In any case, the solar modulation affects mainly the low energy region ( GeV), which as have discussed are not part of our analysis.
| 4 kpc | |
| 25 kpc | |
| 0.33 | |
The basic choice for the set of the GALPROP parameters are those in [22]. These have been chosen to fit the boron to carbon ratio B/C. The values of these are similar to the so-called GALPROP 2D conventional model [21], and they are given in Table 1. In this table, is the diffusion coefficient, and are the half-width and maximum size for 2D galactic model respectively, is the index of the power-law dependence of diffusion coefficient and the Alfvén speed. The breaking point for the nucleus injection spectral index is chosen to be 9 GeV. The spectral index above this, is 2.36 and below 1.82. For the electrons the flux normalization at 100 GeV is . The breaking point for the electron injection spectrum is located at 4 GeV. Below this point the electron injection spectral index is chosen to be , like in [21].
In our analysis, we vary the value of the electron injection spectral index above 4 GeV, around the “conventional” value . In particular, we produce eleven background models starting from the value up to the 2.9, with step 0.05. We are motivated to do so, because we notice in Fig. 1 that varying the the slope of the background contribution to the positron ratio changes significantly. In particular, larger values of provide better alignment to the slope of the AMS-02 data in the high energy region. These eleven GALPROP models will be used as basis to our analysis.
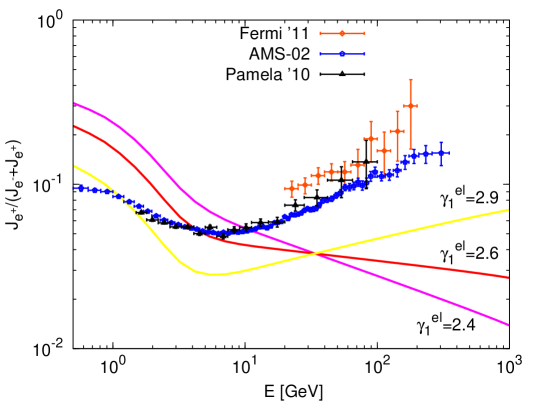
In Fig. 1 we display the three GALPROP models, using (purple curve), 2.6 (red curve) and 2.9 (yellow curve). This is the range of used in this analysis. In addition we present the Fermi-LAT 2011 [3] data (orange rectangles), the recent AMS-02 [1] data (blue pentagons) and the Pamela 2010 [2] (black triangles) positron ratio data. Indeed, we noticed that the large value provides better alignment to the AMS-02, in the range GeV.
The next step is to quantify the dependence of the fit of other data that will be used, on the parameter . In particular, we estimate the including the effect of the DM pair annihilations, for the positron ratio as measured by the AMS-02 experiment [1], for the electron and positron flux as measured by AMS-02 [1] and Fermi-LAT experiments [20, 22] and the antiproton ratio by the PAMELA [23]. As discussed earlier, for the fit we use the high energy data ( GeV). There are two main reasons for this. The effects of the DM pair annihilations are expected to be important in this region. Moreover, this region is not affected significantly from the solar modulation effects.
Concerning the DM halo profile, in our analysis we study two profiles: the Navarro-Frenk-White (NFW) [24] and the Einasto profile [25]. The analysis and the subsequent results that are related to the electron/positron flux, the positron and the antiproton ratios do not depend significantly on the particular choice of the DM halo profile. Thus, in the following the numerical results that are presented are calculated assuming the Einasto profile. On the other hand, we must note that the choice of the DM profile is important for calculating the -ray flux. Thus in section 3 where we present the constraints that are related to photons we plot results both for Einasto and NFW profiles.
Turning now to our main task, we vary the and we estimate using GALPROP the corresponding electron, positron, proton, antiproton and photon backgrounds. Using these backgrounds we estimate the that corresponds to the AMS-02 positron ratio data, including the effect of the DM pair annihilations. As discuss earlier, the DM annihilations channels we employ are , , and . The PYTHIA [26] event simulator is used to model the various spectra of the annihilation products, that will used in our calculation. Since the for the fluxes and ratio we study, depends on the values of and , we would like to fix for a particular GALPROP background the pair (, ) that minimize the of the AMS-02 positron ratio data.
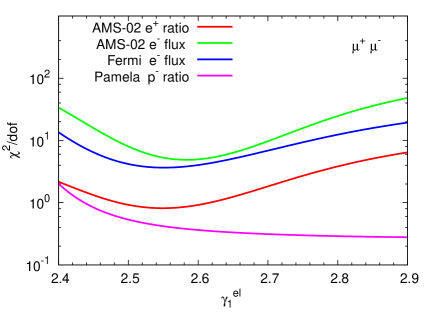
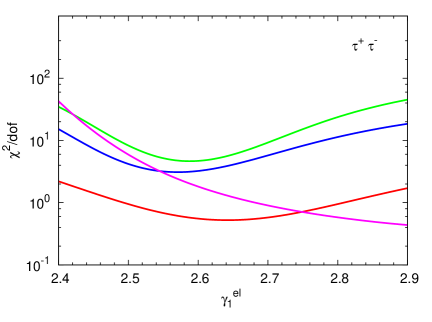
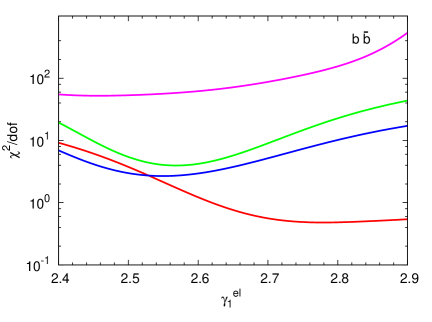
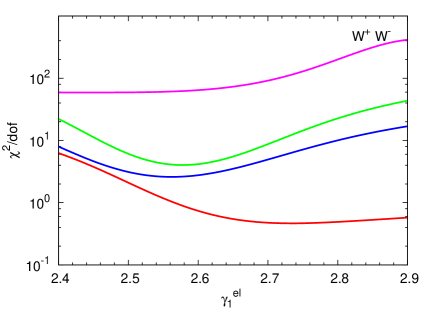
Using these and values we plot in Fig. 2 the per degree of freedom (dof, which is the energy bin in our case) as a function of for the four DM annihilation channels. We calculate the for the AMS-02 positron ratio data [1], for the electron and positron fluxes data from AMS-02 [1] and Fermi-LAT [20], and finally for the antiproton ratio data from PAMELA [23]. Consequently, one can use the curves at Fig. 2 to fix the parameter. We notice indeed that, as the varies, there is a region around where the fit for the electron/positron flux data and for the AMS-02 positron ratio data is quite satisfactory.
In this region the is less than for the AMS-02 data (light green curve) and slightly better for the Fermi-LAT (blue curve). Moreover, the is below unity for the AMS-02 positron ration (red curve). This happens for all the DM channels we study. We notice that the better for the AMS-02 positron ratio data is not an accident, since the chosen values for and are those that minimize it. On the other hand, the quality of the antiproton ratio data fit doesn’t depend on the parameter and is satisfactory for the leptonic channels (, ), everywhere. As it was expected, on the other hand, is quite bad for the hadronic channels (, ). Therefore, the safest choice for the GALPROP background is to fix and this will be done in the following.
3 DM interpretation of the AMS-02 positron data
Having fixed the GALPROP background by choosing , one can evaluate the corresponding values of and that minimize the for the AMS-02 positron ratio data, as well as the electron and positron flux data from the same experiment. These values for the four DM annihilation channels are given in Table 2, and these will used in the our analysis. From this Table is evident that the two leptonic channels favor smaller values for , while the two hadronic channels much larger.
| channel | ||
|---|---|---|
| 465 | ||
| 1758 | ||
| 58546 | ||
| 91728 |
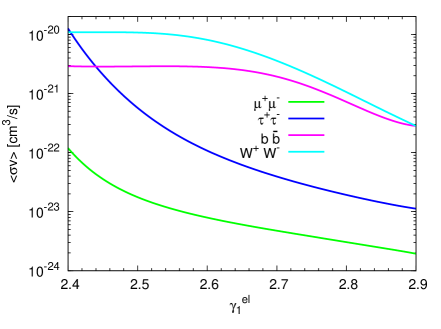
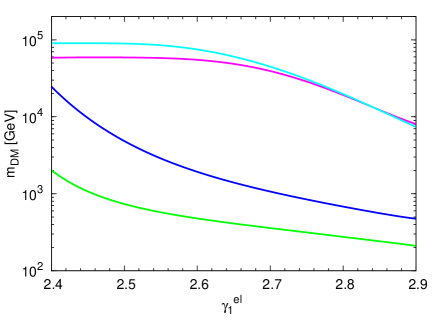
For completeness we display in Fig. 3 the dependence of the (left figure) and (right figure) on , for the annihilation channels we study. In particular, the values displayed in Table 2 correspond to the preferred value . Using these values we have prepared various figures that illustrate the quality of the fits to the electron, positron and antiproton data.
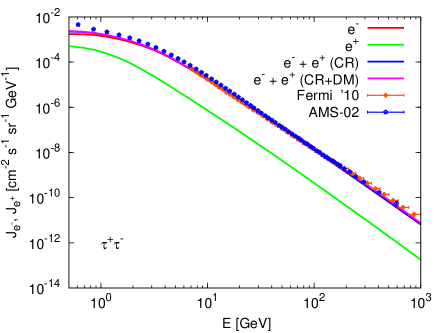
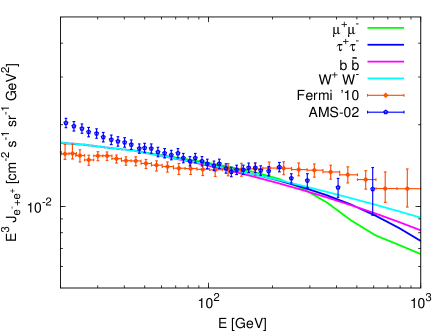
In Fig. 4 (left panel) we display the electron (red curve), the positron (light green curve) and the total (blue curve) flux from the CR background only, using , as discussed before. In addition, the purple line incorporates the effects for the DM annihilations assuming in particular the channel, using the values of Table 2). One can see that in the range GeV, used in our analysis, the total flux describes quite well the data from AMS-02[1] and Fermi-LAT[20]. For the sake of clarity, in the right panel we focused in the energy range GeV and we display the quantity for all the four DM annihilation channels. In the region GeV, where there is an evident disagreement between the AMS-02 and the Fermi-LAT data, the total fluxes are placed between these data. On the other hand, in the region GeV the fluxes appear to fit better the AMS-02 data.
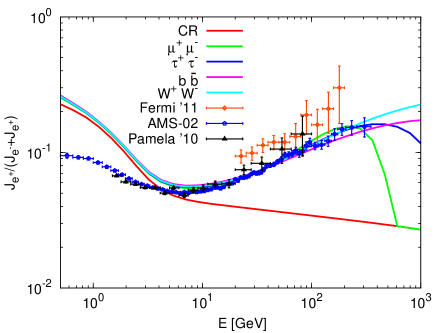
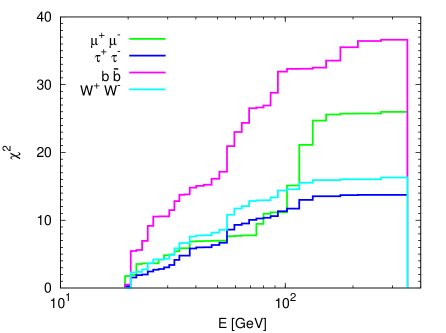
In Fig. 5 we present the fits for the positron ratio data. As expected, in the region GeV where our fit is performed, the predicted ratio describes the AMS-02 data quite well. In the region GeV we notice that the positron ratio for leptonic channels and has a maximum. In particular, for the tau case is maximum is wider. On the other hand, the two hadronic channels ( and ) predict positron ratio that rise continuously in this region. The corresponding ’s for the fit to AMS-02 positron ratio data are displayed in the left panel in Fig. 5. Taking into account that for the AMS-02 data 32 energy bins are used in the region GeV, the appears to be of order of one or less. The channel appears to have slightly bigger , while the data fits much better the data.
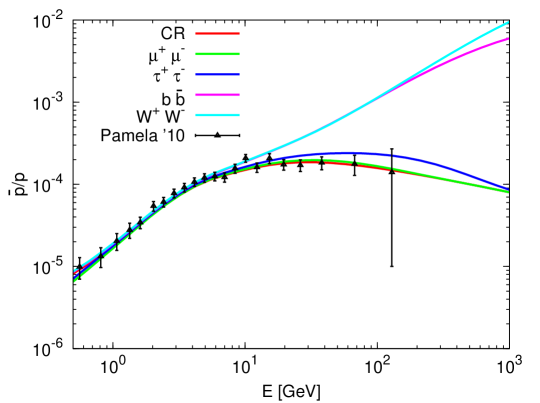
The fraction for the DM annihilation channels we study are displayed in the Fig. 6. The leptonic channels doesn’t produce hadrons directly, but they do produce protons and antiprotons through the W/Z-strahlung associated processes, as described in [27]. The produced antiprotons for those channels can fit quite well the experimental data from PAMELA [23]. On the other hand, as discussed already, the hadronic channels ( and ) produce to many antiprotons and they are compatible to the data.
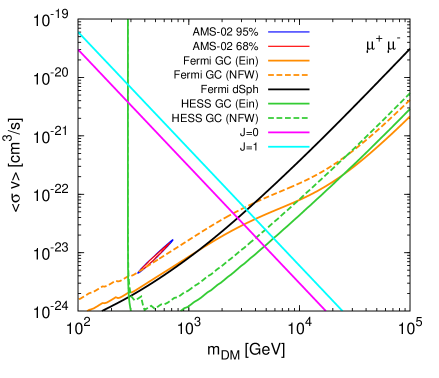
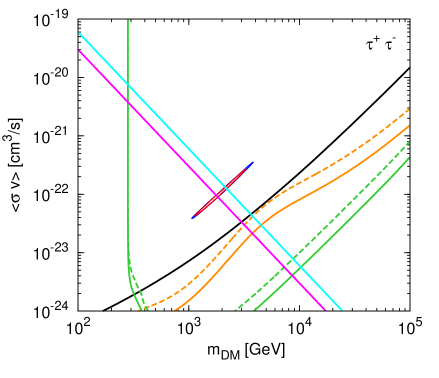
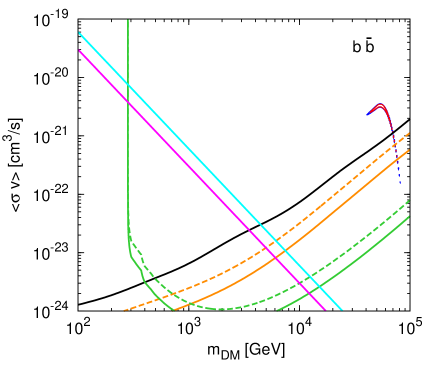
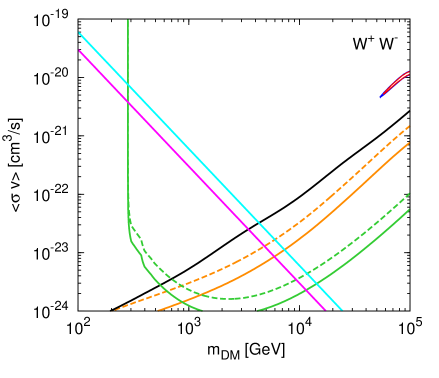
In Fig. 7 we display the 68% (red curve) and 95% (blue curve) confidence level (CL) contours in the (, ) plane, for the four DM annihilation channels under study: , , and , clockwise as labeled. As before, we use the EInasto halo profile to delineate these CL contours, and we the corresponding contours for the NFW profile is very similar. The central points of these regions are the points from the Table 2. In addition, we have marked using a purple (cyan) line the unitarity limit assuming (). Moreover we have plotted various curves that mark the region that excluded due to -ray data from the Fermi-LAT and H.E.S.S [28, 29] experiments. In particular, the orange solid (dashed) curve corresponds to the Fermi-LAT data from the galactic center (GC) following the method of [30], assuming the Einasto (NFW) profie. The black curve marks the exclusion limit using the Fermi-LAT data corresponding to dSph [18]. The solid (dashed) dark green curve marks the H.E.S.S [28] galactic center exclusion limit using again the Einasto (NFW) profie. The Fermi-LAT experiment can detect -rays in the energy range 20 MeV to 300 GeV. On the other hand H.E.S.S detector is sensitive to more energetic photons, from few hundreds GeVs up to few tens of TeVs. In principle, the H.E.S.S limit is more relevant to the our analysis, since AMS-02 positron ratio data favour rather large values of and .
For this study we use the Fermi-LAT data recorded since the beginning of the mission (August 4th, 2008) until very recently (Dec 10th, 2013). We use the package ScienceTools [31] as it is suggested by the collaboration in order to analyze the Fermi-LAT data. Especially for the dSph constraints we combine data from ten dSph galaxies: Bootes I, Carina, Coma Berenices, Draco, Fornax, Sculptor, Segue 1, Sextans, Ursa Major II and Ursa Minor, as it was done in [18], and using the -factors for dSph DM halos used in this analysis, we calculate the combined 95% CL upper limits shown in Fig. 7, using the joint likelihood of these dSph. The excluded region is in agreement with Fig. 2 presented in [18]. To construct the Fermi-LAT bound related to the GC we focus to a 7-degree window centered at the position of the brightest source in the GC: , , as in [32].
As it is apparent from Fig. 7 the two leptonic decay channels: and the central region of the do not violate the unitarity bounds. On the other hand, the two hadronic channels: and do violate them. Concerning the -ray bounds from Fermi-LAT (GC and dSph) and H.E.S.S (GC) the , and are excluded at the 95% CL using these bounds assuming either the NFW or the Einasto halo profile. Only a small tail from the AMS-02 region can be compatible to the Fermi-LAT bounds from GC or dSph, but again is excluded due to H.E.S.S GC data.
4 Summary and Prospects
We have explored the possibility to explain the recent AMS-02 positron ratio data using the effects that related to the DM annihilations. We study two leptonic channels , and two hadronic , . We employ for our analysis both Einasto and NFW halo DM profiles.
We calculate the CR background for electron, positron, protons, antiprotons and photons using the GALPROP code. We perform a analysis based on the the GALPROP conventional model, that is known to be compatible to B/C data. We fix the CR background parameters in such way that minimize the not only for the AMS-02 positron ratio data, but also for the data that are available for the electron and positron flux from AMS-02 and Fermi-LAT collaborations. As basis for our analysis we use the high energy bins with GeV, since these are affected mainly from the DM annihilations. On the other hand, this region is not sensitive to the solar modulation effects. The statistical analysis, enable us to estimate the and , the parameters of the DM model for the main annihilation channels we study.
We find that, among simple models for the annihilation final state, the best fit is provided by leptonic channels, like or . Especially the is among the more plausible final states in, e.g., supersymmetric models of DM, especially in the stau-coannihilation region. And indeed, the positron ratio prediction for the , and to a less extent for the channel, describes the recent AMS-02 positron ration data strikingly well.
However, as other authors have also emphasized, the annihilation cross section required in such a scenario is relatively large, and the stronger lower bound on the DM particle mass from AMS-02 compared to PAMELA, implies that the minimum cross section must in turn be larger, many orders of magnitude larger than what would be required for a DM candidate that was previously in thermal equilibrium to freeze out with the cosmological DM density inferred today. This is not in itself a problem, since one could postulate the presence of an additional, non-thermal, origin of the rest of the requisite density.
There is, however, another important issue with size of the required annihilation cross section. These large cross sections may exceed the unitarity limit , where the initial state angular momentum (1) corresponds to s(p)-wave processes. As we saw this constraint is violated over a great part of the (, ) plane. In particular, only the and a part of region that fit to the AMS data, survive the unitarily bound. The hadronic DM annihilation channel and clearly vilote the unitarity limit.
Furthermore, we discussed the constraints imposed to these models from -ray data from Fermi-LAT and H.E.S.S experiments. Unfortunately, practically all the channels both the leptonic and the hadronic violate the 95% CL bound from the Fermi-LAT related to the GC or the main dSph galaxies. The H.E.S.S exclusion limit is more severe and again excludes the regions of the parameter space of the DM models that can explain the AMS-02 data.
Concluding we notice, that the better precision of the AMS-02 data and their greater energy range provide stronger constraints than PAMELA on the mass and annihilation cross section of any putative DM particle. In particular, the AMS-02 data increase the lower limit on any such dark mass particle. As a consequence, one can make interesting predictions for the magnitude of the positron excess at energies GeV, beyond the energy range of the AMS-02 data released so far. Specifically, within a model of DM annihilation to , the AMS data restrict the rate at which the positron fraction can diminish at energies GeV.
Acknowledgements
The author acknowledges useful comments on this work from John Ellis and Keith Olive. He also thanks CERN TH Division for its hospitality, where part of this work was done. This visit was supported by London Centre for Terauniverse Studies (LCTS), using funding from the European Research Council via the Advanced Investigator Grant 267352.
References
- [1] M. Aguilar et al. [AMS Collaboration], Phys. Rev. Lett. 110 (2013) 14, 141102.
- [2] O. Adriani et al. [PAMELA Collaboration], Nature 458 (2009) 607 [arXiv:0810.4995 [astro-ph]]; O. Adriani, G. C. Barbarino, G. A. Bazilevskaya, R. Bellotti, M. Boezio, E. A. Bogomolov, L. Bonechi and M. Bongi et al., Astropart. Phys. 34 (2010) 1 [arXiv:1001.3522 [astro-ph.HE]].
- [3] M. Ackermann et al. [Fermi LAT Collaboration], Phys. Rev. Lett. 108 (2012) 011103 [arXiv:1109.0521 [astro-ph.HE]].
- [4] S. W. Barwick et al. [HEAT Collaboration], Astrophys. J. 482 (1997) L191 [astro-ph/9703192].
- [5] M. Aguilar et al. [AMS Collaboration], Phys. Rept. 366 (2002) 331 [Erratum-ibid. 380 (2003) 97].
- [6] P. -F. Yin, Z. -H. Yu, Q. Yuan and X. -J. Bi, Phys. Rev. D 88 (2013) 023001 [arXiv:1304.4128 [astro-ph.HE]].
- [7] T. Linden and S. Profumo, Astrophys. J. 772 (2013) 18 [arXiv:1304.1791 [astro-ph.HE]].
- [8] I. Cholis and D. Hooper, Phys. Rev. D 88 (2013) 023013 [arXiv:1304.1840 [astro-ph.HE]].
- [9] K. Blum, B. Katz and E. Waxman, Phys. Rev. Lett. 111 (2013) 211101 [arXiv:1305.1324 [astro-ph.HE]].
- [10] J. R. Ellis, J. S. Hagelin, D. V. Nanopoulos, K. A. Olive and M. Srednicki, Nucl. Phys. B 238, 453 (1984); see also H. Goldberg, Phys. Rev. Lett. 50, 1419 (1983).
- [11] L. Bergstrom, T. Bringmann, I. Cholis, D. Hooper and C. Weniger, Phys. Rev. Lett. 111 (2013) 171101 [arXiv:1306.3983 [astro-ph.HE]]; A. Ibarra, A. S. Lamperstorfer and J. Silk, arXiv:1309.2570 [hep-ph].
- [12] Q. Yuan, X. -J. Bi, G. -M. Chen, Y. -Q. Guo, S. -J. Lin and X. Zhang, arXiv:1304.1482 [astro-ph.HE].
- [13] H. -B. Jin, Y. -L. Wu and Y. -F. Zhou, JCAP 1311 (2013) 026 [arXiv:1304.1997 [hep-ph]].
- [14] K. R. Dienes, J. Kumar and B. Thomas, Phys. Rev. D 88 (2013) 103509 [arXiv:1306.2959 [hep-ph]].
- [15] S. Li and Y. Luo, arXiv:1310.3466 [hep-ph].
- [16] K. Griest and M. Kamionkowski, Phys. Rev. Lett. 64 (1990) 615.
- [17] A. A. Abdo, M. Ackermann, M. Ajello, W. B. Atwood, L. Baldini, J. Ballet, G. Barbiellini and D. Bastieri et al., Astrophys. J. 712 (2010) 147 [arXiv:1001.4531 [astro-ph.CO]]; A. A. Abdo et al. [The Fermi-LAT Collaboration], Phys. Rev. Lett. 104 (2010) 101101 [arXiv:1002.3603 [astro-ph.HE]].
- [18] M. Ackermann et al. [Fermi-LAT Collaboration], Phys. Rev. Lett. 107 (2011) 241302 [arXiv:1108.3546 [astro-ph.HE]].
- [19] I. Cholis and D. Hooper, arXiv:1312.2952 [astro-ph.HE].
- [20] M. Pesce-Rollins [Fermi-LAT Collaboration], arXiv:0912.3611 [astro-ph.HE]; A. A. Abdo et al. [Fermi LAT Collaboration], Phys. Rev. Lett. 102 (2009) 181101 [arXiv:0905.0025 [astro-ph.HE]]; M. Ackermann et al. [Fermi LAT Collaboration], Phys. Rev. D 82 (2010) 092004 [arXiv:1008.3999 [astro-ph.HE]].
- [21] A. W. Strong and I. V. Moskalenko, Astrophys. J. 509 (1998) 212 [astro-ph/9807150]; A. E. Vladimirov, S. W. Digel, G. Johannesson, P. F. Michelson, I. V. Moskalenko, P. L. Nolan, E. Orlando and T. A. Porter et al., Comput. Phys. Commun. 182 (2011) 1156 [arXiv:1008.3642 [astro-ph.HE]].
- [22] D. Grasso et al. [FERMI-LAT Collaboration], Astropart. Phys. 32 (2009) 140 [arXiv:0905.0636 [astro-ph.HE]].
- [23] O. Adriani, G. C. Barbarino, G. A. Bazilevskaya, R. Bellotti, M. Boezio, E. A. Bogomolov, L. Bonechi and M. Bongi et al., Phys. Rev. Lett. 102 (2009) 051101 [arXiv:0810.4994 [astro-ph]]; O. Adriani et al. [PAMELA Collaboration], Phys. Rev. Lett. 105 (2010) 121101 [arXiv:1007.0821 [astro-ph.HE]].
- [24] J. F. Navarro, C. S. Frenk and S. D. M. White, Astrophys. J. 462 (1996) 563 [arXiv:astro-ph/9508025]; J. F. Navarro, C. S. Frenk and S. D. M. White, Astrophys. J. 490 (1997) 493 [arXiv:astro-ph/9611107].
- [25] J. Einasto, “Influence of the atmospheric and instrumental dispersion on the brightness distribution in a galaxy , Trudy Inst. Astrofiz. Alma-Ata 51 (1965) 87; A. W. Graham, D. Merritt, B. Moore, J. Diemand and B. Terzic, Astron. J. 132 (2006) 2685 [arXiv:astro-ph/0509417]; Astron. J. 132 (2006) 2701 [arXiv:astro-ph/0608613]; Astron. J. 132 (2006) 2711 [arXiv:astro-ph/0608614].
- [26] T. Sjostrand, S. Mrenna, P. Z. Skands, JHEP 0605 (2006) 026 [hep-ph/0603175].
- [27] R. Flores, K. A. Olive and S. Rudaz, Phys. Lett. B 232, 377 (1989); N. F. Bell, J. B. Dent, T. D. Jacques and T. J. Weiler, Phys. Rev. D 78, 083540 (2008) [arXiv:0805.3423 [hep-ph]]; P. Ciafaloni, D. Comelli, A. Riotto, F. Sala, A. Strumia, A. Urbano, JCAP 1103 (2011) 019 [arXiv:1009.0224 [hep-ph]]; N. F. Bell, J. B. Dent, T. D. Jacques and T. J. Weiler, Phys. Rev. D 83, 013001 (2011) [arXiv:1009.2584 [hep-ph]]; N. F. Bell, J. B. Dent, T. D. Jacques and T. J. Weiler, arXiv:1101.3357 [hep-ph]. P. Ciafaloni, M. Cirelli, D. Comelli, A. De Simone, A. Riotto, A. Urbano, [arXiv:1104.2996 [hep-ph]]; N. F. Bell, J. B. Dent, A. J. Galea, T. D. Jacques, L. M. Krauss and T. J. Weiler, arXiv:1104.3823 [hep-ph].
- [28] A. Abramowski et al. [H.E.S.S. Collaboration], Phys. Rev. Lett. 106 (2011) 161301 [arXiv:1103.3266 [astro-ph.HE]].
- [29] F. Aharonian et al. [H.E.S.S. Collaboration], Astron. Astrophys. 508 (2009) 561 [arXiv:0905.0105 [astro-ph.HE]].
- [30] J. Ellis, K. A. Olive and V. C. Spanos, JCAP 1110 (2011) 024 [arXiv:1106.0768 [hep-ph]].
- [31] http://fermi.gsfc.nasa.gov/ssc/data/analysis/software
- [32] V. Vitale and A. Morselli, for the Fermi-LAT Collaboration, arXiv:0912.3828 [astro-ph.HE].