Stochastic Desertification
Abstract
The process of desertification is usually modeled as a first order transition, where a change of an external parameter (e.g. precipitation) leads to a catastrophic bifurcation followed by an ecological regime shift. However, vegetation elements like shrubs and trees undergo a stochastic birth-death process with an absorbing state; such a process supports a second order continuous transition with no hysteresis. We present a numerical study of a minimal model that supports bistability and catastrophic shift on spatial domain with demographic noise and an absorbing state. When the external parameter varies adiabatically the transition is continuous and the front velocity renormalizes to zero at the extinction transition. Below the transition one may identify three modes of desertification: accumulation of local catastrophes, desert invasion and global collapse. A catastrophic regime shift occurs as a dynamical hysteresis, when the pace of environmental variations is too fast. We present some empirical evidence, suggesting that the mid-holocene desertification of the Sahara was, indeed, continuous.
pacs:
87.10.Mn,87.23.Cc,64.60.Ht,05.40.CaThe catastrophic bifurcation and its statistical mechanics analog, the first order transition, play a central role in the physical sciences. In these processes a tiny change in the value of an external parameter leads to a sudden jump of the system from one phase to another. This change is irreversible and is accompanied by hysteresis: once the system relaxed to its new phase, it will not recover even when the external parameters are restored.
The relevance of these processes to the ecology of population and communities has been established while ago May (1977). Recently, there is a growing concern about the possible occurrence of regime shifts in ecological systems Scheffer et al. (2001); Rietkerk et al. (2004); Kéfi et al. (2007); Scheffer et al. (2009). The anthropogenic changes of local and global environmental parameters from habitat fragmentation to the increasing levels of CO2 in the atmosphere - raise anxiety about the possibility of an abrupt and irreversible catastrophe that may be destructive to the functions and the stability of an ecosystem Duraiappah et al. (2005). This concern triggered an intensive search for empirical evidence that may allow one to identify an impending tipping point, where the most popular suggestion is to use the phenomenon of critical slowing down Dakos et al. (2008); Scheffer et al. (2009); Boettiger and Hastings (2012); Lenton (2011); Dai et al. (2012, 2013). Other suggested early warning indicators, especially for sessile species, deal with spatial patterns and the level of aggregation Scanlon et al. (2007); Kéfi et al. (2007); Solé (2007)
Of particular importance is the process of desertification, which is considered as an irreversible shift from the ”active” vegetation state to the ”inactive” bare soil state, resulting from an increased pressure (e.g., overgrazing, declines in precipitation). As drylands cover about of Earth land surface, desertification affects about 250 million people around the world Reynolds et al. (2007). Various models show that, when the vegetation state has a positive feedback, like an increased runoff interception or reduced evaporation close to vegetation patches, the system supports two attractive fixed points (alternate steady states) Solé (2007); Suding et al. (2004). The bare soil fixed point is stable, since the desert is robust against small perturbation (a small amount of vegetation) for which the positive feedback is too weak while the active state is self-sustained. Accordingly, the system may cross over from vegetation to bare soil in two routes: First, a disturbance that pushes the system to the basin of attraction of the bare soil fixed point, and second, when the vegetation fixed point losses stability, i.e., when a change of an external parameter takes the system over its tipping point Rietkerk et al. (1996).
However, the bare soil is an absorbing state: it corresponds to a complete destruction of the vegetation (or at least of a given species), hence it is not affected by noise. In a finite system the process must reach eventually the absorbing state. In the thermodynamic limit the steady state solution depends on the ratio between the rate of local extinction and the chance of recolonization from neighboring sites. This dynamics resembles the contact (SIS) process Hinrichsen (2000); Kessler and Shnerb (2012) where the extinction transition is continuous and belongs to the directed percolation (DP) universality class. Accordingly, one should expect a reversible second order desertification, with no jumps, no hysteresis and no tipping point.
Here we present a study of a minimal model for desertification with demographic noise. When the external parameter sweep is adiabatic the transition is indeed DP continuous, as Kockelkoren and Chaté (2002) have already pointed out. We analyze numerically the system beyond the extinction transition point, showing that it admits different modes of desertification in different areas of the parameter space. We identify these modes, consider the effect of the absorbing state on the velocity of the front, and discuss (qualitatively) the conditions under which the deterministic first order transition scenario is a reasonable approximation.
The model used below is a simple version of the Ginzburg-Landau (GL) equation where the biomass density vanishes at one of the fixed points,
| (1) |
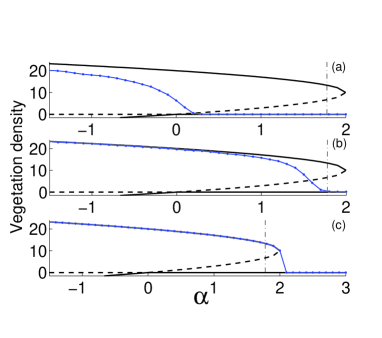
Here is the diffusion constant, The control parameter represent the effect of the (changing) environment, is a positive constant that represents local facilitation, and the positive constant accounts for the finite carrying capacity of the system. When the environment is hostile [positive value of ”stress parameter” , in Eq. (1)] the absorbing (desert) state is locally stable but local facilitation may allow the system to have another stable state at a finite vegetation density. Negative values of correspond to better environmental conditions, where the absorbing state is unstable (See the bifurcation diagram (lines) in Figure 1).
The deterministic equation (1) admits one or two homogenous solutions, depending on the value of . Catastrophic desertification occurs beyond the tipping point, i.e., when , where the system collapses to its desert state following a saddle-node bifurcation. To recover vegetation, the stress parameter should cross zero (transcritical bifurcation), so the regime shift is irreversible.
When the initial conditions are inhomogeneous, the desert invades the vegetation to the right of the Maxwell (melting) point , and vegetation invades on its left side (see Fig. 1) . The importance of the Maxwell point was emphasized recently by Bel et. al. Bel et al. (2012) (see also Durrett and Levin Durrett and Levin (1994)): once the system crosses the Maxwell point, any large disturbance that will generate a large-enough bare-soil region will invade the rest of the system and lead to desertification.
Stochasticity in an ecosystem occurs even when rates of demographic processes (birth, death, migration etc.) are independent of time, reflecting the randomness of the birth/death process at the individual level Scanlon et al. (2007); Kéfi et al. (2007); Manor and Shnerb (2008). For example, if represent a unit of biomass (a shrub, say), the quadratic term of Eq 1 may emerge as the deterministic limit of the process , the cubic term emerges from and the linear term corresponds to (if ) or if . Demographic stochasticity of this kind yields, for a population of size , fluctuations amplitude that scale with . As mentioned above, in a single site or a finite domain the system eventually reach the absorbing state at , although the timescale for this process may be large Ovaskainen and Meerson (2010); Kessler and Shnerb (2007a). For a spatial system, with migration of individuals to neighboring sites in a rate proportional to , the system undergoes an extinction transition when the rate of recolonization of empty sites is equal to the rate of local extinctions Hinrichsen (2000).
Eq. (1) appears to be the deterministic limit of this stochastic process, obtained when , the number of particles per site (the model is defined off lattice, but any discretization procedure should involve, at least indirectly, a UV cutoff defined by the ”size” of an individual, or the interaction range), goes to infinity. This convergence of a stochastic process to the corresponding PDE’s was analyzed in Kessler and Shnerb (2008, 2012), and was shown to fail close to the extinction transition, when fluctuations govern the dynamics even in the large limit. This failure is limited to a narrow region close to the transition point, and the width of the transition zone approaches zero like , where the exponent depends on the upper critical dimension of the transition and on the dimensionality of the system. The analysis of Kessler and Shnerb (2008, 2012) takes into account two prototypes of out-of-equilibrium phase transitions, the SIS process Kermack and McKendrick (1932) that belongs to the directed percolation universality class and the SIR process Kessler and Shnerb (2007b) that belongs to the dynamic percolation universality class. However, these two transitions are continuous even in the deterministic limit, while our system admits a first-order transition when
Kockelkoren and Chaté Kockelkoren and Chaté (2002) have already discussed this issue, showing that the extinction transition is indeed second order (DP) once the absorbing state is taken into account. This result is demonstrated in Figure 1. Our simulation technique is close to the split-step method used by Kockelkoren and Chaté (2002); Moro (2004); Bonachela et al. (2012): an Euler integration of Eq. 1 (with , lattice of sites, asynchronous update) is interrupted every generations when the value of at every site is replaced by an integer, taken from a Poisson distribution with an average . We have verified that the transition has, indeed, the critical exponent of the directed percolation equivalence class Hinrichsen (2000).
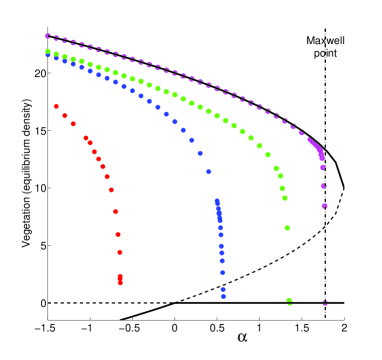
In Fig 1 the equilibrium density is plotted as a function of for different values of and , together with the deterministic bifurcation diagram. The stochastic transition is indeed continuous, but one observes a new feature: even close to the deterministic limit (large values of or ) the transition point cannot cross the Maxwell line. As long as and are finite, local extinctions happen with nonzero probability Ovaskainen and Meerson (2010), and once a local ”hole” is opened, it will spread and overtake the vegetation if the system is above the Maxwell point Bel et al. (2012). This implies that the failure of the system to converge to its deterministic behavior in the limit is not limited to a single point (like in the SIS/SIR cases) but to a finite domain between the Maxwell point and the tipping point.
Figure 1 also indicates that, when the noise is relatively weak, the vegetation steady state density decays linearly as the system approaches the extinction transition. The DP theory predicts a steady state density that scales like , where is the distance from the transition and below . This is indeed the case very close to the transition point (result not shown here) but here the system should converge to the deterministic limit at large , so the transition region is very narrow and the growth appears to be linear.
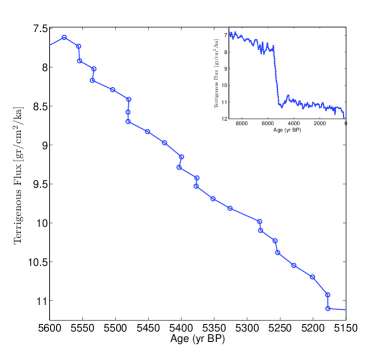
The hypothesis of a second-order, reversible desertification transition with a linear decay of the steady-state density in the transition regime, is supported by two pieces of data. Reversibility is suggested by a few recent studies, showing a recovery from desertification when the external pressure (grazing, in most cases) has been removed Fuhlendorf et al. (2001); Rasmussen et al. (2001); Valone et al. (2002); Zhang et al. (2005); Allington and Valone (2010). Some evidence for linearity are suggested in Figure 2, where the desertification process of the Sahara during the mid-Holocene is traced through the eolian dust record of Site 658C deMenocal et al. (2000). The flux of terrigenous sediments seem to grow linearly during the transition period, in agreement with the predictions of our model.
Note that the Sahara desertification data are usually interpreted (see, e.g., Scheffer et al. (2001)) as an evidence for a catastrophic, first order transition, since the growth of terrigenous sediments percentage through time appears to be exponential. However, as stressed in Adkins et al. (2006), the use of component percentages in marine sediments can be misleading, because the total sediment must always sum to 100. The long timescales involved (about 500 years) also suggest an alternative mechanism.
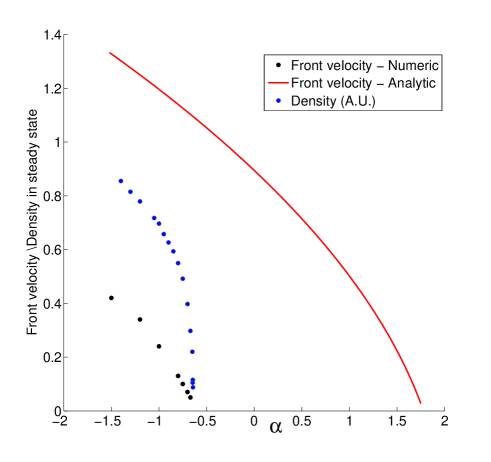
By studying the system with inhomogeneous initial conditions and monitoring the growth of the overall density vs. time we have measured the front velocity . In the deterministic limit the velocity satisfies,
| (2) |
where
| (3) |
The velocity changes sign in the Maxwell point, where the front changes its characteristic, from a Ginzburg-Landau front to Fisher type II, at the transcritical bifurcation Ben-Jacob et al. (1985); Kessler et al. (1998). However, as shown in Figure 3, under demographic stochasticity the velocity renormalizes to zero at the extinction transition point.
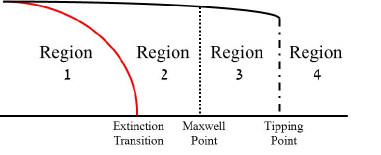
The emerging insights are summarized in Fig 4. For every set of parameters (diffusion, noise, nonlinear interaction) the system admits four different phases. Above the extinction transition (region 1) vegetation saturates to an equilibrium value and will invade a nearby bare-soil region. The steady state density and the front velocity both vanishes in all other regions, but desertification takes place in different modes. In region 2 (between the extinction point and the Maxwell point) the desert does not invade, and the transition comes about by accumulation of local extinctions eventuating a global collapse. In region 3 these collapses are accompanied by the desert invasion predicted by Bel et al. (2012) and the dominant effect depends on the size of the system and the velocity of the front. Finally, beyond the tipping point (Region 4) the deterministic active fixed point loses its stability and vegetation collapse exponentially, simultaneously all over the place.
All in all, for every system that admits an absorbing state, if environmental changes (like the rate of variations of ) are adiabatic, the phase transition is a continuous, second order one, without hysteresis. The catastrophe scenario - a global collapse after the crossing of the tipping point, followed by an irreversible transition between alternative stable state, can never be realized. As long as is finite, the transition is second order and, even more importantly, it cannot take place beyond the Maxwell point, so the tipping point is completely disparate from the extinction transition. Accordingly, the attempts to identify an impending catastrophe by analyzing fluctuation dynamics, utilizing the critical slowing down as an early warning signal, appears to be useless.
The studies of catastrophic shifts and early warning signals may be relevant to the desertification problem only if the environmental change is non-adiabatic, where the irreversibility has to be interpreted as a dynamical hysteresis Tredicce et al. (2004). This behavior is demonstrated in Figure 5. Dynamical hysteresis is unavoidable close to the extinction transition when the response of the system becomes slower than the pace of environmental change, but its effect may be very weak.
As each of the regions 1-4 (in Fig. 4) has its own characteristic timescale, the conditions for a ”rapid” sweep rate are different in different regions. The deterministic picture is relevant only when the sweep rate for is faster than any other process in the system. However, in such a case the implementation of critical slowing down indicators close to the tipping point, assuming that one can trace the relaxation of fluctuations before the catastrophic shift, may also become inefficient.
acknowledgments We would like to thank Baruch Meerson, Yoram Louzoun, Hila Behar, David Kessler and Ehud Meron for helpful discussions and useful comments. This work was supported by the Israeli Ministry of science TASHTIOT program and by the Israeli Science Foundation BIKURA grant no. 1026/11.
References
- May (1977) R. M. May, Nature 269, 471 (1977).
- Scheffer et al. (2001) M. Scheffer, S. Carpenter, J. A. Foley, C. Folke, and B. Walker, Nature 413, 591 (2001).
- Rietkerk et al. (2004) M. Rietkerk, S. C. Dekker, P. C. de Ruiter, and J. van de Koppel, Science 305, 1926 (2004).
- Kéfi et al. (2007) S. Kéfi, M. Rietkerk, C. L. Alados, Y. Pueyo, V. P. Papanastasis, A. ElAich, and P. C. De Ruiter, Nature 449, 213 (2007).
- Scheffer et al. (2009) M. Scheffer, J. Bascompte, W. A. Brock, V. Brovkin, S. R. Carpenter, V. Dakos, H. Held, E. H. Van Nes, M. Rietkerk, and G. Sugihara, Nature 461, 53 (2009).
- Duraiappah et al. (2005) A. K. Duraiappah, S. Naeem, T. Agardy, and M. E. Assessment, Ecosystems and human well-being: biodiversity synthesis (Island Press Washington DC, 2005).
- Dakos et al. (2008) V. Dakos, M. Scheffer, E. H. van Nes, V. Brovkin, V. Petoukhov, and H. Held, Proceedings of the National Academy of Sciences 105, 14308 (2008).
- Boettiger and Hastings (2012) C. Boettiger and A. Hastings, Proceedings of the Royal Society B: Biological Sciences 279, 4734 (2012).
- Lenton (2011) T. M. Lenton, Nature Climate Change 1, 201 (2011).
- Dai et al. (2012) L. Dai, D. Vorselen, K. S. Korolev, and J. Gore, Science 336, 1175 (2012).
- Dai et al. (2013) L. Dai, K. S. Korolev, and J. Gore, Nature 496, 355 (2013).
- Scanlon et al. (2007) T. M. Scanlon, K. K. Caylor, S. A. Levin, and I. Rodriguez-Iturbe, Nature 449, 209 (2007).
- Solé (2007) R. Solé, Nature 449, 151 (2007).
- Reynolds et al. (2007) J. F. Reynolds, D. M. S. Smith, E. F. Lambin, B. Turner, M. Mortimore, S. P. Batterbury, T. E. Downing, H. Dowlatabadi, R. J. Fernández, J. E. Herrick, et al., science 316, 847 (2007).
- Suding et al. (2004) K. N. Suding, K. L. Gross, and G. R. Houseman, Trends in Ecology & Evolution 19, 46 (2004).
- Rietkerk et al. (1996) M. Rietkerk, P. Ketner, L. Stroosnijder, and H. H. Prins, Journal of Range Management pp. 512–519 (1996).
- Hinrichsen (2000) H. Hinrichsen, Advances in physics 49, 815 (2000).
- Kessler and Shnerb (2012) D. A. Kessler and N. M. Shnerb, Physical Review E 85, 051138 (2012).
- Kockelkoren and Chaté (2002) J. Kockelkoren and H. Chaté, arXiv preprint cond-mat/0208497 (2002).
- Bel et al. (2012) G. Bel, A. Hagberg, and E. Meron, Theoretical Ecology 5, 591 (2012).
- Durrett and Levin (1994) R. Durrett and S. Levin, Theoretical population biology 46, 363 (1994).
- Manor and Shnerb (2008) A. Manor and N. M. Shnerb, Journal of theoretical biology 253, 838 (2008).
- Ovaskainen and Meerson (2010) O. Ovaskainen and B. Meerson, Trends in ecology & evolution 25, 643 (2010).
- Kessler and Shnerb (2007a) D. A. Kessler and N. M. Shnerb, Journal of Statistical Physics 127, 861 (2007a).
- Kessler and Shnerb (2008) D. A. Kessler and N. M. Shnerb, Journal of Physics A: Mathematical and Theoretical 41, 292003 (2008).
- Kermack and McKendrick (1932) W. O. Kermack and A. G. McKendrick, Proceedings of the Royal society of London. Series A 138, 55 (1932).
- Kessler and Shnerb (2007b) D. A. Kessler and N. M. Shnerb, Physical Review E 76, 010901 (2007b).
- Moro (2004) E. Moro, Physical Review E 70, 045102 (2004).
- Bonachela et al. (2012) J. A. Bonachela, M. A. Muñoz, and S. A. Levin, Journal of Statistical Physics 148, 723 (2012).
- Fuhlendorf et al. (2001) S. D. Fuhlendorf, D. D. Briske, and F. E. Smeins, Applied Vegetation Science 4, 177 (2001).
- Rasmussen et al. (2001) K. Rasmussen, B. Fog, and J. E. Madsen, Global Environmental Change 11, 271 (2001).
- Valone et al. (2002) T. J. Valone, M. Meyer, J. H. Brown, and R. M. Chew, Conservation Biology 16, 995 (2002).
- Zhang et al. (2005) J. Y. Zhang, Y. Wang, X. Zhao, G. Xie, and T. Zhang, New Zealand Journal of Agricultural Research 48, 277 (2005).
- Allington and Valone (2010) G. Allington and T. Valone, Journal of Arid Environments 74, 973 (2010), ISSN 0140-1963, URL http://www.sciencedirect.com/science/article/pii/S0140196310000054.
- deMenocal et al. (2000) P. deMenocal, J. Ortiz, T. Guilderson, J. Adkins, M. Sarnthein, L. Baker, and M. Yarusinsky, Quaternary Science Reviews 19, 347 (2000).
- Adkins et al. (2006) J. Adkins, P. deMenocal, and G. Eshel, Paleoceanography 21, PA1206 (2006).
- Ben-Jacob et al. (1985) E. Ben-Jacob, H. Brand, G. Dee, L. Kramer, and J. Langer, Physica D: Nonlinear Phenomena 14, 348 (1985).
- Kessler et al. (1998) D. A. Kessler, Z. Ner, and L. M. Sander, Physical Review E 58, 107 (1998).
- Tredicce et al. (2004) J. R. Tredicce, G.-L. Lippi, P. Mandel, B. Charasse, A. Chevalier, and B. Picque, American Journal of Physics 72, 799 (2004).