Stellar Populations and the Star Formation Histories of LSB Galaxies: IV Spitzer Surface Photometry of LSB Galaxies
Abstract
Surface photometry at 3.6m is presented for 61 low surface brightness (LSB) galaxies ( 3.6m mag arcsecs-2). The sample covers a range of luminosity from 11 to 22 in and size from 1 to 25 kpc. The morphologies in the mid-IR are comparable to those in the optical with 3.6m imaging reaches similar surface brightness depth as ground-based optical imaging. A majority of the resulting surface brightness profiles are single exponential in shape with very few displaying upward or downward breaks. The mean color of LSB is 2.3 with a standard deviation of 0.5. Color-magnitude and two color diagrams are well matched to models of constant star formation, where the spread in color is due to small changes in the star formation rate (SFR) over the last 0.5 Gyrs as also suggested by the specific star formation rate measured by H.
1 Introduction
The primary characteristic of a galaxy is its luminosity and the deduced stellar mass from that luminosity. Of secondary interest is how that luminosity is distributed (again, a proxy for the stellar mass distribution) and galaxy color, which reflect the properties of the underlying stellar population. The run of luminosity with radius (surface brightness profiles) continue to be the most direct method of deriving the size, luminosity and density scale parameters that are key to understanding the details of galaxy formation. The total stellar mass and its distribution, as given by surface brightness profiles, also play important roles in the various scaling relations between galaxy types. For example, the Tully-Fisher relation (TF; Tully & Fisher 1977) is one of the strongest correlations in extragalactic astronomy. It provides a vital constraint on galaxy formation theory (e.g., Eisenstein & Loeb 1996; McGaugh & de Blok 1998; Courteau & Rix 1999; van den Bosch 2000; Navarro & Steinmetz 2000; Mo & Mao 2000; 2004).
The dominant uncertainty in the TF relation is the deduction of stellar mass from luminosity. In order to constrain the luminosity to stellar mass relationship, our stellar population models agree that longer wavelength observations more accurately map into stellar mass (Bruzual & Charlot 2007). Empirically, the scatter in the Tully-Fisher relation declines as one goes from blue to red to NIR wavelengths (Verheijen 2001), consistent with the expected decrease in scatter in . However, LSB galaxies are, by definition, very faint in luminosity density, typically well below the natural sky brightness. This is particularly a problem at near-IR wavelengths where the sky brightness from the ground are several magnitudes brighter than the sky at near-UV wavelengths. To this end, the longer wavelength IRAC data from the Spitzer orbiting telescope provides a unique probe of stellar mass, dust and star formation, useful for testing whether extinction or fluctuations in the star formation rate cause deviations from the TF relation.
The goal of this paper, the fourth in our series to understand the star formation history of LSB galaxies, is to present the 3.6m imaging for a sample of HSB and LSB galaxies obtained during the 2009/2010 observing seasons. The data was acquired as part of a study of the baryonic Tully-Fisher relation (McGaugh & Schombert 2013) where the total luminosity of a galaxy at 3.6m provides a more accurate measure of stellar mass and an independent estimate of the color-mass to light ratio. During data reduction it was determined that the images were comparable in depth to optical imaging, and open to a full surface photometric analysis for direct comparison to optical values obtained in Paper I (Schombert, Maciel & McGaugh 2011).
2 Observations
2.1 Sample Properties
Selection criteria based on magnitudes preferentially miss LSB galaxies because much of their integrated light resides below the detection threshold of wide area surveys (McGaugh 1994). However, the low sky afforded by Spitzer observations is ideally suited to the observation of LSB galaxies and are vastly superior to ground based observations in the bands, which still lag well behind other types of data for these systems because of the obvious technical challenges. To this end, our sample was designed to explore a wide swath of under-sampled parameter space in the mid-IR, probing a large region in galaxy mass and gas fraction as well as surface brightness.
The sample presented herein are a combination of LSB galaxies, selected for Spitzer cycle 9 observing based on their central surface brightness and existing optical and H imaging, and a small subset of comparison HSB galaxies. The HSB galaxies were taken from McGaugh (2005), a selected for their large mass and observed for a baryonic Tully-Fisher cycle 5 program. All the LSB galaxies are selected from the Schombert F and D LSB catalogs (Schombert & Bothun 1988; Schombert et al. 1992; Schombert et al. 1995) with some additional, previously known, LSB UGC galaxies. All the LSB galaxies have central surface brightness mag arcsecs-2, which differs from previous Spitzer LSB programs which usually observed intermediate surface brightness galaxies ( mag arcsecs-2). The basic characteristics of the entire sample are found in Tables 1 and 2. All the photometry (found in Tables 3 and 4) presented herein were corrected for Galactic extinction using the extinction maps from Schlegel et al. (1998) and the extinction curve of Li & Draine (2001). Redshifts are determined from previous HI work (Eder & Schombert 2000; Schombert et al. 1992) and used to derive distances based on the CMB reference frame or tabulated in the Extragalactic Distance Database (Tully et al. 2009). Stellar and gas masses, plus other optical values (such as ), are taken from Paper I (Schombert, Maciel & McGaugh 2011).
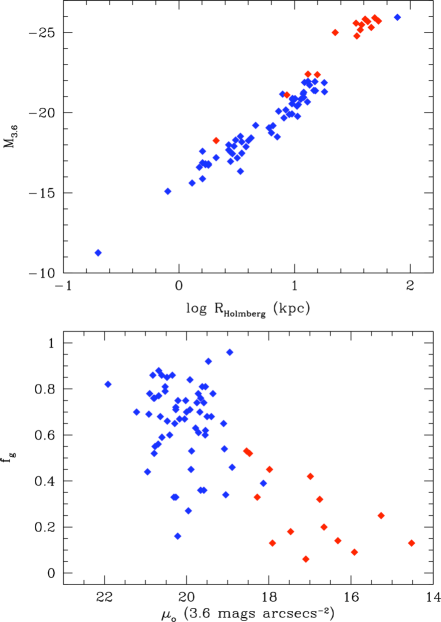
The range in absolute 3.6m magnitude and galaxy size can be found in the top panel of Figure 1. Determination of these parameters is described in §3.1, and comparison to optical values can be made with the knowledge that the mean -3.6 color is 2.3 for disk galaxies. The LSB galaxies range from 10 to 22 , whereas the HSB galaxies range from 18 to 26. As the HSB subset was selected for their high rotation values (i.e. high mass) to explore the baryonic Tully-Fisher relation, it is not surprising to find that they fill the bright end of the sequence. The brightest galaxy in our sample is F568-6, a supergiant Malin cousin (Bothun et al. 1990). Size, as given by the Holmberg radius, scales with total magnitude, such that the smallest galaxy in the sample (Cam B) has a radius of 0.2 kpc. The typical LSB galaxy ranges from 1 to 10 kpc, which encompasses dwarfs and normal sized disks. Most of the HSB galaxies are greater than 30 kpc, i.e., Milky Way sized systems, again due to their selection for high mass.
The bottom panel in Figure 1 displays one of the primary differences between LSB and HSB, the gas fraction defined as the gas mass of a galaxy (HI plus H2 and He) divided by the total mass of the galaxy in stars and gas (i.e. baryons). Figure 1 displays what is well known about LSB galaxies (McGaugh & de Blok 1997, Schombert et al. 1995) that rises with lower central surface brightness, although there is only a weak correlation between and for there exist several LSB galaxies with gas fractions similar to HSB galaxies. We define the phrase ‘gas-rich’ for those galaxies with values above 0.5 and a majority of LSB galaxies (81%) are gas-rich. Thus, while LSB galaxies are difficult to detect at wavelengths were stellar light dominates, they are often quite bright at 21-cm, i.e. neutral hydrogen (Schombert et al. 1992).
2.2 Detector Characteristics
The images used in this study were obtained with the Spitzer InfraRed Array Camera (IRAC). Briefly, IRAC is a four-channel camera that provides simultaneous 5.2 by 5.2 arcmin images at 3.6, 4.5, 5.8 and 8 m. Two adjacent fields of view are imaged in pairs (3.6 and 5.8m; 4.5 and 8.0 m) using dichroic beamsplitters. All four detector arrays in the camera are 256 by 256 pixels in size, with a pixel size of 1.2 by 1.2 arcsecs.
Our primary data was taken in the 3.6m band, whose filter centers at 3.55m and covers between 3.1 and 3.9m a nearly constant transmission. The maximum exposure time of 100 secs was used for each observation, with 24 frames taken for each galaxy for a total of 2,400 secs of integration per pixel. The frames were obtained using a 12-point Reuleaux pattern in a 1/2 subpixel dither. The resulting pixels were 0.61 arcsecs in resolution. The frames were flatfielded and calibrated using the standard Spitzer pipeline. As all our objects were small relative to the field of view, no geometric or spatial flux corrections were applied. The FWHM of the PSF was 1.7 arcsecs for 3.6 and 4.5m detectors. No corrections were made for the pixel phase effect as our galaxies are much larger in angular size than any inter-pixel effects. The diffuse light component is removed by our sky procedures.
Photometric calibration is supplied by the Spitzer processing pipeline and has an estimated zeropoint error of less than 2% (Reach et al. 2005). However, the true photometric error will be strongly dependent on the knowledge of the correct sky values for each frame, as has always been true for low surface brightness photometry (Schombert, Maciel & McGaugh 2011). The sky brightness error will have two major components, the pixel-to-pixel noise in the detector pixels and the flatness of the image on the scale of the object to be studied.
As has been successful in our past surface photometry work (Schombert 2011), we have used a sky box technique to determine the absolute sky value and its uncertainty. This technique uses visually selected regions of the galaxy image that are free of contaminating stars and background galaxies. Typically 10 to 20 boxes of 20x20 pixels are used in these calculations. For 90% of the galaxy frames in our sample, the sky brightness varied between 20 and 23 AB mags with a mean of 21.0 (where a 0 AB magnitude object has a flux of 280.9 Jys at 3.6m). The mean error on the sky was 2.2%, but 80% of the sample had a sky noise of less than 3%. This error dominates all other sources of error in our surface photometry and aperture magnitudes, and is used to assign the uncertainty in all photometric values.
The mean sky value of 21 mag arcsecs-2 at 3.6m is 2.5 mags darker than the optical night sky at our best ground observatories. Thus, where the best optical surface photometry reaches a depth of 28 to 29 mag arcsecs-2 (Schombert 1988), it is not uncommon in this sample for the mid-IR data to reach 25 mag arcsecs-2 at 3.6m with errorsbars of less than 0.5 mags (this corresponds to 0.4 pc-2). This is equivalent to optical photometry, but at least 4 mags fainter than ground-based IR surface photometry (e.g., Galaz et al. 2002).
2.3 Frame Cleaning
Perhaps the most salient difference between optical and Spitzer imaging is the sharp increase in the number of point sources, not associated with the galaxy of interest, visible in each frame. Figure 2 displays a comparison of between 150 sec image (taken with the KPNO 2.1m) and a 2400 sec Spitzer IRAC 3.6m image. The number of point sources in the 3.6m image is a factor of 10 greater than the number in the image, although this is expected from early Spitzer number counts (Fazio et al. 2004). We have matching HST WFC3 imaging of one object in our sample (F415-3), and comparison with those images reveals that 1) bright sources in common with the and Spitzer images are mostly galactic stars or unresolved nearby galaxies, and 2) faint sources found only the 3.6m images are background galaxies, either resolved in the WFC3 frames or sufficiently faint as to be below any galactic star magnitude limit.
While the percentage of the image frame contaminated by point sources is still a small fraction of the total number of pixels (typically less than 10%), there is a much higher probability that a significant portion of the galaxy image has contaminating point sources compared to images (although it begs the question that these same sources are interfering with images in a fashion that is not visible in the frames).
There are three salient issues for the larger number of contaminating point sources in the Spitzer images; 1) how the point sources interfere with isophote fitting, 2) how much of the galaxy luminosity is contaminated by stellar objects and 3) how does the observer distinguish between unresolved galaxy features (clusters, HII regions, etc.) and contaminating point sources. The first issue can be resolved by masking the more obvious stellar features, then allowing the ellipse fitting algorithms to automatically remove pixels above and below a set threshold. Even in small LSB galaxies, there are a sufficient number of remaining pixels to determine the mean isophote value.
The second issue can be mitigated by using the measured isophote values to re-fill the masked pixels with galaxy light. For small masked areas in the outer regions, this is a simple process with little increase in the uncertainties on the aperture magnitudes. Large masked areas in the core region are most problematic. Fortunately, most LSB galaxies are more symmetric in the core regions, such that filled in masked areas appear visually to be sufficient. Galaxies with large contaminating objects in their cores were simply discarded from our sample.
The third issue, discriminating foreground stars (or background galaxies) from real point-like objects in the galaxies (e.g., unresolved clusters or knots), is the most difficult to replicate in an automatic script. For this study we have followed three guidelines; 1) any feature associated with an enhanced region of surface brightness (i.e., a spiral arm or bulge) was not removed, 2) any feature visible in our deep or H frames was not removed and 3) any feature which displayed a ‘soft’ core (suggesting a non-stellar profile) was not removed. Operationally, there is no simple method to automatically apply the above criteria, so we allowed the processing pipeline remove objects beyond the 5% isophote, but used visual inspection for the inner regions.
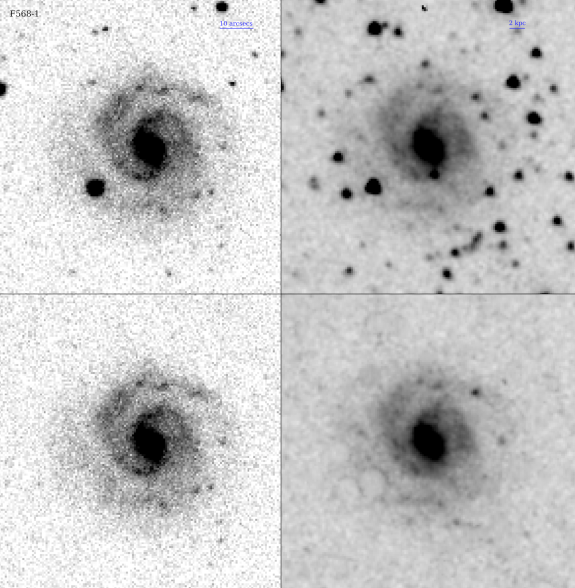
The results are fairly successful as can be seen in Figure 2. The bottom images are the cleaned and filled frames for and Spitzer 3.6m. There is very little obvious evidence of the removed areas, and there is no disjoint increase or decrease in the aperture magnitudes curve-of-growth that would signal an error in the filled regions. However, at 3.6m, these corrections involve a significant fraction of the galaxy light, up to 15%, and makes comparison with other studies difficult. This technique is much more conservative than the methods applied by Munoz-Mateos et al. (2009). For a comparison of their cleaned images (their Figure 2) indicates a number of faint point sources that remain after cleaning. As their SINGS sample studies high surface brightness spirals and irregulars, their slightly lower luminosities should not significantly contribute to their error budget, but may be critical in our LSB sample.
2.4 Isophotometry
Determining mean isophotes followed the same procedures that we have applied to optical data for LSB galaxies (Schombert, Maciel & McGaugh 2011). Frames that were manually cleaned were submitted to the ARCHANGEL pipeline (Schombert 2007) in the same manner as optical data. Sky boxes were used to determine the local sky in each frame. Ellipse fitting was performed using the standard Fourier series iterative least-squares algorithm. Given the irregular morphology of LSB galaxies, very few of the isophote contours are truly elliptical. However, to first order, a round shape with a long and short axis is the best approximation and the errors in the surface photometry are dominated by knowledge of the sky value rather than RMS around each ellipse. All the data (images, surface brightness profiles, colors and fit parameters are found at our website, http://abyss.uoregon.edu/js/spitzer).
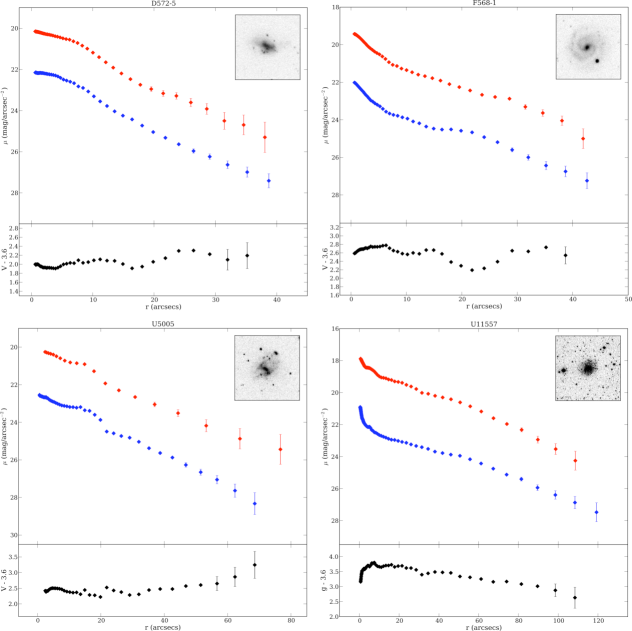
A few selected surface brightness profiles are shown in Figure 3 to display the range in the sample in terms of size and central surface brightness. The surface brightness profiles for the entire sample are available for download from our website. While some LSB galaxies have a clear bulge and disk appearance (plus a double-horned HI profile), which signals a rotational dominate oblate 3D shape, many LSB galaxies are irregular in appearance (some with single-horned HI profiles) with no indication that they are oblate, prolate or triaxial in 3D shape (Sung et al. 1998). However, historically, LSB surface brightness profiles are displayed as the major axis () versus surface brightness (, mag arcsecs-2) and fit with exponential fitting functions assuming a flattened shape. We simply follow past procedure, but make the reader aware that this does not assume a disk-like structure for all LSB galaxies (Schombert et al. 1997).
Aperture and total magnitudes are determined from the same procedures as the optical data for LSB galaxies (Schombert, McGaugh & Maciel 2013). Aperture magnitudes used the best fit ellipses for the radius in question. Luminosities were summed for all the unmasked pixels interior to the ellipse (a surveyor method was used to include the partial pixels at the ellipse edge). Masked pixels were replaced with the mean surface brightness of the fitted isophote for that radius. The amount of galaxy light derived from masked pixels varied from 2 to 15%. Total magnitudes were derived from asymptotic fits to the curve-of-growth. Beyond the 90% total luminosity radius, the apertures were replaced by the mean isophote value in order to capture the light associated with the very LSB halos.
This adjusted curve-of-growth procedure is highly successful for the LSB galaxies in the sample as all the galaxies have well-defined curves-of-growth at the faint ends that convert to a clear total magnitudes. The errors quoted in Tables 3 and 4 reflect the Poisson noise for the galaxies, error in the sky value and errors in the asymptotic fit. Of the three sources of error, Poisson noise dominates the total magnitude calculations by a factor of ten. While the errors are atypically low, comparison with other studies will reveal differences due to luminosity determination techniques rather than an external check to the luminosities. For example, comparison to SING luminosities (Munoz-Mateos et al. 2011), reveals an external scatter of 5 to 10%.
Galaxy size is determined by the isophotal Holmberg radius (Holmberg 1958; Faber & Gallagher 1979). This is the size of the major axis at the point where the surface brightness profile reaches 26.5 mag arcsecs-2. Assuming a color of 0.5 and a -3.6 color of 2.5 produces a surface brightness cutoff of 23.5 mag arcsecs-2 at 3.6m. However, using this isophote only captures 50 to 60% of an LSB galaxies light (due to color gradients). Therefore, we reduced the isophote value to 24.5, which captures typically 80% of a galaxy’s light. This isophote is used to calculate the Holmberg radii () quoted in Tables 3 and 4, the major axis of the galaxy at the 24.5 3.6m isophote. As displayed in Figure 1, the galaxy sizes in the sample range from dwarfs (1 to 2 kpcs) to large disks (10 to 20 kpcs). The Holmberg radius is strongly correlated with disk scalelength (, based on exponential fits to the profile) such that 2.5 is equivalent to a galaxy’s Holmberg radius.
Comparison to optical colors used either Johnson frames obtained from the KPNO 2.1m (Schombert, Maciel & McGaugh 2011) or from SDSS frames taken from DR7 (Abazajian et al. 2009). The SDSS values were converted to Johnson using the standard SDSS conversions (Jester et al. 2005). Colors ( - 3.6m) were calculated by three methods; 1) direct subtraction of the aperture magnitudes (integrated colors), 2) differences in the surface brightness and 3.6m profiles and 3) differential magnitudes (annular apertures). Of the three methods, the best total colors were provided by direct comparison of the asymptotic magnitudes. The best measure of spatial color was the differential surface brightness profiles, examples of which are shown in Figure 3. Color gradients were determined using interpolation of the surface brightness profiles. Again, the errors were dominated by sky value in both and 3.6m and were added in quadrature for the errors on the quoted colors.
3 Discussion
3.1 Optical to Mid-IR Surface Brightness Profiles
The most important result from our study is that the Spitzer observations reach to similar depth and radii as the deepest optical surface brightness profiles, in many cases farther than previous optical work of similar exposure times. This type of accuracy in the IR is simply not obtainable from the ground due to the high atmospheric absorption combined with a bright background. Therefore, IR space imaging has numerous advantages for studies of galaxy mass since a mid-IR luminosity minimizes the internal absorption corrections, resulting in photometric parameters that better reflect the underlying stellar population (McGaugh & Schombert 2013). In addition, the morphology and structure of a galaxy in the mid-IR will tend to follow the underlying kinematic stellar distribution, rather than being distorted by dust lanes and recent star formation.
The visual morphology of the LSB galaxies fall, primarily, into the extreme late-type classes (Sm, Im or dI). Only two of the dwarf LSB galaxies (D-class) have any symmetric shape (Sm class) and only seven of the F-class LSB galaxies have Sc or Sd morphology. The appearance of all the LSB galaxies at 3.6m is identical to their optical appearance (see Figure 2). This was not unexpected as optical color maps reveal very little absorption by dust or gas, so extinction that changes the morphology of early-type spirals from optical to IR has little effect on LSB galaxies. This also reinforces expectations that, with low star formation rates (SFR’s), LSB galaxies will vary little in stellar population age with spatial position, unlike spirals.
Surface brightness profiles are found in Figure 3, and visual inspection of the side-by-side surface brightness profiles reveals that the optical and mid-IR profiles follow the same slopes and contain the same general features (bulges, lens and disk length). The few differences in the optical and mid-IR profiles can be attributed to asymmetric features (i.e., star-forming regions, see §3.1) which can have different luminosities at the optical and IR wavelengths depending on the age of the stellar population. This result was also expected based on the behavior of multi-wavelength profiles from the SINGS project (Munoz-Mateos et al. 2009, see their Figure 6) where strong differences in profile shape were noted between the near-UV and far-IR, but with little change from optical to the mid-IR.
It is standard procedure to fit late-type galaxies to exponential profiles, for one the most distinguishing characteristics between ellipticals and spirals is a power-law versus exponential surface brightness profile (Schombert 2013). The consistency of these shapes as a function of morphology suggests that this is a property that is imposed during galaxy formation and tied to physical properties, such as total angular momentum. With respect to disk galaxies, exponential profiles in the outer regions are well defined by two parameters, central surface brightness () and scalelength (, van der Kruit 2002). Central surface brightness is only loosely correlated with global galaxies properties, such as galaxy mass. However, scalelength, which is independent of Hubble type, increases with galaxy mass (de Jong 1996; Fathi 2010).
The fitting an exponential profile to an irregular galaxy often has subtle differences compared to procedures for spirals. Very few of the LSB galaxies in our sample have a well defined bulge+disk appearance (e.g., F568-1, in Figure 2, F579-1 and UGC 11557). Of the 59 galaxies in the sample classified as LSB, only 15 have canonical bulge+disk morphology, although this is not a statement on the morphology of LSB galaxies as a type of galaxy as all the D class galaxies in our sample were selected for irregular morphology and specifically avoiding a disk-like appearance. Without a well defined bulge, the location of the isophotal center becomes an exercise of the region of highest surface brightness or the geometric mean from out isophotes.
While symmetric disk galaxies are not dominant in our sample, even an irregular LSB galaxy tends to have a brighter central region surrounded by a fainter envelope. This central region is rarely at the same center as the outer isophotes, but is typically within a half of a scalelength () of the mean isophotal center. Truly undefined objects (e.g., D500-4, F565-V2, UGC 5209) are rare, as are galaxies with nearly constant interior surface brightness than a sharp drop-off (box profile, e.g., D500-3, D572-5, ESO215-G009).
Despite their irregularities, most of the surface brightness profiles at 3.6m are adequately described by an exponential fit. We divided the sample by profile shape in three categories: 1) box-like shape (flat core region with an exponential drop-off), 2) disk (pure exponential) and 3) bulge+disk (two distinct components, the bulge need not be a r1/4 power-law shape as is common with bright spiral bulges). These classifications are listed in Tables 1 and 2. Half the LSB sample have profiles which described by a single exponential (disk-like), which due to the close correspondence to the optical profiles, matches previous results (Schombert, McGaugh & Maciel 2013). The other half of the sample was evenly divided into box-like and bulge+disk shapes. Unsurprisingly, the box-like profiles are associated with most irregular morphologies and the least elliptical isophotal shape.
We have also classified each profile according to the classification scheme proposed by Erwin et al. (2008), where a Type I profile has has no breaks from an exponential, Type II has a downward break, and Type III has an upbending break. Only nine (15%) galaxies were classed as Type II or III, which is significantly different from Herrmann, Hunter & Elmegreen (2013) who found 77% of their dwarfs to have Type II or III profiles. For our dwarf galaxies ( kpc) our Type II or III numbers increase to 30% of the sample. Part of the difference is due to stylistic differences in applying the classification scheme. For example, a box-like profile would automatically be a Type II profile, however, if the flattened profile is clearly an interior phenomenon and unrelated to the exponential fit in the halo, we called this a Type I. Part of the difference is also due to the low surface brightness nature of our sample, as the outer isophotes have less S/N than higher surface brightness systems. Larger errorbars would disguise any break.
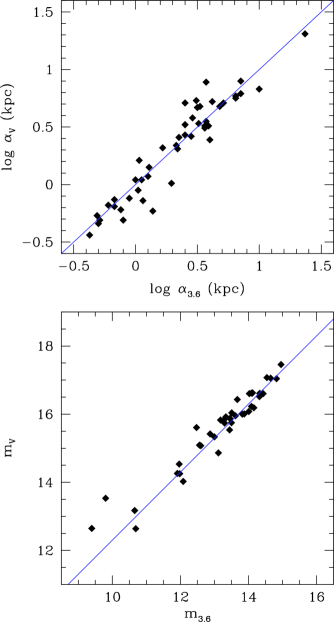
Figure 4 displays a comparison of scalelength, , obtained by exponential fits to the 48 galaxies in our sample with both optical ( or SDSS ) and mid-IR (3.6m) profiles. The correspondence is excellent considering the differences in wavelength, telescopes, detectors and sky background. The total radial extent of the stellar component of a LSB galaxy is well described either by optical or near-IR imaging. However, space mid-IR imaging displays greater S/N due to the fact that the luminosity of older stars peaks in the mid-IR and the sky is darker than the ground. There is a slight tendency for large galaxies to be under-sized at 3.6m and small galaxies to be over-sized (compared to their scalelengths), but the trend is not statistically strong.
We conclude that the exponential profile shape for LSB galaxies is universal at 3.6m, even given the problematics due to irregular isophotes. There is no compelling reason to conclude any other fitting function is a better fit, particularly considering the uniformity in profiles from optical to the mid-IR. Given the range in kinematics for the sample, from rotating disk with flat rotation curves to triaxial irregulars with solid-body motion, the mechanism determining galaxy structure must be ubiquitous. Also, given the similarity in shape between HSB and LSB galaxies, star formation must not play a dominant role (Ferguson & Clarke 2001). Simulations of gravitationally self-consistent disk collapse naturally produce exponential shapes (Mestel 1963; Dalcanton, Spergel & Summers 1997), however, the exact mechanism is unclear. Features such as bars and spiral arms serve to redistribute angular momentum (Hohl 1971) and tend to form double exponentials as seen by Herrmann, Hunter & Elmegreen (2013). But these features are rare in LSB galaxies (which may explain the lack of double exponentials in our sample).
The most likely mechanism is the one proposed by Elmegreen & Struck (2013), where stellar scattering off of baryon clumps (stars or gas) lead to the formation of exponential profiles. In their simulations, a sufficiently strong irregular morphology, which very much describes an LSB sample, drives a uniform and cold disk into an exponential shape. For objects in our sample, where most of the baryons are located in distinct regions, the timescale for an exponential formation is less than a Gyr. Their simulations also indicate that asymmetric features tend to be permanent, which explains why the internal colors in LSB galaxies are so uniform between the lower and higher surface brightness regions, indicating the stellar populations across an LSB disk have evolved in lockstep with the surface brightness of the feature (Schombert, McGaugh & Maciel 2013).
3.2 Optical to Mid-IR Luminosities/Colors
Also shown in Figure 4 is a comparison of total magnitudes in (or ) and 3.6m. Again the correspondence is excellent (a mean color of 2.3 is assumed for the unity line), and the lack of a broader scatter is a statement concerning the low range in color for late-type galaxies. LSB galaxies display better uniformity in color at 3.6m than the optical bandpasses. Converting 3.6m to stellar mass (McGaugh & Schombert 2013) gives a range of 107 to 10 for LSB galaxies with a mean of versus the HSB galaxies in the sample with a mean of . These value are consistent with optical derived masses.
Mean colors are shown in Figure 5 for both the LSB and HSB galaxies in the sample with both optical and mid-IR imaging. These are isophotal colors, rather than aperture colors, meaning they are weighted by number of pixels rather than luminosity of the pixels. This produces a total color that underweights bulge and core regions, and emphasizes the color of the LSB regions. Despite the different methods, the isophotal colors never differed from the total aperture colors by more than 0.3 mags.
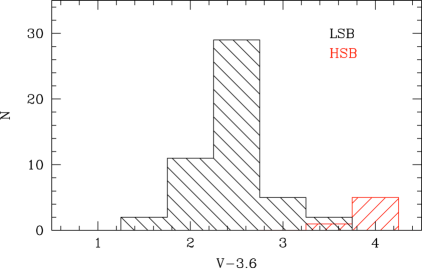
The mean color for the sample was 2.3, excluding the HSB galaxies from the average. As can be seen from Figure 5, the HSB galaxies are 1.5 mags redder than the LSB galaxies although we note that the LSB sample has a mean absolute magnitude of 19 and the HSB galaxies have a mean of 24, meaning that some of this color difference could be due to the mass-metallicity effect. However, the SFR is higher in HSB galaxies which should offset any metallicity effects.
The canonical test of the mass-metallicity effect is the color-magnitude relation (CMR, Tully et al. 1982; Peletier & de Grijs 1998). Although the CMR is clearer for early-type galaxies (whose lack of current star formation produces a relationship dominated solely by metallicity effects), the CMR for spirals and irregulars is also a useful stellar population diagnostic. For example, regardless of the dominant processes (star formation or chemical evolution), comparison of the CMR in spirals and irregulars between clusters and the fields illuminates environmental processes (Mobasher et al. 1986).
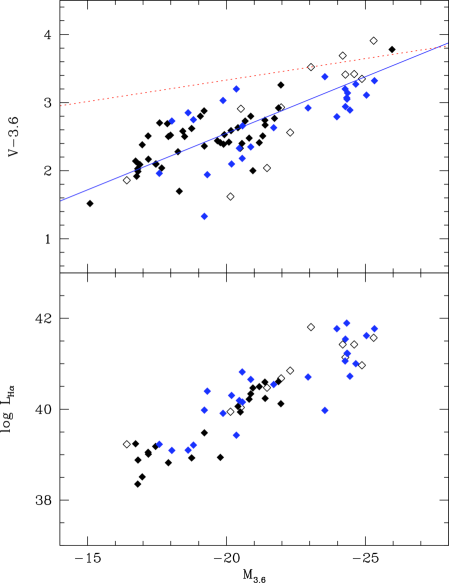
The CMR for our sample is shown in the top panel of Figure 6. The various symbols represent our sample, the THINGS data (Leroy et al. 2008) and the sample from Dale et al. (2005), all of which cover a range of luminosities and Hubble types. The red line is the CMR for ellipticals, which is pure mass-metallicity. No corrections are made for internal extinction. While dust is minimal in LSB galaxies, so of the scatter in the THINGS and Dale datasets are due to the lack of extinction corrections. Color gradients are also quite strong in spiral galaxies (see §3.3), so this effect will also contribute to the large scatter around a linear best fit.
Despite the large scatter, the correlation between color and luminosity is clear in Figure 6. Brighter galaxies tend to be earlier in Hubble type, thus, the relationship converges onto the elliptical sequence as the bulge light dominates a galaxy’s color. However, the slope is much steeper than the elliptical/S0 sequence, therefore metallicity can not be the sole component to the late-type CMR (at least, not global metallicity set by the onset of galactic winds). Stellar mass (using as a proxy) is also strongly correlated with H luminosity (a proxy for the SFR, see bottom panel of Figure 6). However, the relationship between SFR and color is inverse to the expected bluer colors with more star formation.
The solution appears to be a combination of the explanations proposed by Tully, Mould & Aaronson (1982) and Peletier & de Grijs (1998). First, the spiral CMR is due, in part, to an increase in the ratio of young to old stellar populations for later type galaxies. Evolution from a star-forming spiral to an S0 (by mass) must begin with an abrupt cessation of star formation to jump from the spiral CMR to the elliptical/S0 CMR (crossing the ‘green valley’, Strateva et al. 2001). The analysis by Peletier & de Grijs shows that decreasing mean age is insufficient to explain the spiral CMR slope, and an additional metallicity component is required. This agrees well with the studies of [OIII] lines in dwarf galaxies (Zahid et al. 2012) and large color surveys with SDSS (Tojeiro et al. 2013) where galaxies of the same morphology have their colors correlated with SFR, not mass.

Further illumination to the underlying stellar population in LSB galaxies is given by the two color versus diagram, shown in Figure 7. The red symbols are early-type galaxies from Falcon-Barroso et al. (2011), the blue symbols are the LSB galaxies from our sample. Also shown are single burst 12 and 3 Gyrs multi-metallicity models (Rakos & Schombert 2009) where the red side of the models represents [Fe/H]=+0.3 and the blue side represents [Fe/H]=0.5. A majority of ellipticals are well described by a single age of 12 Gyrs with the variation in color due to the mass-metallicity effect. S0 and Sa type galaxies have slightly younger mean ages, but none are bluer than the 3 Gyrs model.
Star-forming galaxies (late-type) display much bluer optical and mid-IR colors, and a much larger range in color. The range of color are incompatible with any single age or frosting model (where an old population contains a small fraction of young stars, Schombert & McGaugh 2013). We note that the current star formation rate of LSB galaxies, divided by their stellar mass, is near a Hubble time (Schombert, McGaugh & Maciel 2013). This implies that the mean star formation rate in LSB galaxies has been nearly constant for their lifetimes. While this rate may vary wildly at any particular epoch, a first order stellar population model is one which assumes a constant star formation rate then sums the luminosities over all the generations to form a final color. It is this type of model that is shown in Figure 7.
The constant star formation model shown in Figure 7 is based on modified Bruzual & Charlot SSP’s (single stellar populations, single age and metallicity isochrones). The BC03 models were successfully modified to reproduce the CMR for ellipticals using a multi-metallicity technique (Odell, Schombert & Rakos 2002). Multi-metallicity populations are generated by selecting BC03 models of a single age and summing various metallicities using the shape of the metallicity distribution in our Galaxy, and allowing the peak to vary to represent a changing mean [Fe/H]. To model a constant star formation population, the total population is divided into a number of bins from 12 Gyrs to the present. Each age is assigned a mean [Fe/H] starting at [Fe/H]= at 12 Gyrs and advanced to a final value that varied from 1.5 to +0.3 following a chemical evolution prescription (Prantzos 2009) and following the CMR with redshift (Zahid et al. 2013). Each bin is summed to and weighted by the mean luminosity compared to the 12 Gyr bin (i.e., older, more metal-poor stars tend to be brighter than their younger, metal-rich counterparts).
In addition, as our data covers the mid-IR portion, we extended the BC03 models to cover TP-AGB evolutionary tracks (Marigo et al. 2007). This correction begins for populations older than 40 Myrs with a =0.5, dropping to 0.2 by 500 Myrs and less than 0.05 for greater than 2 Gyrs. While this correction is applied to each age bin, the total effect is =0.25 with respect to models without the AGB correction. This is a significant difference in Figure 7 resulting in primarily overestimating an LSB galaxy’s metallicity. We have ignored extinction effects due to the low dust content in LSB galaxies (these models are described in greater detail in Schombert & McGaugh 2013).
The mid line in Figure 7 presents the final model with a run of mean galaxy metallicity from to solar. Due to the stochastic nature of star formation, we also considered two other models where the star formation was suppressed by a factor of four for the last 0.5 Gyrs and where the star formation was enhanced by a factor of four for the last 0.5 Gyrs (4x and 1/4x). The resulting model tracks are shown in Figure 7 where changing the recent star formation has the largest effect in color as expected.
A majority of the LSB colors fall within the range of models described above. The mean color for the sample falls exactly on the midline model, although the color errors prevent any exact mapping of star formation history to a particular galaxy. We can rule out a majority of the stars in LSB galaxies being formed in the last few Gyrs, or their colors would be much redder to due a strong TP-AGB component. The spread in colors are well matched by the models with enhanced/suppressed SFR by factors of four, which is consistent with the spread in H emission as a function of stellar mass for LSB galaxies (Schombert, McGaugh & Maciel 2013).
3.3 Color Gradients
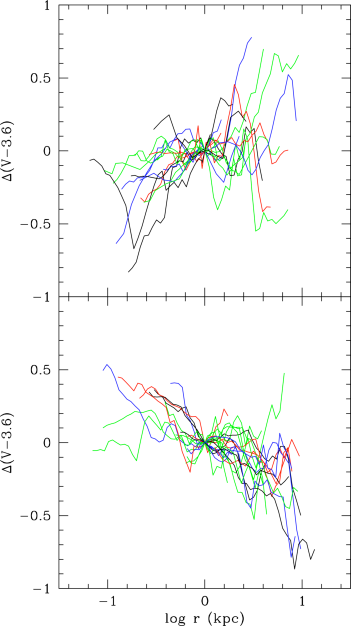
Color gradients between (or ) and 3.6m are found at the bottom of each surface brightness plot. These are calculated by interpolating the 3.6m surface brightness value at each surface brightness point. The resulting color gradients are shown in Figure 8 where the color profiles have be normalized to kpc and divided into two groups, 1) those with flat or slightly rising profiles and 2) those with decreasing colors with radius. The sample divides evenly into those galaxies with flat versus decreasing color gradients. The mean down gradient is /log 0.4, the mean up gradient is /log 0.3.
Galaxies with decreasing gradients are predominately disk-like in morphology. Those galaxies with flat gradients are irregular in morphology or dwarf-like. Galaxies with decreasing gradients are brighter, on average, than flat or increasing gradient galaxies, but both types are found at all masses. There is a sharp transition with respect to baryon mass. A majority of the galaxies with baryon masses less than have flat or upward color gradients, those galaxies with masses greater than have downward gradients. This is similar to the result found by Tortora et al. (2010) for 50,000 SDSS galaxies.
While color gradients in early-type galaxies are primary due to metallicity effects, disk and late-type galaxies have significant star formation with could produce a color gradient based on mean local stellar age. Since the CMR for our our sample is significantly steeper than the slope of the CMR for ellipticals, star formation must play a strong role in the observed color gradients herein. In addition, those galaxies with downward gradients have, on average, 100 times more H emission than flat gradient galaxies in our sample. Flat gradients for low mass LSB galaxies probably reflects their already low mean metallicities, due to a suppressed past SFR, such that there is very little dynamic range in [Fe/H] within the entire galaxy.
All the galaxies with up or flat gradients have no gradients in . And a majority of the galaxies with downward gradients also have no or very modest gradients. The lack of optical gradients is a known property of LSB galaxies (Schombert, McGaugh & Maciel 2013), mostly due to the fact that star formation is more dispersed in LSB galaxies compared to their HSB cousins. This implies that the LSB gradients are dominated by metallicity effects, rather than age (recent SF, see Figure 7) and the low SFR in LSB galaxies may allow a sharper analysis of metallicity gradients (i.e., spatial chemical evolution) due to a decoupling of SF effects.
4 Summary
Deep Spitzer surface photometry is presented for 61 LSB galaxies (45 with matching optical imaging) and an additional 14 HSB galaxies. Spitzer imaging has several unique data reduction challenges, such as a sharp increase in the number of background point sources, all of which can be resolved with well designed software routines. The data presented herein have comparable depth to sky-limited optical imaging, but at wavelengths that are impossible to achieve from the ground and measure the portion of a galaxy’s SED critical to estimates of galaxy stellar mass and star formation history. Our results are summarized as the following:
-
(1) Our sample, selected for low central surface brightness ( mag arcsecs-2 at 3.6m), covers a luminosity range of 11 to 22 in , a size range of 1 to 25 kpc and gas mass fraction of 30 to 95%. While a majority of the sample is gas-rich (), the only defining characteristic to the sample is central surface brightness, not mass or size.
-
(2) Surface brightness profiles at 3.6m have identical features to profiles at , regardless of galaxy morphology. Contrary to studies of HSB dwarfs (Herrmann, Hunter & Elmegreen 2013), we find a majority of LSB galaxies have single exponential profiles with only 15% displaying upward or downward breaks from a single exponential. Part of this difference may be due to the lower S/N in LSB envelopes which disguises outer changes in the profile shape.
-
(3) colors of LSB galaxies are bluer than their HSB counterparts with a mean color of 2.3 and a standard deviation of 0.5. The color-magnitude relation (CMR) is evident for LSB galaxies, with a similar slope to that found for normal spirals, indicating that star formation (age) dominates over metallicity effects.
-
(4) The timescale for total star formation in LSB galaxies (/SFR, the ratio of the total stellar mass to the current SFR) are near a Hubble time implying a history of constant, albeit extremely low, star formation. This is consistent with the fact that single age stellar population models (where all the stars are of a single age, but varying metallicities) fail to reproduce the blue optical colors compared with red near-IR colors (a signature of a mixed age stellar population). However, the mean LSB optical to mid-IR colors do compare well with models of constant star formation, as can be seen in Figure 7.
-
(5) The spread in color for LSB galaxies can be modeled by assuming a fourfold decrease/increase in star formation over the last 0.5 Gyrs. These quasi-stochastic bursts of star formation would explain the weak correlation between SFR and surface brightness (Paper I, where low SFR is associated with low stellar density galaxies) such that the wide variation in SFR versus surface brightness is due to the present SFR being a snapshot of the current epoch and the mean surface brightness represents the integrated effect of star formation over the age of the galaxy.
-
(6) Downward color gradients exist for 1/2 the sample, but low mass and late-type morphology LSB galaxies display no gradients. Gradients appear to be driven more by metallicity effects as irregular LSB galaxies have very low SFR’s and are relatively uniform in disk color.
Our sample emphasizes the promise that mid-IR imaging has for studies attempting to measure the total luminosity and size of a galaxy population, particularly with respect to formation correlations such as the Tully-Fisher relation and the Fundamental Plane. More surprising is the information provided by optical to mid-IR colors with respect to the underlying stellar population. The combination of near-IR colors with current SFRs from H imaging yields a clearer picture of star formation in LSB galaxies than afforded by optical colors alone. The model of roughly constant mean star formation rate punctuated by stochastic variations in current SFR agrees well with constraints from kinematic studies, providing a natural explanation for the observed range of stellar mass-to-light ratios. We will use these as inputs towards a coherent history of the evolution of LSB galaxies in the next paper of our series.
References
- Abazajian et al. (2009) Abazajian, K. N., Adelman-McCarthy, J. K., Agüeros, M. A., et al. 2009, ApJS, 182, 543
- Bothun et al. (1990) Bothun, G. D., Schombert, J. M., Impey, C. D., & Schneider, S. E. 1990, ApJ, 360, 427
- Bruzual & Charlot (2003) Bruzual, G., & Charlot, S. 2003, MNRAS, 344, 1000
- Courteau & Rix (1999) Courteau, S., & Rix, H.-W. 1999, ApJ, 513, 561
- Dalcanton et al. (1997) Dalcanton, J. J., Spergel, D. N., & Summers, F. J. 1997, ApJ, 482, 659
- Dale et al. (2005) Dale, D. A., Bendo, G. J., Engelbracht, C. W., et al. 2005, ApJ, 633, 857
- Eder & Schombert (2000) Eder, J. A., & Schombert, J. M. 2000, ApJS, 131, 47
- Eisenstein & Loeb (1996) Eisenstein, D. J., & Loeb, A. 1996, ApJ, 459, 432
- Elmegreen & Struck (2013) Elmegreen, B. G., & Struck, C. 2013, ApJ, 775, L35
- Erwin et al. (2008) Erwin, P., Pohlen, M., Gutiérrez, L., & Beckman, J. E. 2008, Formation and Evolution of Galaxy Disks, 396, 207
- Faber & Gallagher (1979) Faber, S. M., & Gallagher, J. S. 1979, ARA&A, 17, 135
- Falcón-Barroso et al. (2011) Falcón-Barroso, J., van de Ven, G., Peletier, R. F., et al. 2011, MNRAS, 417, 1787
- Fathi (2010) Fathi, K. 2010, ApJ, 722, L120
- Fazio et al. (2004) Fazio, G. G., Ashby, M. L. N., Barmby, P., et al. 2004, ApJS, 154, 39
- Ferguson & Clarke (2001) Ferguson, A. M. N., & Clarke, C. J. 2001, MNRAS, 325, 781
- Galaz et al. (2002) Galaz, G., Dalcanton, J. J., Infante, L., & Treister, E. 2002, AJ, 124, 1360
- Herrmann et al. (2013) Herrmann, K. A., Hunter, D. A., & Elmegreen, B. G. 2013, AJ, 146, 104
- Hohl (1971) Hohl, F. 1971, ApJ, 168, 343
- Holmberg (1958) Holmberg, E. 1958, Meddelanden fran Lunds Astronomiska Observatorium Serie II, 136, 1
- Jester et al. (2005) Jester, S., Schneider, D. P., Richards, G. T., et al. 2005, AJ, 130, 873
- de Jong (1996) de Jong, R. S. 1996, A&AS, 118, 557
- van der Kruit (2002) van der Kruit, P. C. 2002, The Dynamics, Structure History of Galaxies: A Workshop in Honour of Professor Ken Freeman, 273, 7
- Leroy et al. (2008) Leroy, A. K., Walter, F., Brinks, E., et al. 2008, AJ, 136, 2782
- Li & Draine (2001) Li, A., & Draine, B. T. 2001, ApJ, 554, 778
- Marigo & Girardi (2007) Marigo, P., & Girardi, L. 2007, From Stars to Galaxies: Building the Pieces to Build Up the Universe, 374, 33
- McGaugh (1994) McGaugh, S. S. 1994, ApJ, 426, 135
- McGaugh (2005) McGaugh, S. S. 2005, ApJ, 632, 859
- McGaugh & de Blok (1997) McGaugh, S. S., & de Blok, W. J. G. 1997, ApJ, 481, 689
- McGaugh & de Blok (1998) McGaugh, S., & de Blok, E. 1998, Galactic Halos, 136, 210
- McGaugh et al. (2010) McGaugh, S. S., Schombert, J. M., de Blok, W. J. G., & Zagursky, M. J. 2010, ApJ, 708, L14
- Mestel (1963) Mestel, L. 1963, MNRAS, 126, 553
- Mo & Mao (2000) Mo, H. J., & Mao, S. 2000, MNRAS, 318, 163
- Mo & Mao (2004) Mo, H. J., & Mao, S. 2004, MNRAS, 353, 829
- Mobasher et al. (1986) Mobasher, B., Ellis, R. S., & Sharples, R. M. 1986, MNRAS, 223, 11
- Muñoz-Mateos et al. (2009) Muñoz-Mateos, J. C., Gil de Paz, A., Zamorano, J., et al. 2009, ApJ, 703, 1569
- Muñoz-Mateos et al. (2011) Muñoz-Mateos, J. C., Boissier, S., Gil de Paz, A., et al. 2011, ApJ, 731, 10
- Navarro & Steinmetz (2000) Navarro, J. F., & Steinmetz, M. 2000, ApJ, 538, 477
- Odell et al. (2002) Odell, A. P., Schombert, J., & Rakos, K. 2002, AJ, 124, 3061
- Peletier & de Grijs (1998) Peletier, R. F., & de Grijs, R. 1998, MNRAS, 300, L3
- Prantzos (2009) Prantzos, N. 2009, IAU Symposium, 254, 381
- Reach et al. (2005) Reach, W. T., Megeath, S. T., Cohen, M., et al. 2005, PASP, 117, 978
- Schlegel et al. (1998) Schlegel, D. J., Finkbeiner, D. P., & Davis, M. 1998, ApJ, 500, 525
- Schombert et al. (2013) Schombert, J., McGaugh, S., & Maciel, T. 2013, AJ, 146, 41
- Schombert et al. (2011) Schombert, J., Maciel, T., & McGaugh, S. 2011, Advances in Astronomy, 2011,
- Schombert & Rakos (2009) Schombert, J., & Rakos, K. 2009, ApJ, 699, 1530
- Schombert (2007) Schombert, J. 2007, arXiv:astro-ph/0703646
- Schombert et al. (1997) Schombert, J. M., Pildis, R. A., & Eder, J. A. 1997, ApJS, 111, 233
- Schombert et al. (1995) Schombert, J. M., Pildis, R. A., Eder, J. A., & Oemler, A., Jr. 1995, AJ, 110, 2067
- Schombert et al. (1992) Schombert, J. M., Bothun, G. D., Schneider, S. E., & McGaugh, S. S. 1992, AJ, 103, 1107
- Schombert & Bothun (1988) Schombert, J. M., & Bothun, G. D. 1988, AJ, 95, 1389
- Sung et al. (1998) Sung, E.-C., Han, C., Ryden, B. S., et al. 1998, ApJ, 505, 199
- Tojeiro et al. (2013) Tojeiro, R., Masters, K. L., Richards, J., et al. 2013, MNRAS, 432, 359
- Tortora et al. (2010) Tortora, C., Napolitano, N. R., Cardone, V. F., et al. 2010, MNRAS, 407, 144
- Tully & Fisher (1977) Tully, R. B., & Fisher, J. R. 1977, A&A, 54, 661
- Tully et al. (1982) Tully, R. B., Mould, J. R., & Aaronson, M. 1982, ApJ, 257, 527
- Tully et al. (2009) Tully, R. B., Rizzi, L., Shaya, E. J., et al. 2009, AJ, 138, 323
- Tully et al. (1982) Tully, R. B., Mould, J. R., & Aaronson, M. 1982, ApJ, 257, 527
- Verheijen (2001) Verheijen, M. A. W. 2001, ApJ, 563, 694
- Zahid et al. (2012) Zahid, H. J., Bresolin, F., Kewley, L. J., Coil, A. L., & Davé, R. 2012, ApJ, 750, 120
- Zahid et al. (2013) Zahid, H. J., Yates, R. M., Kewley, L. J., & Kudritzki, R. P. 2013, ApJ, 763, 92
- van den Bosch (2000) van den Bosch, F. C. 2000, Dynamics of Galaxies: from the Early Universe to the Present, 197, 179
| Object | profile | Hubble | disk | optical | H | D |
|---|---|---|---|---|---|---|
| type | type | type | source | (Mpc) | ||
| (1) | (2) | (3) | (4) | (5) | (6) | (7) |
| CamB | I | Irr | X | 0.3 | ||
| D500-2 | I | Sm | D | MDM | 21.9 | |
| D500-3 | I | dI | X | KPNO | ✓ | 22.7 |
| D500-4 | I | dI | X | SDSS | 26.0 | |
| D512-2 | I | dI | X | SDSS | 14.1 | |
| D564-8 | I | dI | D | MDM | 10.4 | |
| D568-2 | II | Im | D | KPNO | ✓ | 21.2 |
| D570-4 | III: | Im | D | MDM | 19.1 | |
| D572-5 | III | Irr | X | KPNO | ✓ | 18.0 |
| D575-1 | III | Im | D | SDSS | 12.0 | |
| D575-7 | II | Im | X | KPNO | ✓ | 18.0 |
| D584-2 | I | Im | B+D | SDSS | 37.5 | |
| D631-7 | II | dI | X | KPNO | ✓ | 7.8 |
| D640-13 | I | dI: | D | SDSS | 19.0 | |
| D723-5 | I | Sd | D | KPNO | ✓ | 27.7 |
| DDO064 | I | Im | X | SDSS | 10.8 | |
| DDO168 | I | Im | D | KPNO | ✓ | 5.2 |
| DDO170 | I | Im | X | SDSS | 16.5 | |
| ESO215-G009 | II | SAB(s)m: | X | 12.0 | ||
| F415-3 | I | Sm | D | KPNO | ✓ | 10.4 |
| F530-3 | I | Sc | B+D | 61.7 | ||
| F561-1 | I: | Sm | D | KPNO | ✓ | 69.8 |
| F563-1 | I | Sm/Im | B+D | KPNO | ✓ | 52.2 |
| F563-V1 | I | dI | D | KPNO | ✓ | 57.6 |
| F563-V2 | I | Irr | D | SDSS | 63.5 | |
| F565-V2 | I | Im | D | KPNO | ✓ | 55.1 |
| F567-2 | I | Sm | D | SDSS | 83.4 | |
| F568-1 | I | Sc | B+D | KPNO | ✓ | 95.4 |
| F568-3 | I | Sd | D | KPNO | ✓ | 86.7 |
| F568-6 | I | S/Malin-like | B+D | SDSS | 201.0 | |
| F568-V1 | I | S/Malin-like | B+D | KPNO | ✓ | 84.8 |
| F571-5 | I | Sm | D | SDSS | 63.5 | |
| F571-8 | I | Sb | B+D | SDSS | 56.2 | |
| F571-V1 | I | Sd/Sm | D | SDSS | 84.3 | |
| F574-1 | I | Sd | B+D | KPNO | ✓ | 100.0 |
| F574-2 | I | Sm: | D | KPNO | ✓ | 92.2 |
| F577-V1 | I | Sd: | D | KPNO | ✓ | 113.0 |
| F579-1 | I | Sb | B+D | SDSS | 90.5 | |
| F583-1 | I | Sm/Irr | D | SDSS | 32.5 | |
| F583-5 | I | Sb | B+D | SDSS | 46.7 | |
| F585-3 | I | Sm | B+D: | SDSS | 43.7 | |
| F585-V1 | I | dI | D | SDSS | 28.1 | |
| F611-1 | I | dI/Im | D | KPNO | ✓ | 25.5 |
| F746-1 | I | Irr | D | KPNO | ✓ | 105.0 |
| GR8 | II | ImV | X | 7.2 | ||
| KK98-251 | I | Irr? | D | 5.5 | ||
| N3741 | I | ImIII/BCD | B+D | SDSS | 6.2 | |
| U128 | I | Sdm | B+D | KPNO | ✓ | 58.4 |
| U628 | I | Sm: | D | 71.1 | ||
| U1195 | I | Sc(f) | B+D | SDSS | 6.6 | |
| U1230 | I | Sm: | B+D | 49.2 | ||
| U2014 | II | Im: | X | 4.8 | ||
| U5005 | I | Im | D | KPNO | ✓ | 57.0 |
| U5209 | I | Im | D | SDSS | 11.0 | |
| U5750 | I: | SBdm: | D | SDSS | 62.2 | |
| U5999 | I | Im | D | 51.9 | ||
| U11557 | I | SAB(s)dm | B+D | SDSS | 16.7 | |
| U12082 | I | Sm | B+D | 6.5 | ||
| U12212 | I | Sm: | D | 7.5 | ||
| U12632 | I | Sm: | B+D | 1.6 | ||
| U12695 | I | Sm: | D | 80.9 |
Note. — (1) Galaxy name. (2) surface brightness profile type, Erwin et al. (2008). (3) Hubble type from Schombert et al. (1992,1997). (4) surface brightness profile structure, D = disk, B+D = bulge+disk, X = unknown. (5) source of optical data. (6) H images available. (7) distance in Mpc from Tully et al. (2009).
| Object | profile | Hubble | disk | optical | H | D |
|---|---|---|---|---|---|---|
| type | type | type | source | (Mpc) | ||
| (1) | (2) | (3) | (4) | (5) | (6) | (7) |
| ESO563-G021 | II | SAbc: | B+D | 67.6 | ||
| N801 | I | Sc | B+D | 75.3 | ||
| N1003 | I | SA(s)cd | B+D | 10.2 | ||
| N1167 | I | SA0-;LINER | B+D | 66.0 | ||
| N2998 | I | SAB(rs)c | B+D | SDSS | 68.3 | |
| N5533 | I | SA(rs)ab | B+D | SDSS | 59.4 | |
| N6195 | I | Sb | B+D | SDSS | 127.0 | |
| N6674 | I | SB(r)b | B+D | 51.9 | ||
| U1551 | I | Sdm | B+D | 33.2 | ||
| U2259 | II | SB(s)dm | B+D | 5.3 | ||
| U2885 | I | SA(rs)c | B+D | 78.9 | ||
| U2953 | I | SA(s)ab | B+D | 11.2 | ||
| U5709 | I | Sd: | B+D | SDSS | 91.0 | |
| U11455 | I | Sc | B+D | 73.5 |
| Object | log | log | log | |||||
|---|---|---|---|---|---|---|---|---|
| (kpc) | (kpc) | () | () | () | ||||
| (1) | (2) | (3) | (4) | (5) | (6) | (7) | (8) | |
| CamB | 11.13 0.03 | 0.2 | 20.26 | 5.50 | 5.19 | 5.67 | 0.33 | |
| D500-2 | 12.96 0.07 | 1.700.19 | 3.8 | 19.92 | 8.49 | 9.20 | 9.28 | 0.84 |
| D500-3 | 14.16 0.12 | 2.510.01 | 3.9 | 19.54 | 8.04 | 8.25 | 8.46 | 0.62 |
| D500-4 | 14.08 0.12 | 2.520.23 | 2.7 | 19.58 | 8.19 | 7.94 | 8.38 | 0.36 |
| D512-2 | 12.88 0.07 | 2.690.28 | 3.8 | 19.88 | 8.14 | 8.20 | 8.47 | 0.53 |
| D564-8 | 13.98 0.11 | 1.520.11 | 1.3 | 21.22 | 7.44 | 7.81 | 7.97 | 0.70 |
| D568-2 | 14.82 0.16 | 2.030.18 | 1.7 | 19.78 | 7.72 | 7.94 | 8.15 | 0.63 |
| D570-4 | 13.74 0.10 | 2.040.11 | 2.7 | 20.47 | 8.06 | 8.35 | 8.53 | 0.66 |
| D572-5 | 14.01 0.11 | 1.990.07 | 2.2 | 19.75 | 7.90 | 8.37 | 8.50 | 0.75 |
| D575-1 | 12.48 0.06 | 2.100.16 | 4.3 | 20.95 | 8.16 | 8.06 | 8.41 | 0.44 |
| D575-7 | 14.09 0.12 | 2.170.11 | 2.1 | 19.72 | 7.87 | 8.42 | 8.53 | 0.78 |
| D584-2 | 13.67 0.10 | 2.880.10 | 6.5 | 20.17 | 8.67 | 8.98 | 9.15 | 0.67 |
| D631-7 | 11.98 0.05 | 2.140.09 | 2.4 | 19.66 | 7.99 | 8.48 | 8.61 | 0.76 |
| D640-13 | 13.87 0.11 | 1.920.15 | 2.4 | 20.60 | 8.00 | 8.16 | 8.39 | 0.59 |
| D723-5 | 13.00 0.07 | 2.360.20 | 4.6 | 19.66 | 8.68 | 8.43 | 8.87 | 0.36 |
| DDO064 | 11.91 0.04 | 2.280.09 | 4.0 | 19.36 | 8.30 | 8.85 | 8.96 | 0.78 |
| DDO168 | 10.69 0.03 | 2.100.06 | 3.3 | 19.62 | 8.15 | 8.78 | 8.87 | 0.81 |
| DDO170 | 12.56 0.06 | 2.500.05 | 7.2 | 19.54 | 8.41 | 9.03 | 9.12 | 0.81 |
| ESO215-G009 | 11.87 0.04 | 3.4 | 18.95 | 8.41 | 9.76 | 9.78 | 0.96 | |
| F415-3 | 13.12 0.08 | 2.380.22 | 2.8 | 20.68 | 7.78 | 8.65 | 8.71 | 0.88 |
| F530-3 | 13.06 0.07 | 9.6 | 19.71 | 9.35 | 9.55 | 9.76 | 0.61 | |
| F561-1 | 13.34 0.08 | 2.800.04 | 10.1 | 19.89 | 9.35 | 9.26 | 9.61 | 0.45 |
| F563-1 | 13.18 0.08 | 2.630.11 | 10.5 | 20.78 | 9.16 | 9.66 | 9.78 | 0.76 |
| F563-V1 | 14.02 0.11 | 2.410.10 | 10.6 | 20.79 | 8.91 | 8.94 | 9.23 | 0.52 |
| F563-V2 | 13.45 0.09 | 2.400.15 | 9.5 | 19.40 | 9.22 | 9.54 | 9.71 | 0.68 |
| F565-V2 | 14.96 0.17 | 2.620.18 | 6.3 | 20.80 | 8.50 | 8.99 | 9.11 | 0.76 |
| F567-2 | 14.44 0.14 | 2.590.15 | 8.4 | 20.64 | 9.06 | 9.39 | 9.56 | 0.68 |
| F568-1 | 13.51 0.09 | 2.670.06 | 14.7 | 20.41 | 9.55 | 9.72 | 9.94 | 0.60 |
| F568-3 | 12.96 0.07 | 2.770.06 | 13.5 | 18.89 | 9.69 | 9.62 | 9.96 | 0.46 |
| F568-6 | 10.56 0.02 | 3.780.19 | 77.5 | 20.22 | 11.38 | 10.67 | 11.46 | 0.16 |
| F568-V1 | 13.82 0.10 | 2.480.03 | 9.6 | 19.92 | 9.32 | 9.70 | 9.86 | 0.71 |
| F571-5 | 14.33 0.13 | 2.440.11 | 8.1 | 20.52 | 8.87 | 9.49 | 9.58 | 0.81 |
| F571-8 | 11.86 0.04 | 4.090.30 | 12.2 | 19.96 | 9.75 | 9.33 | 9.89 | 0.27 |
| F571-V1 | 14.54 0.14 | 2.420.12 | 7.3 | 20.29 | 9.03 | 9.30 | 9.49 | 0.65 |
| F574-1 | 13.62 0.10 | 2.740.20 | 15.2 | 19.55 | 9.55 | 9.73 | 9.95 | 0.60 |
| F574-2 | 14.32 0.13 | 2.330.13 | 10.8 | 20.77 | 9.19 | 9.29 | 9.54 | 0.55 |
| F577-V1 | 14.32 0.13 | 2.000.09 | 12.0 | 20.26 | 9.37 | 9.78 | 9.92 | 0.72 |
| F579-1 | 12.82 0.07 | 13.1 | 19.05 | 9.78 | 9.49 | 9.96 | 0.34 | |
| F583-1 | 13.50 0.09 | 2.800.27 | 6.0 | 20.35 | 8.62 | 9.39 | 9.46 | 0.86 |
| F583-5 | 13.42 0.09 | 2.530.27 | 9.5 | 21.91 | 8.97 | 9.62 | 9.71 | 0.82 |
| F585-3 | 13.30 0.08 | 2.390.22 | 9.0 | 20.48 | 8.95 | 9.70 | 9.77 | 0.85 |
| F585-V1 | 14.65 0.15 | 2.700.06 | 1.6 | 20.61 | 8.03 | 8.83 | 8.90 | 0.86 |
| F611-1 | 14.12 0.12 | 2.500.12 | 3.0 | 20.92 | 8.16 | 8.51 | 8.67 | 0.69 |
| F746-1 | 13.80 0.10 | 2.510.19 | 18.2 | 19.58 | 9.52 | 9.97 | 10.11 | 0.74 |
| GR8 | 12.70 0.06 | 1.5 | 20.90 | 7.63 | 8.17 | 8.28 | 0.78 | |
| KK98-251 | 12.53 0.06 | 2.9 | 20.52 | 7.46 | 8.03 | 8.13 | 0.78 | |
| N3741 | 12.08 0.01 | 2.090.07 | 1.6 | 19.47 | 7.75 | 8.78 | 8.82 | 0.92 |
| U128 | 11.96 0.05 | 2.920.10 | 18.1 | 20.26 | 9.51 | 9.98 | 10.10 | 0.75 |
| U628 | 12.32 0.01 | 15.0 | 19.08 | 9.77 | 9.85 | 10.11 | 0.54 | |
| U1195 | 10.66 0.01 | 2.580.11 | 4.2 | 19.09 | 8.37 | 8.63 | 8.82 | 0.65 |
| U1230 | 12.18 0.05 | 12.0 | 20.21 | 7.70 | 7.81 | 8.06 | 0.56 | |
| U2014 | 12.53 0.06 | 1.6 | 19.68 | 9.26 | 9.58 | 9.75 | 0.68 | |
| U5005 | 12.60 0.06 | 2.410.08 | 11.9 | 20.00 | 9.33 | 9.03 | 9.51 | 0.33 |
| U5209 | 13.45 0.09 | 2.130.21 | 1.8 | 20.69 | 9.46 | 9.26 | 9.67 | 0.39 |
| U5750 | 13.30 0.08 | 2.730.27 | 12.9 | 19.50 | 8.26 | 8.58 | 8.75 | 0.67 |
| U5999 | 12.74 0.06 | 11.3 | 20.31 | 8.01 | 8.49 | 8.61 | 0.75 | |
| U11557 | 9.96 0.02 | 3.600.16 | 7.9 | 18.13 | 7.24 | 7.76 | 7.88 | 0.77 |
| U12082 | 10.89 0.03 | 3.5 | 20.05 | 9.33 | 10.12 | 10.19 | 0.86 | |
| U12212 | 11.83 0.04 | 2.8 | 20.02 | 11.27 | 10.78 | 11.39 | 0.25 | |
| U12632 | 10.41 0.02 | 1.3 | 20.68 | 11.14 | 10.54 | 11.24 | 0.20 | |
| U12695 | 13.69 0.10 | 10.0 | 20.82 | 8.95 | 9.36 | 9.50 | 0.72 |
Note. — (1) Galaxy name. (2) apparent magnitude at 3.6m. (3) color, corrected from for SDSS data (4) Holmberg radius in kpc. (5) central 3.6m surface brightness (mag arcsecs-2). (6) stellar mass. (7) gas mass. (8) baryon mass (stars+gas). (9) gas fraction.
| Object | log | log | log | |||||
|---|---|---|---|---|---|---|---|---|
| (kpc) | (kpc) | () | () | () | ||||
| (1) | (2) | (3) | (4) | (5) | (6) | (7) | (8) | |
| ESO563-G021 | 8.43 0.01 | 43.1 | 15.24 | 11.27 | 10.78 | 11.39 | 0.25 | |
| N801 | 9.05 0.01 | 46.2 | 16.65 | 11.13 | 10.52 | 11.22 | 0.20 | |
| N1003 | 8.92 0.01 | 8.6 | 16.98 | 9.44 | 9.85 | 9.99 | 0.72 | |
| N1167 | 8.23 0.01 | 40.7 | 17.07 | 11.33 | 10.13 | 11.36 | 0.06 | |
| N2998 | 9.39 0.01 | 3.770.18 | 34.5 | 18.28 | 10.91 | 10.59 | 11.08 | 0.33 |
| N5533 | 8.39 0.01 | 3.980.13 | 38.1 | 17.46 | 11.19 | 10.52 | 11.27 | 0.18 |
| N6195 | 9.80 0.01 | 4.070.03 | 53.3 | 17.90 | 11.28 | 10.47 | 11.35 | 0.13 |
| N6674 | 8.40 0.01 | 12.0 | 16.75 | 11.06 | 10.73 | 11.23 | 0.32 | |
| U1551 | 10.21 0.01 | 13.1 | 17.98 | 9.95 | 9.87 | 10.21 | 0.45 | |
| U2259 | 10.36 0.02 | 2.1 | 18.47 | 8.30 | 8.33 | 8.62 | 0.52 | |
| U2885 | 8.48 0.01 | 51.0 | 16.32 | 11.40 | 10.59 | 11.46 | 0.14 | |
| U2953 | 5.93 0.01 | 16.5 | 15.92 | 10.72 | 9.71 | 10.76 | 0.09 | |
| U5709 | 12.42 0.01 | 15.7 | 18.54 | 9.95 | 10.01 | 10.28 | 0.53 | |
| U11455 | 8.81 0.01 | 33.1 | 14.53 | 11.20 | 10.39 | 11.27 | 0.13 |
Note. — (1) Galaxy name. (2) apparent magnitude at 3.6m. (3) color, corrected from for SDSS data (4) Holmberg radius in kpc. (5) central 3.6m surface brightness (mag arcsecs-2). (6) stellar mass. (7) gas mass. (8) baryon mass (stars+gas). (9) gas fraction.