Fermi-LAT Detection of Gravitational Lens Delayed Gamma-ray Flares from Blazar B0218+357
Abstract
Using data from the Fermi Large Area Telescope (LAT), we report the first clear -ray measurement of a delay between flares from the gravitationally lensed images of a blazar. The delay was detected in B0218+357, a known double-image lensed system, during a period of enhanced -ray activity with peak fluxes consistently observed to reach its previous average flux. An auto-correlation function analysis identified a delay in the -ray data of days () that is day greater than previous radio measurements. Considering that it is beyond the capabilities of the LAT to spatially resolve the two images, we nevertheless decomposed individual sequences of superposing -ray flares/delayed emissions. In three such day-long sequences within a -month span, considering confusion due to overlapping flaring emission and flux measurement uncertainties, we found flux ratios consistent with , thus systematically smaller than those from radio observations. During the first, best-defined flare, the delayed emission was detailed with a Fermi pointing, and we observed flux doubling timescales of hrs implying as well extremely compact -ray emitting regions.
Subject headings:
Galaxies: active — gravitational lensing: strong — gamma rays: galaxies — quasars: individual (B0218+357)1. Introduction
B0218+357 was discovered with the NRAO 140-ft telescope in its strong source survey (S3 0218+35; Pauliny-Toth & Kellermann, 1972). Later radio imaging revealed it to be a gravitationally lensed blazar with the smallest separation double-image known (335 milli-arcseconds), and an Einstein ring with a similar angular diameter (O’Dea et al., 1992; Patnaik et al., 1993). The lens galaxy is at redshift (Browne et al., 1993), and the blazar was later securely measured at (Cohen et al., 2003).
Shortly after the lens discovery, Corbett et al. (1996) measured a time delay (Refsdal, 1964) days ( quoted throughout unless otherwise specified) at radio wavelengths, using the VLA to spatially separate and monitor the polarization variability in its leading brighter A (western) and fainter B (eastern) images. Later independent (but contemporaneous) dual-frequency VLA observations further refined the delay, (Biggs et al., 1999) and days (Cohen et al., 2000). Interestingly, Eulaers & Magain (2011) analyzed the latter’s measurements and found two possible delays, or days. Although these delays span a narrow range, days, because of the differing assumptions and analysis techniques employed in these works, there remains some debate on how to best derive their uncertainties.
B0218+357 is also a -ray source detected by the Fermi Large Area Telescope (LAT; Atwood et al., 2009) with an average flux111LAT -ray fluxes are reported at MeV throughout. photons cm-2 s-1 over its first 2-years of observations (2FGL J0221.0+3555; Nolan et al., 2012). Its steep spectrum at MeV energies (photon index, ) and overall spectral energy distribution are typical of an otherwise normal -ray emitting flat-spectrum radio quasar (e.g., Ghisellini et al., 2010). While -ray data lack the necessary spatial resolution to separate lensed images, such blazars display their most dramatic variability in -rays, and the LAT’s all-sky monitoring could give it a distinct advantage over lower-frequency imaging observations in parameterizing lensed systems. Indeed, Atwood (2007) proposed prior to Fermi’s launch that the LAT could detect delayed emission from such gravitationally lensed blazars using integrated lightcurves for sufficiently bright -ray flares. B0218+357 was found to be variable in the early LAT observations, though only modestly so (Abdo et al., 2010, see Figure 1).
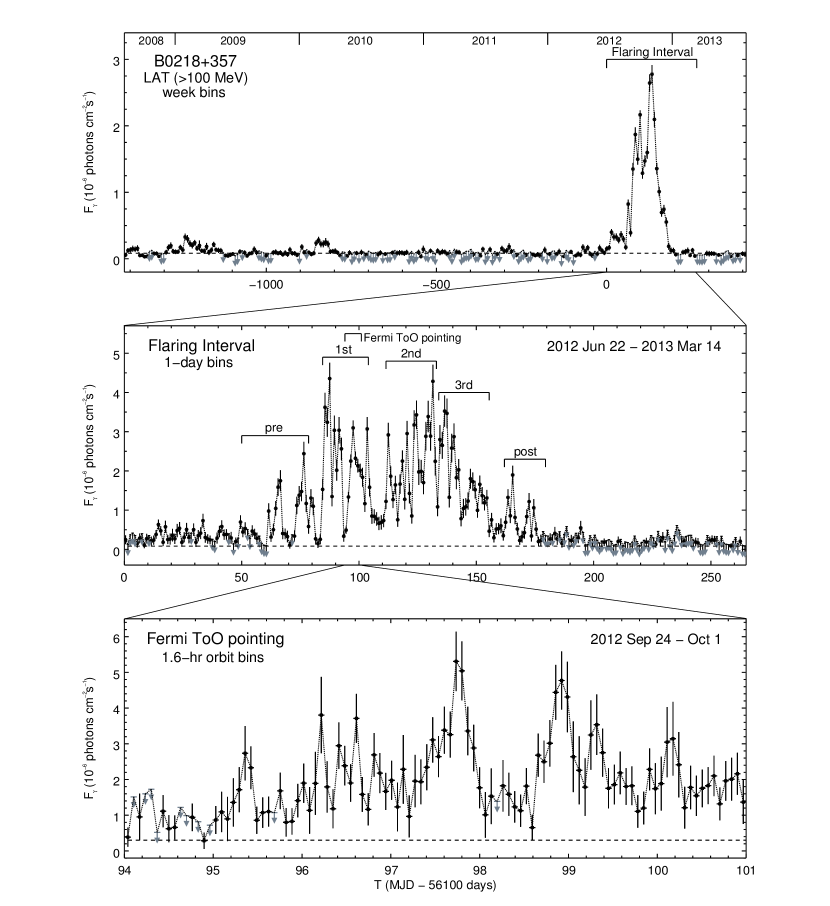
Bright -ray flaring from B0218+357 was detected with the LAT beginning late 2012 August (Ciprini, 2012), and a delayed flare was tentatively identified days later (Giroletti et al., 2012), consistent with the radio delay measurements. The blazar then displayed even brighter, more sustained flaring activity beginning September 14, thus prompting a Fermi Target-of-Opportunity (ToO) pointed observation (Cheung et al., 2012) that traced the anticipated delayed emission in detail. Two main additional flaring events were subsequently observed in as many months (see Figure 1 for an overview). We discuss the -ray temporal and spectral properties of B0218+357 together with the derived time lag, flare timescales, and observed flux ratios of the A/B images.
2. LAT Observations and Analysis
The Fermi-LAT operates in a default sky-survey mode, and over every two 1.6-hr spacecraft orbits, provides observations covering the entire sky. We used LAT observations with the P7SOURCEV6 instrument response functions, selecting 100 MeV – 100 GeV events with a region of interest (ROI) of radius = 15∘ centered at the B0218+357 radio position, , (J2000; Patnaik et al., 1992). The maximum zenith angle of 100∘ was set to minimize the contamination from Earth limb photons as well as the appropriate gtmktime filter (3) following the FSSC recommendations222http://fermi.gsfc.nasa.gov/ssc/data/analysis/documentation/Cicerone/Cicerone_Likelihood/Exposure.html for the combination of sky-survey and pointed observations. The gtlike likelihood in the Science tools (version v9r27p1) was used for the spectral analysis, assuming throughout a single power-law model for B0218+357 over the selected energy range (as in the 2FGL catalog). The background model included all 2FGL sources within the ROI as well as the Galactic (gal2yearp7v6v0.fits) and isotropic (isop7v6source.txt) diffuse components.
In generating each lightcurve, the isotropic normalization was left free to vary in each time-bin while the two known variable 2FGL sources within a ROI and the Galactic normalization were initially fitted over each full interval, then fixed at the average fitted values in the shorter time-bins. As a convenient reference point, we define days (i.e., was 2012 June 22), the time when -ray flaring became obvious. Integrating 1417 days ( years) of LAT observations prior to this date gave an average photons cm-2 s-1, with , consistent with the 2FGL value. For context, we generated a 1-week binned lightcurve for 5-years of data (2008 August 5 - 2013 August 6; Figure 1, top) assuming a fixed . Besides the modest source activity in early 2009 and 2010, the pronounced flaring beginning in mid-2012 lasting for days is apparent; thereafter, the source quieted again to earlier levels.
In order to study the flaring activity in detail, we defined a 265-day interval starting at days and generated 1-day and 6-hr binned lightcurves. The Fermi ToO observations also allowed us to produce a 1.6-hr orbit-by-orbit binned lightcurve for the sub-interval covering the first delayed flare from 2012 September 24 - October 1 ( days). To search for any possible spectral changes, we initially computed the 1-day binned lightcurve with the photon index free in the fit. For the 108 points with the greatest significance (test statistic333The source significance is equivalent to , assuming one degree of freedom (Mattox et al., 1996)., ), we found all but four points within of the weighted average value of , which in turn is consistent with the 3.9-yr average. We thus regenerated the 1-day (Figure 1, middle), the 1.6-hr orbit (Figure 1, bottom), and the 6-hr binned lightcurves (Figure 2) with fixed.
3. Results
3.1. Time Lag
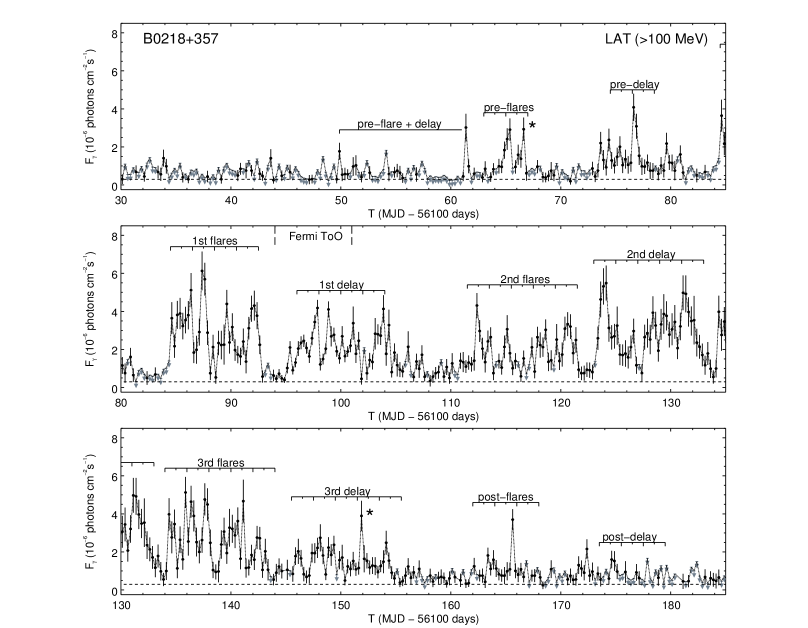
The B0218+357 -ray lightcurve appears quite complex with many peaks and valleys over the months from days (Figure 2) when the source was most active. To search for a time lag, we computed the auto-correlation function (ACF) for the 6-hr binned lightcurve up to lag values of half of the total defined 265-day flaring interval. This evenly sampled lightcurve consisted of 1057 measurements with three missing data points due to exposure gaps. The ACF was therefore computed both by a standard (after interpolating the three missing points) and a discrete routine (Edelson & Krolik, 1988). The two procedures gave almost identical results and the ACF is shown in Figure 3. A single prominent correlation peak is apparent between the time lag range of days. The peak’s significance is with respect to the measurement noise and comparing it to the height above the ACF “background.” Fitting a Gaussian function to this peak, we estimated a best-fit value, days (). Uncertainties were estimated by a model independent Monte Carlo method (Peterson et al., 1998) accounting for the effects of measurement noise and data sampling. The time lag does not match any known period observed with the LAT (Ackermann et al., 2012; Corbet et al., 2012). Because the -ray flaring was so pronounced especially from days, and appears to be broadly divided into three day long flare/delay sequences (Section 3.2), this could induce other smaller enhancements in the ACF over the studied interval.
As a cross-check of the lag derived from the full flaring interval -ray data, discrete ACFs were computed for two segments from and days. The lags obtained from Gaussian fits to the peaks were, and days, respectively, confirming the delay value and small uncertainty for the full interval, thus indicating that we obtained a robust measurement with the LAT. The small uncertainty in is competitive with the best determined radio measurements for B0218+357 although the former is marginally larger by and days () than the Biggs et al. (1999) and Cohen et al. (2000) values, respectively, but consistent with the Eulaers & Magain (2011) values. If the radio/-ray delays are intrinsically different due to an offset between the respective emitting regions, the implied offset in a singular isothermal sphere lens model is pc (projected) for a difference in the time delay. This seems extreme considering such offsets are on average pc in other blazar jets (e.g., Pushkarev et al., 2010), and may rather suggest the uncertainty in the radio delay was underestimated (Section 1).

3.2. Flare Timescales
Utilizing the -ray delay measurement, we can broadly identify three sets of flare/delay episodes in the 6-hr binned LAT lightcurve of B0218+357 (Figure 2). The pre-flare times were what triggered the initial excitement in late 2012 August and are now detailed as a 6-hr flare at days (with a corresponding delayed signal 11.5 days later) and a doublet of -hr flares 1 day apart beginning at day. In the doublet, only the first flare showed a clear delayed flare 11.5 days later while the second shows no similar corresponding delayed (or 11.5-day prior) feature; microlensing (see below) or a relatively large variation in the magnification ratio are possible explanations.
The first bright -ray sequence began at day with the best-defined flaring structure with observed fluxes, photons cm-2 s-1 over eight consecutive 6-hr bins, followed by a sharp drop and subsequent rise in one day. The Fermi ToO observation began 10 days later and the anticipated delayed emission mirrored the initial flare with the rise and peak separated by 1 day and all features well-matched 11.5 days later. We broadly identified two subsequent (2nd and 3rd) day duration -ray flaring sequences, but these were more difficult to disentangle because of superposing flares in the integrated lightcurves. The post-flare intervals showed lower fluxes, comparable to the pre-flare emission states.
In Figure 2, the observed variability timescales (doubling and halving), , during the first and subsequent two flaring episodes are securely less than the 6-hr binning. Doubling timescales as short as 2-orbits ( hrs) are further suggested in the orbit-by-orbit binned lightcurve from the Fermi ToO pointing of the first delayed flare (Figure 1, bottom). Such timescales are amongst the fastest well-constrained -ray variability in a blazar observed with the LAT (Tavecchio et al., 2010; Abdo et al., 2011) and constrain the -ray emission region diameter, cm, modulo the unknown Doppler beaming factor. Assuming an () cosmology, this translates to an angular diameter nano-arcseconds, smaller than the best radio size constraint (Mittal et al., 2007). Microlensing is thus an important factor in interpreting our -ray results because the smaller the structures, the larger the expected variability of magnification.
3.3. Flux and Magnification Ratios
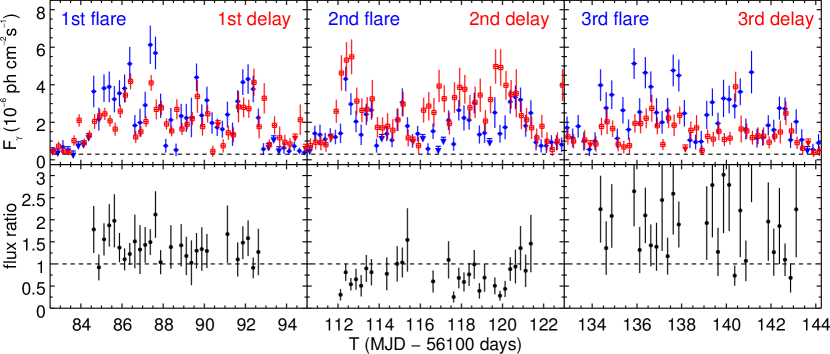
Adopting the -ray delay, we compared the 6-hr binned lightcurves for the three main flaring episodes with the observations shifted by days and computed the observed ratios between corresponding flux pairs, retaining only ratio values their uncertainties (Figure 4). The first sequence appears to show the clearest correspondence between features in the two lightcurves, with only minor deviations about the weighted average flux ratio . By subtracting a baseline, photons cm-2 s-1 (the minimum observed flux during the overall flaring interval), we can further estimate a corresponding magnification ratio in -rays , consistent with the flux ratio. The average ratios for this first sequence seem to imply the brighter A image led the B image in -rays, as observed in the radio. More conservatively however, given the large uncertainties in the individual measurements, the flux ratios appear consistent with unity. Moreover, for the subsequent 2nd and 3rd sequences, the correspondences between the flare and delayed emissions were less clear. Sharp and more scattered changes in the paired flux ratios were apparent, including values (which would imply a fainter leading A image). We interpret this as an artifact due to contamination from superposing flares after the source has already entered a very active phase. This confusion in the integrated lightcurves prevents us from reliably determining magnification ratios, and how variable this quantity may have been.
The flux ratio measured in -rays is smaller than in the radio. Biggs et al. (1999) found a small, but statistically significant frequency dependence in the flux ratios, (8 GHz) and (15 GHz), while Cohen et al. (2000) found similar values but with larger uncertainty, (8 GHz) and (15 GHz). Frequency dependence in the flux ratios of the two radio images and their observed substructures could be possibly due to free-free absorption and scattering from a molecular cloud in the lens galaxy (Mittal et al., 2007). We note that the radio and -ray observations are not simultaneous and magnification ratios could be variable with time. Further complicating such comparisons are open questions in blazar jet studies, i.e., the radio and -ray emitting regions need not coincide, with the latter likely more compact (Section 3.2), and whether successive -ray flares originated in a single emission zone or from separate relativistically moving dissipation regions along the jet. Excursions could also be due to intrinsic changes in the magnification ratios or microlensing from the relative motion of the source seen through a clumpy lensing galaxy. Indeed, microlensing in the context of extremely compact -ray emission zones (Torres et al., 2003) could explain the single 6-hr flare points that do not have corresponding lags (marked with asterisks in Figure 2), although fast superposed flares are also a possibility. Note that in optical and infrared observations, the B image appears brighter than the A image, i.e., reversed from the radio situation, and this is likely due to a combination of extinction of the A image and microlensing (Falco et al., 1999; Jackson et al., 2000).
4. Discussion and Conclusions
Our detection of a gravitational lens time delay, days, in the LAT observations of blazar B0218+357 has some interesting potential implications for future -ray studies. Foremost, the LAT detection of a -ray gravitational lens flaring event in B0218+357 suggests that such a measurement is possible in other blazars. In particular, gravitational lenses found in surveys of flat-spectrum radio sources (Browne et al., 2003; Winn et al., 2000) comprise a relevant sample as these form the basis of candidate -ray blazar catalogs (e.g., Healey et al., 2007). There are gravitational lenses from these surveys out of radio sources studied with mJy at 8 GHz and so far, the two radio brightest are detected -ray sources, PKS1830–211 (below) and B0218+357 (out of known -ray blazars; Nolan et al., 2012). The other fainter lensed systems are typically less variable at radio frequencies, making delay measurements difficult (e.g., Jackson, 2007; Eulaers & Magain, 2011) and while they are not yet reported -ray sources, the all-sky monitoring of Fermi-LAT will allow the detection of short-timescale flaring -ray activity in which to attempt delay measurements. Importantly, -ray measurements constrain lens parameters free of propagation effects like scintillation (Heeschen, 1984; Lovell et al., 2008) that can hamper radio delay attempts (Winn et al., 2004), although microlensing may be an important limiting factor because -ray emitting regions are expected to be more compact than in the radio.
The case of B0218+357 appears to be the first clear case of a -ray detected gravitational lens time delay for any astrophysical system. Previously, -ray flaring from the gravitationally lensed blazar PKS1830–211 was detected with the Fermi-LAT (Ciprini, 2010) with a claimed delay, days (Barnacka et al., 2011) consistent with the radio measurement, days (Lovell et al., 1998). Subsequent analysis of more LAT data, including several prominent flares, did not confirm the -ray delay (Abdo et al., 2013). If the -ray delay in PKS1830–211 is assumed to be the same as the radio-measured delay, the non-detection of delayed -ray flares implies a magnification ratio in -rays much larger () than that observed in the radio (; Lovell et al., 1998), thus opposite of what we observed in B0218+357. With only two examples studied, no trend is clear. However, if microlensing effects can be disentangled (and in fact utilized as additional constraints on the emitting region source size), magnification ratios in radio and -ray arising from spatially distinct emission regions may be utilized as a probe of differing multi-frequency jet structures (see Martí-Vidal et al., 2013).
A time delay due to gravitational lensing of a background source by a foreground object can constrain Hubble’s parameter (Refsdal, 1964). The original lens model for B0218+357 (Biggs et al., 1999) predicted a delay, days ( confidence). Utilizing improved localization of the lensing galaxy, the delay model uncertainty was reduced to (York et al., 2005), thus deriving , assuming the often quoted Biggs et al. (1999) measured radio delay (cf., Section 3.1). Adopting the York model for our independent -ray measured delay results in , where this quoted uncertainty is due only to the time delay estimate and the statistical uncertainty in the mass model. Systematic errors in the modeling, and additional uncertainty due to line-of-sight structures (e.g., Suyu et al., 2012) will likely significantly increase this. Nevertheless, it is interesting that the LAT time delay brings the estimated value of Hubble’s constant down, towards the low end of modern measurements (e.g., Planck Collaboration, 2013). An underdense environment would require this inferred value to increase; including external lensing effects in future cosmographic analyses might be important in this system. Moreover, since the radio and -ray emission regions are likely not co-spatial, the assumed radio-derived time-delay function values may be inaccurate. A fully self-consistent joint modeling of the radio and -ray source is needed to resolve this. If the LAT can measure a lag in the -ray lightcurve of one of the previously known systems with wider separation or in a new example (below), this can give independent -ray based constraints on Hubble’s constant.
One exciting result would be the detection of a lens delay in a flaring -ray source that is not yet identified as a gravitationally lensed system at radio wavelengths or otherwise. These could possibly be lensed image pairs with flat-spectrum radio sources at smaller separations than in the 0.2′′ resolution of VLA surveys (references above). Similar radio lens surveys in the southern hemisphere are not yet as complete (e.g., Prouton et al., 1999), so a -ray delay signature in their LAT lightcurves could betray the presence of a previously unknown lens system. Such a strategy has been proposed for future wide-field optical surveys (Pindor, 2005), and the discovery potential of the LAT in -rays should now be recognized. Furthermore, with the different flux ratios at radio and -ray wavelengths, and possible variability of the ratio, some sources could be bright in -rays and less conspicuous at radio. Such potential gravitational lenses could be hidden in plain sight within the radio catalogs used for blazar associations in LAT catalogs, or could be amongst the currently unidentified -ray sources (Torres et al., 2002).
References
- Abdo et al. (2010) Abdo, A. A., Ackermann, M., Ajello, M., et al. (Fermi-LAT Collaboration) 2010, ApJ, 722, 520
- Abdo et al. (2011) —. 2011, ApJ, 733, L26
- Abdo et al. (2013) —. 2013, submitted (lensed blazar PKS1830–211)
- Ackermann et al. (2012) Ackermann, M., Ajello, M., Albert, A., et al. (Fermi-LAT Collaboration) 2012, ApJS, 203, 4
- Atwood (2007) Atwood, W. B., 2007, in the Les Houches Winter School “The Violent Universe,” March 2007, CEA-Saclay
- Atwood et al. (2009) Atwood, W. B., Abdo, A. A., Ackermann, M., et al. (Fermi-LAT Collaboration) 2009, ApJ, 697, 1071
- Barnacka et al. (2011) Barnacka, A., Glicenstein, J.-F., & Moudden, Y. 2011, A&A, 528, L3
- Biggs et al. (1999) Biggs, A. D., Browne, I. W. A., Helbig, P., et al. 1999, MNRAS, 304, 349
- Browne et al. (1993) Browne, I. W. A., Patnaik, A. R., Walsh, D., & Wilkinson, P. N. 1993, MNRAS, 263, L32
- Browne et al. (2003) Browne, I. W. A., Wilkinson, P. N., Jackson, N. J. F., et al. 2003, MNRAS, 341, 13
- Cheung et al. (2012) Cheung, C. C., Ojha, R., Orienti, M., Wood, D. L. (Fermi-LAT Collaboration) 2012, The Astronomer’s Telegram, 4411, 1
- Ciprini (2010) Ciprini, S. (Fermi-LAT Collaboration) 2010, The Astronomer’s Telegram, 2943, 1
- Ciprini (2012) —. 2012, The Astronomer’s Telegram, 4343, 1
- Cohen et al. (2000) Cohen, A. S., Hewitt, J. N., Moore, C. B., & Haarsma, D. B. 2000, ApJ, 545, 578
- Cohen et al. (2003) Cohen, J. G., Lawrence, C. R., & Blandford, R. D. 2003, ApJ, 583, 67
- Corbet et al. (2012) Corbet, R., Cheung, C. C., Kerr, M., & Ray, P. S. 2012, 4th International Fermi Symposium Proceedings, eConf C121028, 21, arXiv:1302.5141
- Corbett et al. (1996) Corbett, E. A., Browne, I. W. A., Wilkinson, P. N., & Patnaik, A. 1996, in Astrophysical Applications of Gravitational Lensing, Eds. C. S. Kochanek & J. N. Hewitt, IAU Symp. 173, 37
- Edelson & Krolik (1988) Edelson, R. A., & Krolik, J. H. 1988, ApJ, 333, 646
- Eulaers & Magain (2011) Eulaers, E., & Magain, P. 2011, A&A, 536, A44
- Falco et al. (1999) Falco, E. E., Impey, C. D., Kochanek, C. S., et al. 1999, ApJ, 523, 617
- Ghisellini et al. (2010) Ghisellini, G., Tavecchio, F., Foschini, L., et al. 2010, MNRAS, 402, 497
- Giroletti et al. (2012) Giroletti, M., Orienti, M., & Cheung, C. C. (Fermi-LAT Collaboration) 2012, The Astronomer’s Telegram, 4371, 1
- Healey et al. (2007) Healey, S. E., Romani, R. W., Taylor, G. B., et al. 2007, ApJS, 171, 61
- Heeschen (1984) Heeschen, D. S. 1984, AJ, 89, 1111
- Jackson (2007) Jackson, N. 2007, Living Reviews in Relativity, 10, 4
- Jackson et al. (2000) Jackson, N., Xanthopoulos, E., & Browne, I. W. A. 2000, MNRAS, 311, 389
- Lovell et al. (1998) Lovell, J. E. J., Jauncey, D. L., Reynolds, J. E., et al. 1998, ApJ, 508, L51
- Lovell et al. (2008) Lovell, J. E. J., Rickett, B. J., Macquart, J.-P., et al. 2008, ApJ, 689, 108
- Martí-Vidal et al. (2013) Martí-Vidal, I., Muller, S., Combes, F., et al. 2013, A&A, 558, A123
- Mattox et al. (1996) Mattox, J. R., Bertsch, D. L., Chiang, J., et al. 1996, ApJ, 461, 396
- Mittal et al. (2007) Mittal, R., Porcas, R., & Wucknitz, O. 2007, A&A, 465, 405
- Nolan et al. (2012) Nolan, P. L., Abdo, A. A., Ackermann, M., et al. (Fermi-LAT Collaboration) 2012, ApJS, 199, 31
- O’Dea et al. (1992) O’Dea, C. P., Baum, S. A., Stanghellini, C., et al. 1992, AJ, 104, 1320
- Patnaik et al. (1992) Patnaik, A. R., Browne, I. W. A., Wilkinson, P. N., & Wrobel, J. M. 1992, MNRAS, 254, 655
- Patnaik et al. (1993) Patnaik, A. R., Browne, I. W. A., King, L. J., et al. 1993, MNRAS, 261, 435
- Pauliny-Toth & Kellermann (1972) Pauliny-Toth, I. I. K., & Kellermann, K. I. 1972, AJ, 77, 797
- Peterson et al. (1998) Peterson, B. M., Wanders, I., Horne, K., et al. 1998, PASP, 110, 660
- Pindor (2005) Pindor, B. 2005, ApJ, 626, 649
- Planck Collaboration (2013) Planck Collaboration, Ade, P. A. R., Aghanim, N., et al. 2013, arXiv:1303.5076
- Prouton et al. (1999) Prouton, O. R., Warren, S. J., & Wright, A. E. 1999, in Gravitational Lensing: Recent Progress and Future Goals, Eds. T.G. Brainerd & C.S. Kochanek, arXiv:astro-ph/9909304
- Pushkarev et al. (2010) Pushkarev, A. B., Kovalev, Y. Y., & Lister, M. L. 2010, ApJ, 722, L7
- Refsdal (1964) Refsdal, S. 1964, MNRAS, 128, 307
- Suyu et al. (2012) Suyu, S. H., Hensel, S. W., McKean, J. P., et al. 2012, ApJ, 750, 10
- Tavecchio et al. (2010) Tavecchio, F., Ghisellini, G., Bonnoli, G., & Ghirlanda, G. 2010, MNRAS, 405, L94
- Torres et al. (2002) Torres, D. F., Romero, G. E., & Eiroa, E. F. 2002, ApJ, 569, 600
- Torres et al. (2003) Torres, D. F., Romero, G. E., Eiroa, E. F., Wambsganss, J., & Pessah, M. E. 2003, MNRAS, 339, 335
- Winn et al. (2000) Winn, J. N., Hewitt, J. N., Schechter, P. L., et al. 2000, AJ, 120, 2868
- Winn et al. (2004) Winn, J. N., Lovell, J. E. J., Bignall, H., et al. 2004, AJ, 128, 2696
- Wucknitz et al. (2004) Wucknitz, O., Biggs, A. D., & Browne, I. W. A. 2004, MNRAS, 349, 14
- York et al. (2005) York, T., Jackson, N., Browne, I. W. A., Wucknitz, O., & Skelton, J. E. 2005, MNRAS, 357, 124