Conventional Superconductivity properties of the ternary boron-nitride Nb2BN
Abstract
Superconducting bulk properties of ternary Nb2BN are confirmed and are described by means of magnetization, electronic transport and specific-heat measurements. BCS conventional superconductivity is found with T K. Critical fields Hc1(0)= 93 Oe and Hc2(0)= 2082 Oe are extrapolated by magnetic and resistivity measurements. The specific heat data reveals mJ/mol K2 and mJ/mol K4 in good agreement with the BCS Theory.
pacs:
74.20.Fg, 71.28.+d, 72.80.-rI. INTRODUCTION
Among the known ternary carbides, Mo2BC deserves attention due its superconducting behaviour with a Tc ranging from 5 to 7.5 K Mo ; Mo2 . Mo2BC has an orthorhombic symmetry cel1 (no. 63, space group cmcm) with , and . Fig. 1 illustrates such structure, where distorted Mo6 octahedron layers are separated from each others by zig-zag B chains which pass through the trigonal prisms of Mo atoms cel2 . Carbon atoms are located at the center of the Mo octahedrons cel3 ; cel4 . Several efforts cel4 ; ef1 ; ef2 ; ef3 were made to enhance the superconducting properties of this compound by inducing chemical pressure with transition elements as M = Zr, Rh, Nb, Hf, Ta and W at the Mo sites. While Tc of Mo2-xMxBC decreased with increase of for all the alloys, only the Rh-containing alloy ef3 showed an increase up to TK.
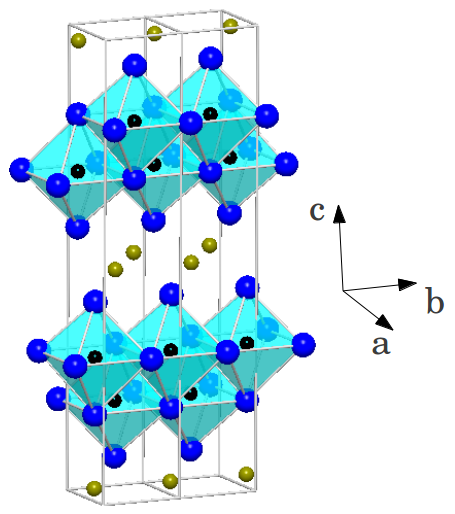
After the discovery of Mo2BC a boron-nitride with nominal Nb2BN composition was synthesized for the first time Nb as a thermodynamically stable compound at 1200∘C. In this compound Nb atoms are arranged in similar distorted octahedron and are separated by B zig-zag chains as in Mo2BC and N atoms occupy the same position as C atoms. Lattice Parameters of Nb2BN are quite similar to those of Mo2BC being , and . Superconductivity with critical temperature close to 2.2 K was reported in Nb2BNx (x undetermined) compound. However other properties such as specific heat or resistivity were not performed by the authors in order to confirm bulk superconductivity. In this context our results show unambiguously bulk superconductivity at 4.4 K in single phase polycrystalline samples of Nb2BN.
II. EXPERIMENTAL
Polycrystalline Nb2BN samples were synthesized by conventional powder solid state reaction method. High purity 300 mesh Nb (99.99) and hexagonal BN (99.999) were used. To ensure the good quality of the primary reaction BN was degassed at 1000∘C in vacuum for twenty four hours before its usage. Stoichiometric amounts (Nb 2:1 BN) of the reagents were weighted, mixed on an agatar mortar and pressed (4 tons) into pellets of cylindrical shape. Compressed mixtures were sealed on quartz tubes under 1 bar argon atmosphere and heated at 1200∘C. Each 7 days of annealing the samples were quenched, grounded, pressed and encapsulated again to be treated at 1200∘C. A complete reaction was obtained only after 28 days of annealing.
X-ray diffraction patterns were collected with a Panalitical Empyrean X-ray diffractometer using CuKα radiation. Rietveld refinements young were calculated using the Fullprof suite considering a error as the minimum standard. Magnetic, electric, and thermal, initial characterizations were made using a Quantum Design PPMS Evercool II. Magnetization (M) measurements were obtained using a commercial VSM magnetometer (Quantum Design) in a DC external field of 50 Oe in zero field cooling (ZFC) and field cooling (FC) conditions, on a temperature range (T) from 2 to 20 K. Magnetization (M) versus applied field (H) data were acquired at constant temperatures between 2 and 5 K. Electrical resistivity measurements were performed between 1.8 and 300 K using the conventional four-point method. Thin Cu wires were welded to a regular shape sample and served as the voltage and current leads, using a high purity Ag epoxy. Applied magnetic fields were also used to estimate the upper critical field. The superconducting critical temperature (Tc) was defined as the transition midpoint. The heat capacity measurements were determined using the relaxation method of a piece cut from the sample on a calorimetric probe coupled to the PPMS system on a temperature range from 2 to 10 K.
III. RESULTS AND DISCUSSION
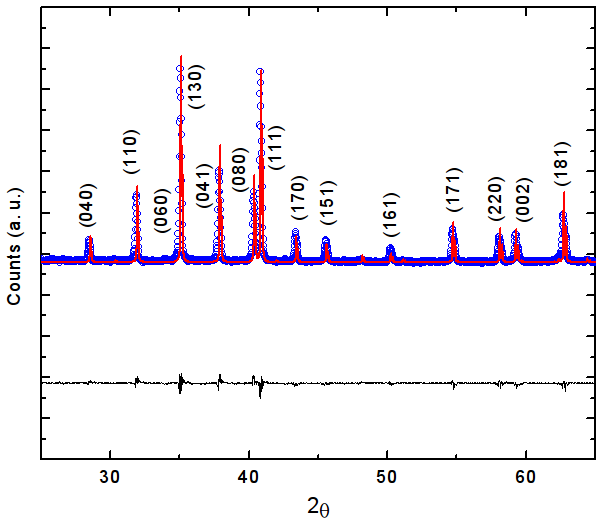
Figure 2 shows the diffraction pattern of a typical Nb2BN sample after 28 days of heat treatment. All reflections can be indexed with the orthorhombic Mo2BC structure with space group cmcm and without any trace of secondary phases within the limits of this technique. Rietveld refinements led to the following occupancies: Nb-1 atoms occupy the 4c (0, 0.721, 0.25), Nb-2 atoms occupy the 4c (0, 0.3139, 0), N atoms occupy the 4c (0, 0.192, 0) and B atoms the 4c (0, 0.4731, 0.25) positions. These results are in good agreement with the ones reported earlier Nb . The Nb-1 bonding distance have a slightly difference (2.22 and 3.01 Å) with the original Mo-1 bonding dintance (2.11 and 3.086 Å) in Mo2BC.
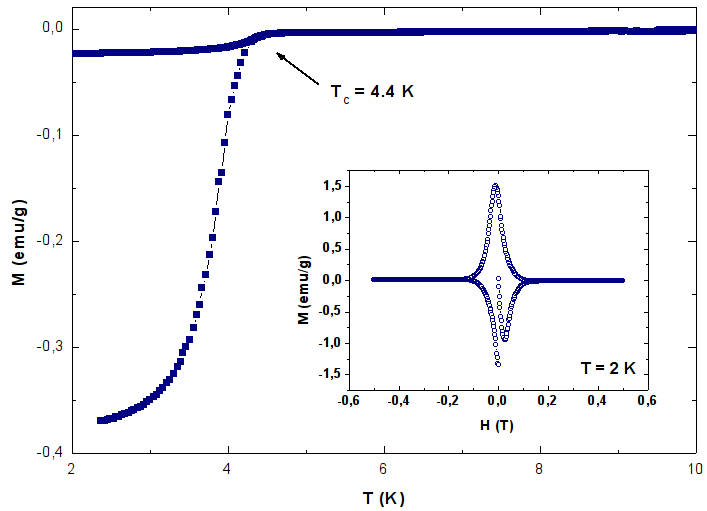
The temperature dependence of the magnetization in zero-field cooled (ZFC) and field cooled (FC) conditions was measured using an applied magnetic field of 50 Oe and is presented in Figure 3. In both ZFC and FC a clear superconducting transition can be seen around 4.4 K. The superconducting volume fraction (%) can be estimated within the Meissner state through the dependence of M vs H, since the value of the superconducting state susceptibility (perfect diamagnetism) is -1/4, according to the CGS system. Note that even without considering the demagnetization size susceptibility factor, this result suggests bulk superconductivity. On the FC curve, the flux expulsion of about 7% indicates a strong flux pinning as expected. Inset of Figure 3 displays the isothermal M versus H at K that shows a type II superconductivity behaviour.
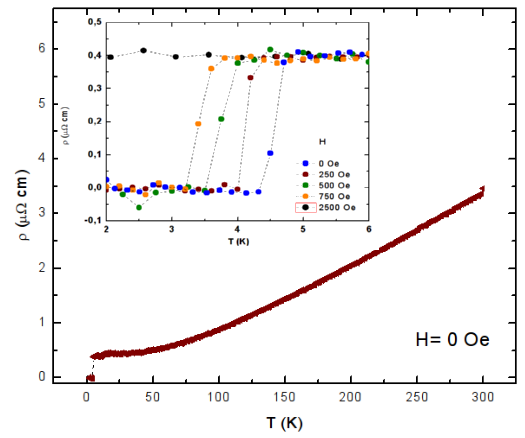
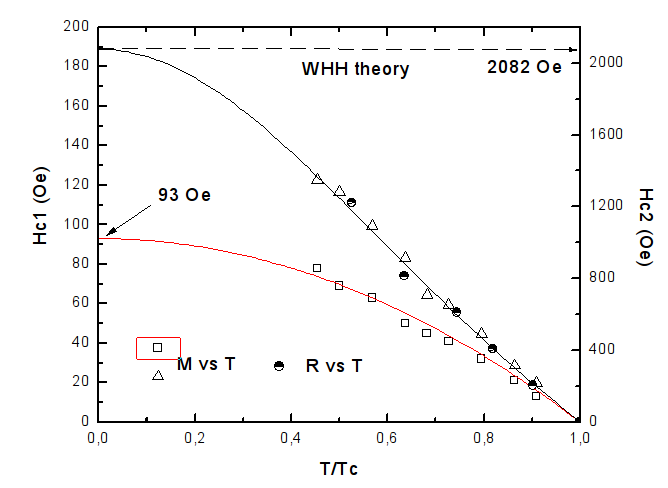
The typical temperature dependence of the resistivity of Nb2BN is shown in Figure 4. A sharp resistivity transition close to 4.4 K (at , K) is clearly observed at zero applied magnetic field which indicates the high quality of the obtained samples. These results are consistent with those obtained in magnetization measurements. The inset in Fig. 4 shows the resistivity dependence on the applied magnetic field. An estimate of the upper critical field at 0 K [] can be made through the Werthamer, Helfand, and Hohenberg (WHH) theory pool represented by Eq. 1. According this theory can be estimated inside the limit of a short electronic mean-free path (dirty limit) and is given by :
| (1) |
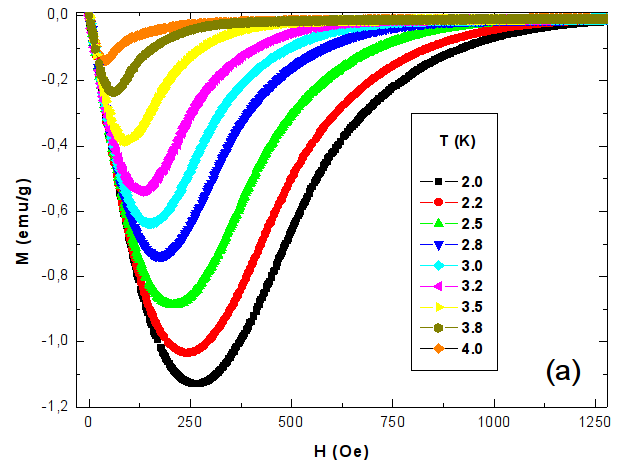
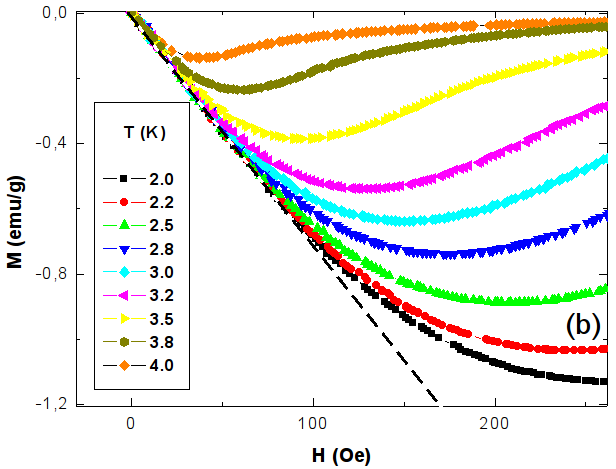
The temperature dependence of is shown in Figure 5 where the black line represents the conventional fitting of obtained using the Eq. 1. The critical field is estimated to be 2082 Oe, a value that suggests a type II superconductivity. Another estimate of was obtained by using the data of magnetization versus applied field on different temperatures as shown on Figure 6. The followed criterion consisted of taking the corresponding field of for the given temperature, plotting and fitting the values with the equation 1 to obtain . The result is completely consistent with the resistivity method. The lower critical field (H) was extrapolated from the applied magnetic field dependence of the magnetization at several temperatures shown in Figure 6a, using the Ginzburg-Landau equation kittel which gives 93 Oe. The values of Hc1 were determined by examining the divergence from linearity of the slope of the magnetization curve (Fig. 6b), using the criterion M = 10-3 emu for the difference between the Meissner line and magnetization signal. The calculated values of and allows us to estimate the coherence length and penetration deep through of the Ginzburg-Landau (GL) formulas kittel :
| (2) |
| (3) |
where is a quantum flux equal 2.068 x 10⁻¹⁵ T.m-2, which yields 425 and nm at 0 K. Using the relation we obtained the value that agrees with the previous results indicating a type-II superconducting behaviour.
While the magnetization and resistivity suggest bulk superconductivity in Nb2BN, an anomaly in the specific heat measurement is necessary for confirmation. Figure 7 displays the specific heat divided by temperature (C/T) versus T2 at zero applied magnetic field. A jump in the specific heat is clearly observed on the midpoint of the transition at Tc = 4.4 K and a small transition length of only T 0.3 K. The consistency between the magnetization, resistivity, and heat capacity transitions is a clear evidence of bulk superconductivity in Nb2BN. The normal state specific heat (Cn) is assumed to have contributions from the standard linear electronic contribution (T) term and the cubic phonon (T3) term.
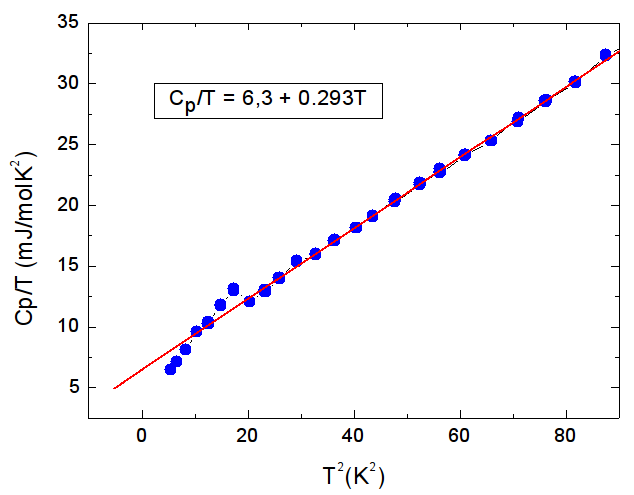
In Figure 7 the normal state specific heat (Cn) can be fitted to the expression by a least squares analysis, with resultant values of mJ/mol K2 and mJ/mol K4. The value corresponds to a Debye temperature of K. The Sommerfeld coefficient suggests a moderated density of states at the Fermi level typical of other transition-metal superconductors.
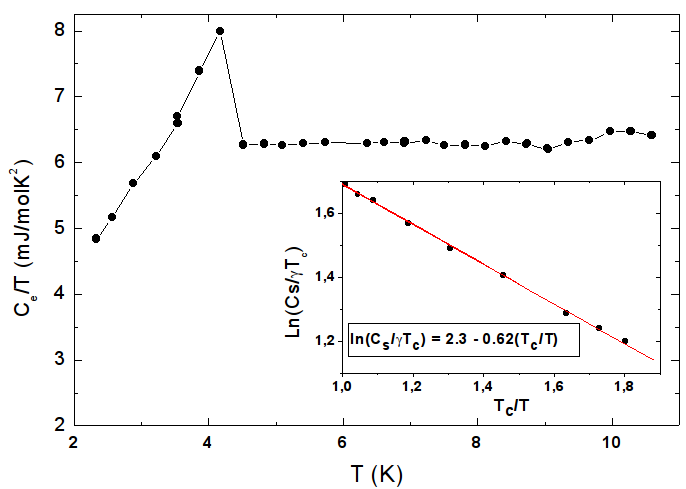
A subtraction of the phonon contribution from the total specific heat allows the analysis of just the electronic contribution (Ce), displayed here as Ce/T versus T in Figure 8. The analysis of the specific heat anomaly shows the magnitude of the jump at Tc to be , which is significantly smaller than the weak-coupling BCS limit of 1.43. However, this apparent inconsistency is related with the superconducting fraction estimated from magnetization measurement displayed in Fig. 3. Although the reason for the estimated value from specific heat measurement diverges from BCS prediction is not obvious, the size of the jump strongly suggests that the superconducting behaviour is in a BCS weak coupling limit. Indeed, the exponential behaviour of the electronic component on the superconducting state is in good agreement with the BCS theory as shown in inset of Figure 8. The linear behaviour of the logarithmic scale versus Tc/T is totally consistent with BCS prediction of the superconducting state below . The comparison with BCS formula for Ce below Tc:
| (4) |
which yields an energy gap () of 0.65 meV for T 0 and which again is a signal of a weak BCS coupling value. Then, all results from specific heat suggest that Nb2BN is a conventional BCS superconducting material. In all BCS superconductors the Cooper-pairing is phonon mediated and the dimensionless electron-phonon constant can be determined by the McMillan equation millan :
| (5) |
If the Coulomb coupling constant is considered to be 0.13, which is a usual value, and the Debye temperature from specific-heat is considered 298 K, the value the obtained value is again in excellent agreement with a weak coupling BCS value for other conventional superconducting materials other .
IV. CONCLUSIONS
In this paper the superconducting properties of Nb2BN were explored. Conventional bulk superconductivity was found at T K with superconducting critical fields and Oe. Results suggest a conventional type II superconductivity with and bulk superconductivity was confirm trough specific heat measurements, showing the values of mJ/mol K2 and mJ/mol K4 in good agreement with the BCS Theory.
ACKNOWLEDGEMENTS
This work was financied by the Brazilian agency CNPq 302892/2011-7, 140804/2012-9 and FAPESP 2010/11770-3
References
- (1) L. E. Toth.,J. Less-Common Metals, 13, 129 (1967).
- (2) L. E. Toth and J. Zbasnik, Acta Met., 16, 1177 (1968).
- (3) L. E. Toth, Transition Metal Carbides and Nitrides,59, (1971).
- (4) W. Jeitschko, H. Novotny and F. Benesovsky, Monatsh. Chem., 3, 565 (1963).
- (5) J. O. Bovin, M. O’Keeffe and L. Stenberg,J. Solid State Chem., 22, 221 (1977).
- (6) S. Gordon, A. G. Tharp and Q. Johnson, Acta Crystallogr., 25, 698 (1969).
- (7) V. Sadagopan and H. Gatos, J. Phys. Chem. Solids, 27, 235 (1966).
- (8) E. Rudy, F. Benesovsky and L. Toth, Z. Metallk., 54, 345 (1963).
- (9) P. Lejay, B. Chevalier, J. Etourneau and P. Hagenmuller, J. Less-Common Met., 14, 34 (1968).
- (10) P. Rogl G., Phase diagrams of ternary metal-boron-carbon systems, MSIT-ASM International, 261 (1998).
- (11) Young, R. A., The Rietveld Method, International Union of Crystallography, Oxford University Press, New York (1993).
- (12) C. K. Poole, H. A. Farach, R. J. Creswic, Handbook of Superconductivity, 305 (1999).
- (13) Kittel, C., Introduction to Solid State Physics, ed., John Wiley Sons, inc., New York (1993).
- (14) W.L. McMillan, Phys. Rev. B, textbf167, 331 (1968).
- (15) P. Roedhammer, E. Gmlin, W. Weber and J.P. Remeika, Phys. Rev. B, 15 (1977).