Nature of -deformation in Ge and Se nuclei and the triaxial projected shell model description
Abstract
Recent experimental data have demonstrated that 76Ge may be a rare example of a nucleus exhibiting rigid -deformation in the low-spin regime. In the present work, the experimental analysis is supported by microscopic calculations using the multi-quasiparticle triaxial projected shell model (TPSM) approach. It is shown that to best describe the data of both yrast and -vibrational bands in 76Ge, a rigid-triaxial deformation parameter is required. TPSM calculations are discussed in conjunction with the experimental observations and also with the published results from the spherical shell model. The occurrence of a -band in 76Ge is predicted with the bandhead at an excitation energy of 2.5 MeV. We have also performed TPSM study for the neighboring Ge- and Se-isotopes and the distinct -soft feature in these nuclei is shown to result from configuration mixing of the ground-state with multi-quasiparticle states.
pacs:
21.60.Cs, 21.10.Re, 23.20.-g, 27.50.+eI Introduction
Atomic nuclei are among the most fascinating quantum many-body systems that depict a rich variety of shapes and structures BM75 . Most of the nuclei are known to have axially-symmetric, dominantly quadrupole, deformed shape in the ground-state. However, there are also regions in the nuclear periodic table, referred to as transitional regions, where axial-symmetry is broken and a triaxial mean-field description is appropriate to characterize the properties of these nuclei JS99 . For nuclei depicting triaxial shapes, there is a long-standing issue whether these nuclei have rigid or soft -deformation (see, for example, discussions in Refs. SW01 ; GS03 ; DJ09 ). Traditionally, there are two extreme phenomenological models that describe the triaxiality: the one with a rigid- deformation of Davydov and Flippov (DF) AS58 and the -soft model of Wilets and Jean LM56 . Both models give rise to similar level energies and transition strengths for the ground-state bands and, therefore, it is impossible to delineate the two different modes of excitations. In fact, there have been suggestions OS87 that the two descriptions are equivalent and intrinsic single-particle wave functions obtained from a triaxially-deformed well are useful in describing low-lying collective states. However, it has been demonstrated NV91 that the phase of the odd-even staggering (i.e. the staggering of the odd- and even-spin levels) of the observed -bands could shed light on the nature of the triaxial shape with rigid- rotation exhibiting an opposite staggering pattern to that of the -soft case.
Recently, using the experimental techniques of above-barrier Coulomb excitation and inelastic scattering, -band energies of 76Ge have been extended considerably YT13 . It has been shown that the odd-even staggering of the -band is quite opposite to that of all neighboring nuclei and is in conformity with that expected for a rigid- deformation YT13 ; EA07 . This is one of rare examples of atomic nuclei exhibiting rigid- deformation in the low-lying states. The observed yrast- and excited states have been discussed YT13 using the DF model and also the spherical shell model (SSM) approaches. In the SSM approach NY08 , the pairing plus quadrupole-quadrupole interaction was employed in the configuration space, and it has been demonstrated that SSM provides a very good description of the observed data for the low-lying states in 76Ge.
The purpose of the present work is to investigate the high-spin properties of 76Ge using the multi-quasiparticle (qp) triaxial projected shell model (TPSM) approach GH08 ; JG09 ; JG11 ; GJ12 ; Ch12 . In the SSM analysis, the primary emphasis was on the low-lying states and the present investigation complements the results obtained by the SSM approach. In TPSM, apart from 0-qp, 2- and 4-qp configurations are explicitly included in the basis space. Therefore, in this model it is possible to investigate the high-spin band-structures, which provides important information on the interplay between collective and single-particle excitations, and thus to probe single-particle structures in the neutron-rich mass region. In the present study, we have also performed a detailed study of the neighboring nuclei to investigate the nature of -deformation in these nuclei in comparison to 76Ge.
The manuscript is organized as follows. In the next section, we provide a few details of the TPSM model for completeness and further details can be found in our earlier publications GH08 ; JG09 ; JG11 ; GJ12 ; Ch12 ; YK00 . Section III is completely devoted to the investigation of 76Ge and in section IV, the results of the neighboring Ge- and Se-isotopes are presented and discussed. Finally, in section V, we provide a summary of the work performed in the present manuscript.
II Outline of the triaxial projected shell model
In TPSM, triaxially-deformed Nilsson states are employed as a starting basis to describe a nucleus exhibiting axial and triaxial deformations. An explicit three-dimensional angular-momentum projection is then performed for configurations built from the deformed Nilsson states. A triaxial qp configuration is an admixture of different (projection along the symmetry axis) states, and the vacuum configuration is composed of states for an even-even system. It was shown YK00 that the angular-momentum projection from the , 2, and 4 states correspond to the ground, - and - bands, respectively. The model has recently been extended GH08 ; JG09 ; JG11 ; GJ12 ; Ch12 ; GC06 ; SB10 to include multi-qp configurations in the model space, which allows one to describe states of collective -vibrations and qp excitations on an equal footing. For instance, the multi-qp TPSM approach has been used to investigate the interplay between the vibrational and the quasi-particle excitation modes in 166-172Er JG11 . It was demonstrated that a low-lying bands observed in these nuclei, the nature of which had remained unresolved, are built on triaxially-deformed 2-qp states. This band is observed to interact with the -vibrational band and becomes favored at high angular-momentum for some Er-nuclei. In another study Ch12 , the long-standing puzzle of the very different decay rates from the same 2-quasineutron isomers in the isotones was investigated. It was shown that the highly -forbidden transition from the isomer to the ground-state band is sensitive to the mixing with the state of the -vibrational band.
For even-even systems, the TPSM basis are composed of 0-qp (qp vacuum), 2-proton, 2-neutron, and 4-qp configurations, i.e.,
| (1) |
where is the three-dimensional angular-momentum-projection operator RS80 and in (1) represents the triaxial qp vacuum state. The qp basis chosen in (1) is adequate to describe high-spin states up to for even-even systems. In the present analysis we shall, therefore, restrict our discussion to this spin regime. It is noted that for the case of axial symmetry, the qp vacuum state has KY95 , whereas in the present case of triaxial deformation, the vacuum state is a superposition of all possible -values. Rotational bands with the triaxial basis states, Eq. (1), are obtained by specifying different values for the -quantum number in the angular-momentum projection operator RS80 .
| 70Ge | 72Ge | 74Ge | 76Ge | 78Ge | 80Ge | 76Se | 78Se | 80Se | 82Se | |
|---|---|---|---|---|---|---|---|---|---|---|
| 0.235 | 0.230 | 0.220 | 0.200 | 0.210 | 0.200 | 0.260 | 0.256 | 0.220 | 0.180 | |
| 0.145 | 0.150 | 0.155 | 0.160 | 0.150 | 0.145 | 0.155 | 0.150 | 0.130 | 0.130 | |
| 31.68 | 33.11 | 35.17 | 38.66 | 35.54 | 35.94 | 30.81 | 30.37 | 30.58 | 35.84 |
| 70Ge | 8.9649 | 7.9944 | 8.4658 |
|---|---|---|---|
| 72Ge | 8.7473 | 7.5382 | 8.1202 |
| 74Ge | 8.5451 | 7.1283 | 7.8046 |
| 76Ge | 7.8172 | 6.3219 | 7.0299 |
| 78Ge | 8.0674 | 6.3338 | 7.1482 |
| 80Ge | 8.6937 | 6.6345 | 7.5947 |
| 76Se | 7.8240 | 6.7959 | 7.2918 |
| 78Se | 7.6688 | 6.4576 | 7.0372 |
| 80Se | 7.7027 | 6.2968 | 6.9643 |
| 82Se | 8.0623 | 6.4064 | 7.1868 |
As in the earlier projected shell model KY95 calculations, we use the pairing plus quadrupole-quadrupole Hamiltonian
| (2) |
Here is the spherical single-particle Hamiltonian which contains a proper spin-orbit force described by the Nilsson parameters Ni69 . The QQ-force strength is related to the quadrupole deformation as a result of the self-consistent HFB condition and the relation is given by KY95 :
| (3) |
where , with MeV, and the isospin-dependence factor is defined as
with for neutron (proton). The harmonic oscillation parameter is given by with fm2. With Eq. (3) and the deformation parameters in Table 1, the QQ-force strength for all nuclei studied in the present work can then be determined and are shown in Table 2. The monopole pairing strength (in MeV) is of the standard form
| (4) |
In the present calculation, we take and , which approximately reproduce the observed odd-even mass difference in the mass region. This choice of is appropriate for the single-particle space employed in the model, where three major shells are used for each type of nucleons ( for both neutrons and protons). The quadrupole pairing strength is assumed to be proportional to , and the proportionality constant being fixed as 0.18. These interaction strengths are consistent with those used earlier for the same mass region js01 ; rp01 .
III Results of 76Ge and rigid -deformation
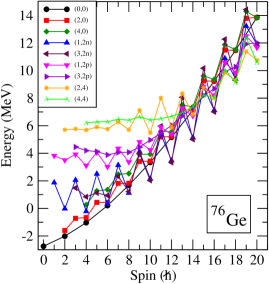
TPSM calculations proceed in several stages. In the first stage, the deformed basis space is constructed by solving the triaxially-deformed Nilsson potential. In the present work, we have employed and (see Table 1) in the Nilsson potential to generate the deformed basis for 76Ge. The value of has been adopted from the earlier study LU07 and the value of has been chosen so that the behavior of the band is properly described. We shall discuss later the dependence of the calculation on the triaxial parameter. Pairing is described by performing a BCS calculation for the single-particle states generated by the triaxially-deformed Nilsson potential. In the present work, no particle-number projection is included, and therefore, this quantum number is conserved only on the average at the BCS level. In the second step, the good angular-momentum states are obtained from the deformed basis by employing the three-dimensional angular-momentum projection technique. The projected bands obtained from 0-, 2-, and 4-qp states close to the Fermi surface are displayed in Fig. 1 (the so-called band diagram, see Ref. KY95 ). The projection from the 0-qp configuration gives rise to band structures with , corresponding to the ground-, - and -band YK00 . The calculated band-head energy of the and -bands are about 1.21 MeV and 3.03 MeV, respectively, above the ground state.
It is observed from Fig. 1 that the projected bands from 2-quasineutron state having and 3 cross the ground-state band at . These bands are the -band built on the 2-quasineutron-aligned configurations. The 2-quasiproton states are at higher excitation energies as compared to the 2-neutron states, and therefore, do not cross the ground-state band. Further, at , the 4-qp structures (2-quasineutron plus 2-quasiproton) having and 4 cross the yrast-configuration. We stress that in Fig. 1, only the lowest bands are displayed for clarity. In the actual analysis, we use more than thirty-five configurations in the mixing for each spin-state.
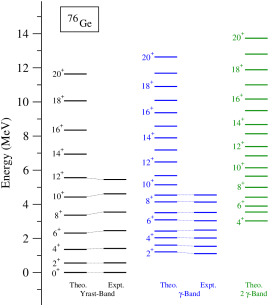
In the third and the final stage, the projected basis are used to diagonalize the shell model Hamiltonian, Eq. (2). The band energies, obtained after diagonalization, are shown in Fig. 2 with the available experimental data. It is evident from the figure that TPSM results are in excellent agreement with the known experimental energies. In Fig. 2, the excitation spectrum is predicted for the -band, and we hope that this well-developed band will be populated in future experimental studies.
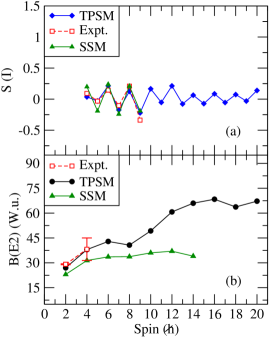
In order to understand the nature of the triaxial shape in 76Ge, the staggering parameter, defined as,
| (5) |
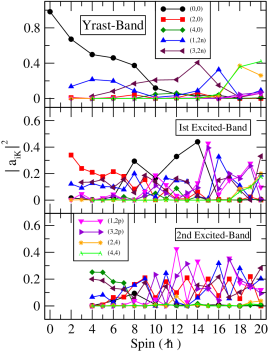
is plotted for the -band in Fig. 3(a). In the same figure we also provide the existing results of the SSM approach NY08 . It is evident from the figure that the experimental staggering parameter for the known energy levels is reproduced quite accurately by the TPSM calculations and also by the SSM study. The TPSM results indicate that above spin , the staggering amplitudes become smaller, and the reason for this is due to a considerable mixing of the 2-qp configurations with the -band at higher spins. In order to probe the mixing, the probabilities of various projected configurations are plotted in Fig. 4 for the yrast, the 1st-, and the 2nd-excited bands. The yrast band up to is dominated by the 0-qp configuration with , and above this spin the 2-neutron-aligned band is the dominant configuration. Above , the yrast band is primarily composed of 4-qp configurations. The 1st-excited band has the dominant 0-qp configuration until and, therefore, is the -band. However, above , the 1st-excited band has dominant component. The 2-nd excited band has dominant 0-qp configuration, referred to as -band, up to . Above this spin value, mixed structures are obtained. The state from the 0-qp configuration seems to become important along with some 2-qp configurations.
We have also evaluated quadrupole transition probabilities along the yrast band in the framework of TPSM JY01 . The standard effective charges ( and ) are used in the calculation for 76Ge, and later for all other nuclei studied in the present work. Experimentally, data for the lowest two transitions in the yrast band of 76Ge are available BE2 . In the lower panel of Fig. 3, the transition probabilities are plotted as a function of spin. The calculated transitions from the SSM approach NY08 are also displayed in the figure for comparison. It is seen from the figure that the TPSM results reproduce the lowest two known transitions quite well while the SSM values NY08 are somewhat under-predicted. The calculated transitions using the TPSM approach predict a drop at due to the crossing of the 2-quasineutron-aligned band at this spin value. Above , the transitions are predicted to increase rapidly with spin and then drop again at due to the alignment of two more quasiprotons. On the other hand, the SSM-predicted transitions depict an increase for the 2 transition, but above this spin value the SSM transitions show almost a constant behavior. Thus, there appears to be a discrepancy between the TPSM and SSM results for the transition probabilities and it is highly desirable to perform the lifetime measurements for the high-spin states in 76Ge. As quadrupole transition probabilities measure the collective behavior of a system, a correct description of it usually requires a sufficiently large model space YS09 .
| RExpt. | RTPSM | RDF | RSSM | |||
|---|---|---|---|---|---|---|
| 0.027 (3) | 0.05 | 0 | 0.04 | |||
| 0.029() | 0.04 | 0 | 0.06 | |||
| 1.34(4) | 1.62 | 0.46 | 0.93 | |||
| 6.3 | 1.35 | 1.0 | 1.29 | |||
| 0.038(14) | 0.19 | 0 | 0.48 |
In Table 3, a comparison is provided for the measured ratios of the transition strengths with TPSM predictions and also with results obtained using the SSM and DF model approaches YT13 . It is noted that both TPSM and SSM provide a reasonable description of the known transitions.
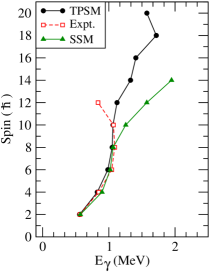
Aligned quasiparticles carry valuable information about the single particle structures in the neutron-rich mass region. To explore the alignment behavior in 76Ge, angular-momentum is displayed in Fig. 5 as a function of transition energy for the measured data, which is compared with the present TPSM results and the corresponding SSM ones. It is clearly seen that the three curves coincide with each other at low-spins, indicating an excellent agreement of both the calculations with experiment. However, it is noted that after , the SSM results deviate from the experimental ones for higher . The TPSM results, on the other hand, appear to give a better description of the data, although, it also cannot reproduce the data point at . For high spin states, TPSM predicts smaller , thus larger moments of inertia for this nucleus. The predicted TPSM behavior can be understood as the results of mixing of multi-qp states at high spins (see Fig. 4 and discussions), which continuously supplies angular momentum to the system as spin increases. There could be several reasons for the discrepancy noted at I=12 in Fig. 5. We consider the major reason could be due to constant pairing approximation used in the present TPSM approach. The BCS equations are solved for the ground-state and same pairing solution obtained is employed for all the states. This is clearly a crude approximation for high-spin state as it is known that pairing correlations are reduced for these states.
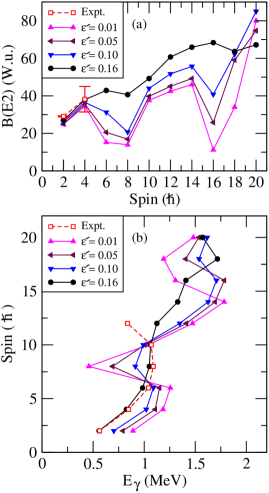
In order to investigate the importance of the triaxiality on the high-spin properties in 76Ge, the spin-dependence of transition probabilities and the transition energies are plotted in Fig. 6 for varying values of . In the upper panel, for all values of , show drops at about and 16 corresponding to band-mixings. However, for lower values of , substantial drops indicate more sudden changes in the wave functions as compared to the case of . The angular-momentum plot against in the lower panel of Fig. 6 depicts sharp backbends for lower values of , again due to sharper band-crossings. For higher values of , angular-momentum plot shows a smooth upward trend and for the behavior agrees with the experimental data, corresponding to the triaxiality parameter .
We would like to add that successful application of the DF model for 76Ge to describe the observed band YT13 favors the picture of a rigid- deformation for this system. Nevertheless, this model is clearly an over-simplified approach. It has been pointed out YK00 ; YS08 that the underlying physical picture of generating -vibration in deformed nuclei, suggested in the framework of TPSM, is analogous to the classical picture of Davydov and Filippov AS58 , yet TPSM is a fully microscopic method. It is interesting to see that both shell models (SSM and TPSM), though starting from quite different bases (spherically symmetric vs. triaxially deformed) give nearly identical results for the low-lying states of 76Ge, as seen in Figs. 3 and 5, as well as Table 3. Deviations of the results of TPSM from SSM are predicted for high-spin states (Fig. 5). The extension of measurements to higher spin is highly desirable as this will shed light on the limitations of the SSM and the TPSM approaches.
IV Results and discussions of the neighboring nuclei
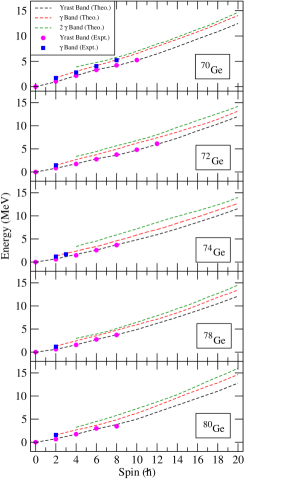
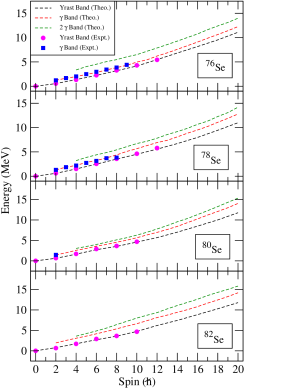
It has been pointed out in ref. YT13 that 76Ge is a unique example in this mass region that depicts a rigid -deformation with the staggering phase of the -band in conformity with the DF model. All other nuclei in the neighborhood have staggering phase opposite to that 76Ge and are categorized as -soft nuclei. It is, therefore, quite interesting to study neighboring nuclei, as well, in order to probe the mechanisms behind the opposing staggering phase of 76Ge in relation to its neighbors. To have a complete overview for the mass region, we have performed extensive calculations for other even-even Ge-isotopes, 70,72,74,78,80Ge, as well as for some Se- isotopes, 76,78,80,82Se. For these calculations, the axial deformations are taken from Ref. Raman (converted from to by multiplying by 0.95 factor) and the values are listed in Table 1. The values for , given also in Table 1, are chosen in such a way that the observed band head of the band is reproduced. In a few cases where the -band has not been observed, the of the neighboring nucleus is adopted. The interaction strengths in Eqs. (2) and (4) are kept the same as in the 76Ge calculation. In Figs. 7 and 8, the calculated band energies for these nuclei are compared with the available experimental data. The results clearly indicate that TPSM approach also provides a good description for these nuclei apart from 76Ge.
We shall now turn to the discussion of the staggering phase of the nuclei depicted in Figs. 7 and 8 in relation to 76Ge. First of all we would like to mention that the model space in TPSM is constructed from a triaxially-deformed basis with a given set of deformation parameters shown in Table 1. There are no explicit phonon or vibrational degrees of freedom in the model. Naively, a model based on a fixed triaxial deformation is of the kind of Davydov and Filippov model AS58 . However, the TPSM is a fully microscopic theory, and fixed deformations are only used for construction of basis states. It is important to note that unlike the phenomenological asymmetric rotor model AS58 , our results depend not only on the deformation parameters but also on the detailed microscopic isotope-dependent shell filling, and more importantly, on the configuration mixing of the various quasiparticle states YK00 ; YS08 . We would also like to remind here that in the spherical shell model approach, although, starting from a bare spherical basis, it can equally describe the deformed nuclei as well.
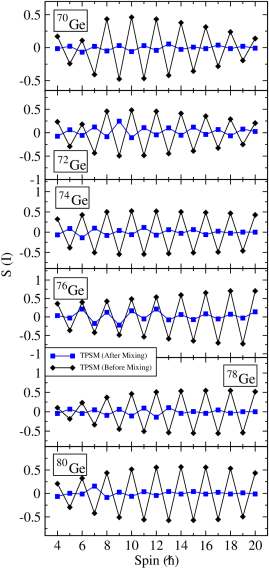
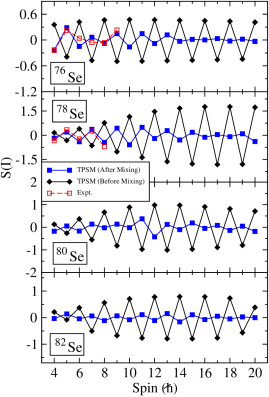
The theoretical results of staggering parameter (see Eq. (5)) for Ge- and Se-isotopes are plotted in Figures 9 and 10 before and after mixing of configurations. What is plotted in Figs. 9 and 10 are the full TPSM results after mixing, as shown in Figs. 7 and 8, and those for the projected 0-qp state with [labeled in Fig. 1 as (2,0)] only. The latter represents the major component of the band YK00 . The comparison is made systematically for the Ge and Se isotopes, and therefore, one may see the effect of isotope-dependent shell-filling.
It is noted from Figs. 9 and 10 that before configuration mixing, the calculated (in black diamonds) show a rather similar spin-dependent behavior for all the ten nuclei under consideration. In particular, all of them have the same staggering phase in . However, the results turn out to be extremely interesting after a full mixing of quasiparticle configurations shown in Eq. (1). After the configuration mixing, only the staggering phase of the (in blue squares) for 76Ge remains unchanged while all other nuclei depict an opposite phase as compared to 76Ge. We may thus conclude that the staggering pattern of is determined by the configuration mixing, which is isotope-dependent. A strong mixing of the configurations in the TPSM basis (1) can lead to modifications in the nuclear shape, as shown in Figs. 9 and 10, from a rigid triaxial rotor to the one that is soft in deformation when interpreted in terms of two extreme phenomenological models of -rigid of Davydov and Flippov and -soft of Wilets and Jean.
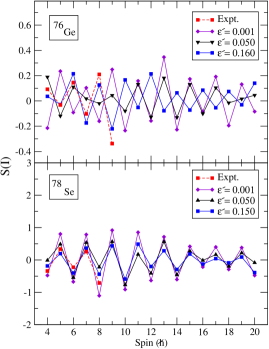
In order to gain further insight on the above results, we have calculated the staggering parameter as a function of , with the results displayed in Fig. 11. These results are obtained after the configuration mixing with varying triaxial deformation in the Nilsson Hamiltonian that generate the intrinsic basis. It is seen that for 76Ge, the experimentally-observed phase of the staggering is reproduced only for a large value of . In contrast, for all other isotopes the phase is independent of , with 78Se as an illustrative example in Fig. 11.
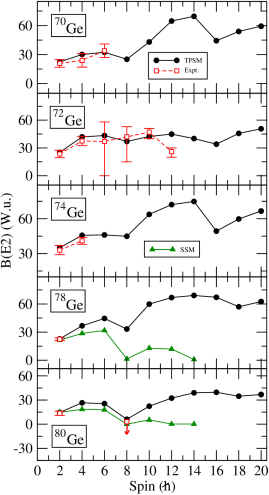
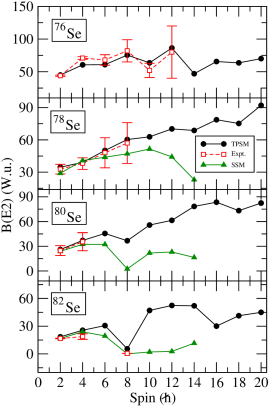
We have also calculated the values along the yrast band for 70,72,74,78,80Ge and 76,78,80,82Se, and compared them with available experimental data in Figs. 12 and 13. The calculated s from the SSM approach NY08 are also displayed in the figures for comparison. As is evident from these figures, the TPSM calculations describe the known experimental values quite nicely. The SSM calculation NY08 for 78,80Ge and 78,80,82Se, although, reproduce well the existing experimental data, however, as in the 76Ge case, the SSM transitions depict an increase for low spins, but drop significantly at high spins. In particular, above the SSM transitions show a completely different behavior as compared to the TPSM calculation which, in general shows an increasing trend toward higher spins. There appears to be a major discrepancy between the TPSM and SSM results for the transition probabilities in high-spin states for all the nuclei studied in the present work.
| 76Ge | 78Se | |
|---|---|---|
| 5.39 | 3.59 | |
| 5.78 | 0.70 | |
| 4.55 | 1.84 | |
| 13.38 | 36.54 | |
| 8.60 | 5.04 | |
| 1.66 | 0.26 | |
| 0.21 | 0.07 | |
| 0.09 | 0.34 | |
| 5.76 | 0.50 | |
| 2.35 | 0.65 | |
| 33.26 | 26.29 | |
| 9.15 | 6.14 | |
| 0.23 | 0.51 | |
| 20.90 | 16.76 | |
| 9.27 | 3.13 | |
| 7.05 | 5.74 | |
| 10.41 | 9.24 | |
| 7.65 | 2.52 | |
| 6.84 | 7.62 | |
| 7.87 | 4.82 | |
| 6.50 | 9.48 | |
| 3.47 | 6.56 | |
| 4.14 | 7.84 | |
| 5.13 | 9.67 | |
| 0.11 | 2.39 | |
| 2.27 | 7.71 | |
| 4.15 | 6.62 | |
| 0.19 | 1.04 | |
| 0.29 | 4.91 | |
| 0.09 | 4.96 | |
| 0.81 | 0.69 | |
| 0.36 | 2.56 | |
| 1.25 | 4.86 | |
| 1.73 | 1.25 | |
| 0.19 | 0.94 | |
| 1.88 | 5.30 | |
| 2.57 | 1.24 |
In Table 4, we present the calculated inter-band B(E2) values that link the band to the ground band. An early example of a similar TPSM calculation can be found in Ref. Pla02 . We give all the possible linking transitions for the low-lying states in 76Ge, together with those for 78Se as an illustrative example. It will be quite interesting to compare these values with the results from other models, for instance, the O(6) limit of the Interacting Boson Model CB85 ; SOG89 .
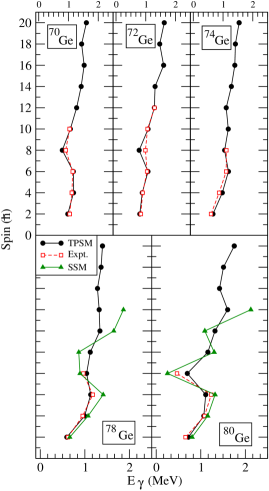
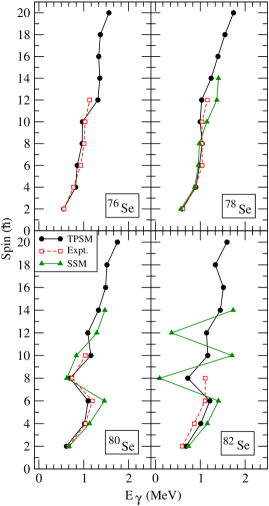
Finally, in Figs. 14 and 15, experimentally-known angular-momenta are displayed as functions of transition energy for 70,72,74,78,80Ge and 76,78,80,82Se, which are compared with the present TPSM results and the corresponding SSM ones NY08 . It is clearly seen that both theoretical calculations describe the known data very well. Nevertheless, it is observed, as in the case of 76Ge, discussed earlier that roughly above , the TPSM and SSM results deviate from each other for higher spin states. The predicted SSM values show pronounced zigzag pattern in the curves while the TPSM results appear more smoother.
V Summary
To summarize, the recently reported experimental measurement for 76Ge YT13 suggested that this nucleus may be a rare example of a nucleus exhibiting a rigid deformation in its low-lying states. Our microscopic calculations using the multi-quasiparticle triaxial projected shell model support this inference. By studying various physical quantities, it is shown that in order to describe the data accurately for both the yrast and -vibrational bands in 76Ge, a fixed triaxial deformation parameter is required for the TPSM calculation, which is consistent with that of the DF model YT13 . The TPSM results are discussed closely with the experimental observations and also compared with the previous spherical shell model calculations NY08 . Furthermore, experimental identification of the - band, predicted in the present work for this -rigid nucleus, would be very interesting.
To further demonstrate that the TPSM model with the same parameters as those of 76Ge is also applicable to the neighboring nuclei, we have made a systematic investigation for 70,72,74,78,80Ge and 76,78,80,82Se, and discussed the results. It has been demonstrated that configuration mixing of various quasiparticle states can result in a dynamical change for a nucleus from being a -rigid like to a -soft type when interpreted in terms of the two phenomenological models of -rigid of Davydov and Flippov and -soft of Wilets and Jean. The odd-even staggering phase of the -band is quite opposite in these two models and has been proposed to be an indicator of the nature of the -deformation. What we have shown using the microscopic TPSM model is that the configuration mixing can lead to a transition from -rigid to -soft phases, at least, for nuclei studied in the present work. It remains to be explored whether similar observation is valid for other regions as well.
The 76Ge nucleus belongs to the group of a few candidates where neutrinoless double- decay may be observed. In this context, we note that the recent beyond-mean-field calculations of nuclear matrix elements for neutrinoless double- decay, based on the energy density functional method using the Gogny D1S functional, assumed axial symmetry for the 76Ge shape RM10 . As the nuclear matrix elements serve an important link between -decay observations and the neutrino mass EV02 , it remains to be demonstrated what modifications triaxial mean-field deformation will make in the evaluation of the nuclear matrix-elements.
VI Acknowledgement
Research at Shanghai Jiao Tong University was supported by the National Natural Science Foundation of China (No. 11135005) and by the 973 Program of China (No. 2013CB834401).
References
- (1) A. Bohr and B. R. Mottelson, Nuclear Structure, Vol. II (Benjamin Inc., New York, 1975).
- (2) J. A. Sheikh and K. Hara, Phys. Rev. Lett. 82, 3968 (1999).
- (3) S. W. Ødegård, G. B. Hagemann, D. R. Jensen, M. Bergström, B. Herskind, G. Sletten, S. Törmänen, J. N. Wilson, P. O. TjØm, I. Hamamoto, K. Spohr, H. Hübel, A. Görgen, G. Schönwasser, A. Bracco, S. Leoni, A. Maj, C. M. Petrache, P. Bednarczyk, and D. Curien, Phys. Rev. Lett. 86, 5866 (2001).
- (4) G. Schönwaßer, H. Hübel, G.B. Hagemann, P. Bednarczyk, G. Benzoni, A. Bracco, P. Bringel, R. Chapman, D. Curien, J. Domscheit, B. Herskind, D. R. Jensen, S. Leoni, G. Lo Bianco, W. C. Ma, A. Maj, A. Neußer, S. W. Ødegård, C. M. Petrache, D. RoØbach, H. Ryde, K. H. Spohr, A. K. Singh, Phys. Lett. B 552, 9 (2003).
- (5) D. J. Hartley, R. V. F. Janssens, L. L. Riedinger, M. A. Riley, A. Aguilar, M. P. Carpenter, C. J. Chiara, P. Chowdhury, I. G. Darby, U. Garg, Q. A. Ijaz, F. G. Kondev, S. Lakshmi, T. Lauritsen, A. Ludington, W. C. Ma, E. A. McCutchan, S. Mukhopadhyay, R. Pifer, E. P. Seyfried, I. Stefanescu, S. K. Tandel, U. Tandel, J. R. Vanhoy, X. Wang, S. Zhu, I. Hamamoto, and S. Frauendorf, Phys. Rev. C 80, 041304(R) (2009).
- (6) A. S. Davydov and G. F. Filippov, Nucl. Phys. 8, 237 (1958).
- (7) L. Wilets and M. Jean, Phys. Rev. 102, 788 (1956).
- (8) T. Otsuka and M. Sugita, Phys. Rev. Lett. 59, 1541 (1987).
- (9) N. V. Zamfir and R. F. Casten, Phys. Lett. B 260, 265 (1991).
- (10) Y. Toh, C. J. Chiara, E. A. McCutchan, W. B. Walters, R. V. F. Janssens, M. P. Carpenter, S. Zhu, R. Broda, B. Fornal, B. P. Kay, F. G. Kondev, W. Krölas, T. Lauritsen, C. J. Lister, T. Pawlat, D. Seweryniak, I. Stefanescu, N. J. Stone, J. Wrzesin̈ski, K. Higashiyama, and N. Yoshinaga, Phys. Rev. C 87, 041304(R) (2013).
- (11) E. A. McCutchan, D. Bonatsos, N. V. Zamfir, and R. F. Casten, Phys. Rev. C 76, 024306 (2007).
- (12) N. Yoshinaga, K. Higashiyama, and P. H. Regan, Phys. Rev. C 78, 044320 (2008).
- (13) J. A. Sheikh, G. H. Bhat, Y. Sun, G. B. Vakil, and R. Palit, Phys. Rev. C 77, 034313 (2008).
- (14) J. A. Sheikh, G. H. Bhat, R. Palit, Z. Naik, and Y. Sun, Nucl. Phys. A 824, 58 (2009).
- (15) J. A. Sheikh, G. H. Bhat, Y.-X. Liu, F.-Q. Chen, and Y. Sun, Phys. Rev. C 84, 054314 (2011).
- (16) G. H. Bhat, J. A. Sheikh, Y. Sun, U. Garg, Phys. Rev. C 86, 047307 (2012).
- (17) F.-Q. Chen, Y. Sun, P. M. Walker, G. D. Dracoulis, Y. R. Shimizu, J. A. Sheikh, J. Phys. G 40, 015101 (2013).
- (18) Y. Sun, K. Hara, J. A. Sheikh, J. G. Hirsch, V. Velazquez, and M. Guidry, Phys. Rev. C 61, 064323 (2000).
- (19) Z.-C. Gao, Y.-S. Chen, and Y. Sun, Phys. Lett. B 634, 195 (2006).
- (20) J. A. Sheikh, G. H. Bhat, Y. Sun, and R. Palit, Phys. Lett. B 688, 305 (2010).
- (21) P. Ring and P. Schuck, The Nuclear Many-Body Problem (Springer, New York, 1980).
- (22) K. Hara and Y. Sun, Int. J. Mod. Phys. E 4, 637 (1995).
- (23) S. G. Nilsson, C. F. Tsang, A. Sobiczewski, Z. Szymanski, S. Wycech, C. Gustafson, I. Lamm, P. Moller and B. Nilsson, Nucl. Phys. A 131, 1 (1969).
- (24) Y. Sun and J. A. Sheikh, Phys. Rev. C 64, 031302 (2001).
- (25) R. Palit, J. A. Sheikh, Y. Sun, H. C. Jain, Nucl. Phys. A 686, 141 (2001).
- (26) L. Guo, J. A. Maruhn, and P.-G. Reinhard, Phys. Rev. C 76, 034317 (2007).
- (27) J. A. Sheikh, Y. Sun, and R. Palit, Phys. Lett. B 507, 115 (2001).
- (28) R. Lecomte, M. Irshad, S. Landsberger, G. Kajrys, P. Paradis, and S. Monaro, Phys. Rev. C 22, 2420 (1980).
- (29) Y. Sun, Y.-C. Yang, H.-L. Liu, K. Kaneko, M. Hasegawa, and T. Mizusaki, Phys. Rev. C 80, 054306 (2009).
- (30) Y. Sun, G.-L. Long, F. Al-Khudair, and J. A. Sheikh, Phys. Rev. C 77, 044307 (2008).
- (31) S. Raman, C. H. Malarkey, W. T. Milner, C. W. Nestor, Jr., and P. H. Stelson, Atom. Data Nucl. Data Tables 36, 1 (1987).
- (32) J. K. Tuli, Nucl. Data Sheets 103, 389 (2004).
- (33) D. Abriola and A. A. Sonzogni, Nucl. Data Sheets 111, 1 (2010).
- (34) B. Singh and A. R. Farhan, Nucl. Data Sheets 107, 1923 (2006).
- (35) A. R. Farhan and B. Singh, Nucl. Data Sheets 110, 1917 (2009).
- (36) J. K. Tuli, Nucl. Data Sheets 98, 209 (2003).
- (37) B. Singh, Nucl. Data Sheets 105, 223 (2005).
- (38) S. Rab, Nucl. Data Sheets 63, 1 (1991).
- (39) R. Lecomte, M. Irshad, S. Landsberger, G. Kajrys, P. Paradis, and S. Monaro, Phys. Rev. C 22, 2420 (1980).
- (40) T. Hayakawa, Y. Toh, M. Oshima, A. Osa, M. Koizumi, Y. Hatsukawa, Y. Utsuno, J. Katakura, M. Matsuda, T. Morikawa, M. Sugawara, H. Kusakari, and T. Czosnyka, Phys. Rev. C 67, 064310 (2003).
- (41) R. Schwengner, Döiring, L. Funke, P. Kemnitz, E. Will, A. E. Sobov, A. D. Efimov, M. F. Kudojarov, I. Kh. Lemberg, A. S. Rassadin, and I. N. Chugunov, Z. Phys. A 326, 287 (1987).
- (42) E. Padilla-Rodal, A. Galindo-Uribarri, C. Baktash, J. C. Batchelder, J. R. Beene, R. Bijker, B. A. Brown, O. Castańos, B. Fuentes, J. Gomez del Campo, P. A. Hausladen, Y. Larochelle, A. F. Lisetskiy, P. E. Mueller, D. C. Radford, D. W. Stracener, J. P. Urrego, R. L. Varner, and C.-H. Yu, Phys. Rev. Lett. 94, 122501 (2005).
- (43) A. Makishima, M. Asai, T. Ishii, I. Hossain, M. Ogawa, S. Ichikawa, and M. Ishii, Phys. Rev C 59, R2331 (1999).
- (44) K.-H. Speidel, N. Benczer-Koller, G. Kumbartzki, C. Barton, A. Gelberg, J. Holden, G. Jakob, N. Matt, R. H. Mayer, M. Satteson, R. Tanczyn, and L. Weissman, Phys. Rev. C 57, 2181 (1998).
- (45) P. Boutachkov, A. Aprahamian, Y. Sun, J. A. Sheikh, and S. Frauendorf, Eur. Phys. J. A 15, 455 (2002).
- (46) R. F. Casten and P. von Brentano, Phys. Lett. B152, 22 (1985).
- (47) M. Sugita, T. Otsuka, and A. Gelberg, Nucl. Phys. A 493, 350 (1989).
- (48) T. R. Rodríguez and G. Martínez-Pinedo, Phys. Rev. Lett. 105, 252503 (2010).
- (49) S. R. Elliott and P. Vogel, Annu. Rev. Nucl. Part. Sci. 52, 115 (2002).