Inferring properties of small convective cores in main-sequence solar-like pulsators
Abstract
This work concerns the study of the properties of convective cores in main-sequence models of solar-like pulsators and what information they may hold about stellar ages. We verified that the maximum absolute frequency derivative of particular combinations of frequencies, which we name ‘the slopes’, provides information on the relative size of the discontinuity in the sound-speed profile at the border of the convectively mixed region. Since the latter is related to the evolutionary state of stars, we show that for models with masses above , it may be possible to estimate the fraction of stellar main-sequence evolution from the slopes. Moreover, for models with masses below we verified that it may be possible to use the slopes to discriminate against models with small amounts of core overshoot.
1 Introduction
Asteroseismology is a powerful technique that can be used to obtain information about the internal structure of pulsating stars through the analysis of their pulsation spectra.
Stars with masses above 1.1 may develop a convective core at some stage during their main-sequence evolution. As the star evolves, the hydrogen abundance is reduced uniformly throughout the convective core causing an abundance discontinuity at the border of the convectively mixed region. This sharp variation causes a discontinuity in the sound-speed profile which, in turn, imprints a signature on the star’s oscillation frequencies, . Here, represents the degree of the mode and its radial order.
The following combination of frequencies was shown to be capable of isolating this signature (Cunha & Metcalfe, 2007; Cunha & Brandão, 2011):
| (1) |
where and is the large frequency separation. Moreover, Cunha & Brandão (2011) showed that the frequency derivative of this diagnostic tool can potentially be used to infer the amplitude of the relative sound-speed variation at the edge of the growing convective core, , with being the radial position at which the discontinuity in the sound speed occurs.
The modes required to construct the diagnostic tool may not be always available from observations. Hence, the following diagnostic tools may be preferred as they also probe the inner regions of stars (Roxburgh & Vorontsov, 2003; Gough, 1983),
| (2) |
and the respective ratios defined as
| (3) |
Note that contrary to , the three diagnostic tools in Eq. (3) do not isolate the above mentioned signature but they are still strongly affected by it. In practice, regarding the two diagnostic tools and , we consider them together, denoting the concatenation of the two, appropriately ordered in frequency, by , and the corresponding ratios by .
Since convection implies chemical mixing, the evolution of stars harbouring a convective core is greatly influenced by the presence and the properties of the convective core. In this work we aimed at finding a relation between the frequency derivatives of the diagnostic tools, computed for a set of stellar models considering a large parameter space, and the relative sound-speed variation at the border of the convectively inner region for the corresponding models. Moreover, we analysed the potential of this work concerning the inference of stellar ages.
2 Method
2.1 Stellar models
To compute the stellar evolutionary tracks and the model’s interior we used the ‘Aarhus STellar Evolution Code’ (ASTEC, Christensen-Dalsgaard, 2008a). The input parameters used to compute the models are shown in Table 1 and the input physics that we used in this work is described in Brandão et al. (2011). We then considered 12 models along the main-sequence phase. For these models we computed their oscillation frequencies using the Aarhus adiabatic oscillation code (ADIPLS, Christensen-Dalsgaard, 2008b). The computed frequencies were used to calculate the diagnostic tools , and (cf. Eq. (1) and Eq. (3)) and their frequency derivatives (see Section 2.2).
| Parameter | Grid I | Grid II |
|---|---|---|
| 1.00 - 1.6 (0.1 steps) | 1.00 - 1.6 (0.1 steps) | |
| 0.1727 | 0.058, 0.4816 | |
| 0.278 | 0.255, 0.340 | |
| 1.8 | 1.8 | |
| 0.0 - 0.2 (0.1 steps) | 0.1 |
2.2 Slopes
In the case of stars with a convective core we expect that the frequency derivatives of the diagnostic tools taken at their maximum absolute value are a measure of (Cunha & Brandão, 2011).
We introduce here a new quantity , which we shall name ‘slope’, which is a measure of the frequency derivative of a diagnostic tool ‘i’, at its maximum absolute value. The slope is given by the linear coefficient obtained from a linear least-squares fit performed to the 10 frequencies of modes of consecutive radial orders, , centred on . corresponds to the radial order of the frequency at which the maximum absolute value of the frequency derivative is placed.
Note that, depending on the properties of the models, the slope may be measured in a frequency range that is above the acoustic cut-off frequency, (i.e., the maximum frequency such that acoustic waves are expected to be contained within the star).
The error associated with the slope computed for each diagnostic tool was estimated for some of the models within our grids with different values of the mass, input physics, and . For these models we randomly generated 10 000 sets of model frequencies within the error, assuming a relative error of for each individual frequency. For each generation, we computed the slopes. We then computed the mean of the 10 000 values obtained for the slopes and the standard deviation was considered to be our error estimation for .
3 Results
3.1 Relation between and
Fig. 1 a), b) and c) show, respectively, the relation between the absolute value of the slopes computed for the three diagnostic tools , , and , and the relative amplitude of the discontinuity in the squared sound speed.
As anticipated from the work of Cunha & Brandão (2011), there is a strong dependence of on . Nevertheless, that relation deviates from linear and shows significant dispersion, particularly for larger values of . In fact, for the younger stars with , the relation shown in panel a) of Fig. 1 was found not to depend significantly on the mass, core overshooting, or metallicity, at least for the physics that we considered in our set of models. However, at later stages a dependence of the relation on metallicity and overshoot emerges as the stars approach the Terminal Age Main Sequence (TAMS). The two diagnostic tools and , unlike , do not isolate the signature of the sharp structural variation in the sound speed. Nevertheless, when analysing the slopes of and we obtain results that are analogous to the ones previously mentioned for the diagnostic tool . The dispersion seen in Fig. 1 is significantly reduced if one considers a subset of models for which the slopes are measured between the frequency of maximum power, , and (green stars).
Our results demonstrate that it is possible, for particular stars, to have a measure of from the observed frequencies.
3.2 Relation between and
One would hope that the value derived for could be a diagnostic tool for the evolutionary state of the star. As a test, we inspected directly the relation between the slopes of the different diagnostic tools and the star’s fraction of evolution () along the main-sequence, where is the age of the star at a given evolutionary stage in the main-sequence and is the age of the star within the same evolutionary track but at TAMS.
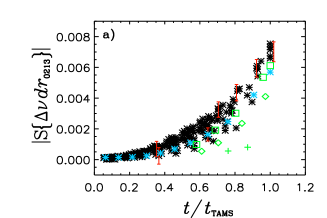
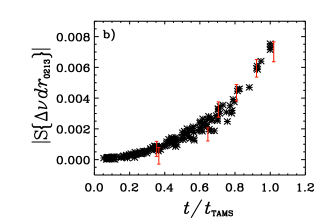
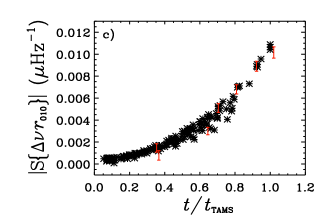
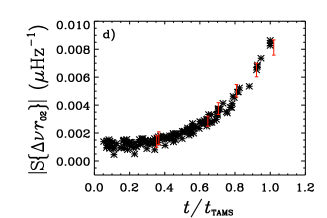
Fig. 2 a) shows, for all models with a convective core and for which the frequency region where the slope is computed is between and , the absolute value of the slopes of , , as a function of . From this figure, we see a large spread in the slopes at . This is due to the fact that models with , solar metallicity, and have a very small central convective region. As a result, substantial conversion of hydrogen into helium takes place outside the inner convective region and, in turn, the discontinuity in the chemical composition at the edge of that convective region is significantly smaller than in otherwise similar models with overshoot, at the latest stages of evolution.
4 Conclusions
We used stellar models of different masses, metallicities and convective-core overshoots, and at different evolutionary states in the main sequence, to study he slopes of the diagnostic tools , , and , where the slopes are defined as the frequency derivatives of these quantities taken at their maximum absolute value.
In this work we verified that for each evolutionary sequence, the absolute value of the slopes increases as the star evolves on the main-sequence. This increase is associated with the increase in the sound-speed discontinuity at the edge of the core. We also verified a strong correlation between the slopes and the relative amplitude of the discontinuity in the squared sound speed.
We observed a relation between the slopes and the fraction of stellar main-sequence evolution, . This relation is stronger for the diagnostic tools and than for . Also, the dispersion seen in these relations is significantly reduced when only models with masses are considered. We also note that for stars with masses , the dispersion seen in the slope versus relation was found to be directly related to the amount of core overshoot, which in these lower mass stars, with very small convective cores, influences the amplitude of the discontinuity in the mean molecular weight at fixed evolutionary stage. As a consequence, for these lower mass stars, it may be possible to use the slopes to discriminate against models with small amounts of core overshoot.
Acknowledgements.
I.M.B. acknowledges the support from the Fundação para a Ciência e Tecnologia (Portugal) through the grant SFRH/BPD/87857/2012. M.S.C. is supported by an Investigador FCT contract funded by FCT/MCTES (Portugal) and POPH/FSE (EC). I.M.B. and M.S.C. acknowledge the support from ERC, under FP7/EC, through the project FP7-SPACE-2012-312844. Funding for the Stellar Astrophysics Centre is provided by The Danish National Research Foundation (Grant DNRF106). The research is supported by the ASTERISK project (ASTERoseismic Investigations with SONG and Kepler) funded by the European Research Council (Grant agreement no.: 267864).References
- Brandão et al. (2011) Brandão, I. M., Doğan, G., Christensen-Dalsgaard, J., et al. 2011, A&A, 527, A37
- Christensen-Dalsgaard (2008a) Christensen-Dalsgaard, J. 2008a, Ap&SS, 316, 13
- Christensen-Dalsgaard (2008b) Christensen-Dalsgaard, J. 2008b, Ap&SS, 316, 113
- Cunha & Brandão (2011) Cunha, M. S. & Brandão, I. M. 2011, A&A, 529, A10
- Cunha & Metcalfe (2007) Cunha, M. S. & Metcalfe, T. S. 2007, ApJ, 666, 413
- Gough (1983) Gough, D. O. 1983, Physics Bulletin, 34, 502
- Roxburgh & Vorontsov (2003) Roxburgh, I. W. & Vorontsov, S. V. 2003, A&A, 411, 215