Multiwavelength modelling the SED of supersoft X-ray sources
I. The method and examples
Abstract
Radiation of supersoft X-ray sources (SSS) dominates both the supersof X-ray and the far-UV domain. A fraction of their radiation can be reprocessed into the thermal nebular emission, seen in the spectrum from the near-UV to longer wavelengths. In the case of symbiotic X-ray binaries (SyXBs) a strong contribution from their cool giants is indicated in the optical/near-IR. In this paper I introduce a method of multiwavelength modelling the spectral energy distribution (SED) of SSSs from the supersoft X-rays to the near-IR with the aim to determine the physical parameters of their composite spectra. The method is demonstrated on two extragalactic SSSs, the SyXB RX J0059.1-7505 (LIN 358) in the Small Magellanic Cloud (SMC), RX J0439.8-6809 in the Large Magellanic Cloud (LMC) and two Galactic SSSs, the classical nova RX J2030.5+5237 (V1974 Cyg) during its supersoft phase and the classical symbiotic star RX J1601.6+6648 (AG Dra) during its quiescent phase. The multiwavelength approach overcomes the problem of the mutual dependence between the temperature, luminosity and amount of absorption, which appears when only the X-ray data are fitted. Thus, the method provides an unambiguous solution. It was found that selection of the model (a blackbody or an atmospheric model) is not of crucial importance in fitting the global X-ray/IR SED. The multiwavelength modelling of the SED of SSSs is essential in determining their physical parameters.
keywords:
Stars: fundamental parameters – (Stars:) binaries: symbiotic – X-rays: binariesH I G H L I G H T S
-
•
New method of modelling the spectra of supersoft X-ray sources is introduced.
-
•
The method analyses the X-ray/near-IR spectral energy distribution.
-
•
The multiwavelength approach overcomes problems of modelling only the X-ray data.
-
•
More trustworthy fundamental parameters are derived.
1 Introduction
SSSs were first detected in the Magellanic Clouds with the EINSTEIN and EXOSAT satellites (e.g. Long et al., 1981; Seward & Mitchell, 1981; Pakull et al., 1985). Later observations with ROSAT verified their supersoft nature and showed that SSSs do not emit significantly at energies above keV (e.g. Greiner at el., 1991). Typical blackbody parameters of SSSs are a temperature of K and an effective radius of cm, which suggests their luminosities to be as high as . First thoughts about the nature of the SSSs included accretion onto black holes (Cowley et al., 1990) and neutron stars accreting above the Eddington rate (Greiner at el., 1991). Van den Heuvel et al. (1992) discussed difficulties with the neutron star/black hole model, and proposed the possibility that the supersoft X-ray emission is the result of steady nuclear burning of hydrogen accreted onto the surface of a massive white dwarfs (WDs). At present, this scenario represents the favoured model explaining the high energy output produced by these objects. Various phenomena associated with mass-accreting WDs in SSSs were reviewed by Kato (2010).
SSSs are understood as interacting binary systems consisting of an accreting compact object and a low-mass () main-sequence or slightly evolved late-type star. In special cases, the donor star can also be an M-type giant. The latter sources are often called as SyXBs. They were identified by finding a red giant counterpart to the primarily detected X-ray source (e.g. Davidsen et al., 1977; Masetti et al., 2006; Nespoli et al., 2010). On the other hand, many classical symbiotic stars have also been detected as X-ray sources (e.g. Mürset, Wolff & Jordan, 1997; Wheatley, Mukai, & de Martino, 2003; Stute, Luna & Sokoloski, 2011), as a natural consequence of their hot component properties, ( K, , e.g. Mürset et al., 1991; Skopal, 2005). Transient SSSs emerge also during nova outbursts, when the radius of the expanding WD pseudophotosphere gradually shrinks, radiates at higher temperature, and thus shifts the maximum of its energy distribution from the optical to soft X-rays (Gallagher & Code, 1974).
Determination of physical parameters of SSSs has been usually based solely on analyzing the X-ray data, which, however, cover only a very small fraction of their total spectrum. As a result, a good fit to the X-ray data was often achieved with very different sets of parameters and/or models. For example, Heise et al. (1994) obtained a satisfactory fit () to the ROSAT data of a stable SSS, SMP SMC 22, with a blackbody and an atmospheric model. However, the luminosity of their blackbody fit was more than a factor of 10 higher than that given by the atmospheric model. Recently, Mereghetti et al. (2010) studied this object with XMM-Newton, and also fitted successfully the X-ray data with both the blackbody and a NLTE atmospheric model. They did not find a significant difference between luminosities from both models, but the temperature of their preferred atmospheric model was only K, in contrast to K of the Heise et al. model. Satisfactory fits to X-ray observations, corresponding to very wide range of possible parameters, were found by many authors (e.g. Greiner et al., 1997; Asai et al., 1998; Ness et al., 2008; Sturm et al., 2011). Such the ambiguity in the inferred parameters is probably caused by fitting only a very small part of the total SSS spectrum.
Accordingly, in this paper I propose a method to determine the fundamental, , and parameters of SSSs by multiwavelength modelling their global SED throughout a very large, X-ray to near-IR, spectral range (Sect. 2). In Sect. 3 I apply the method to selected objects and introduce the results. Their discussion and summary are found in Sects. 4 and 5, respectively.
2 Multiwavelength model SED
2.1 Composite spectrum
Depending on the nature of a SSS, there can be a certain and variable amount of the circumstellar material (CSM) in the system, which is subject to ionization by the SSS radiation. For example, during the nebular stage of nova outburst, the ejected material reprocesses a fraction of the hot WD’s radiation into the nebular emission. In the case of SyXBs, the nebular component of radiation is produced also by the ionized part of the neutral wind from the cool giant. Thus the nebular component has to be included in the multiwavelength modelling the SED. In addition, the cool giant in SyXBs dominates the near-IR with a significant contribution to the optical. As a result, the composite spectrum emitted by a SSS, , can be generally expressed as a superposition of these three basic radiative components,
| (1) |
is the flux produced by the hot stellar (pseudo)photosphere of a SSS (i.e. its central star and/or disk), is the nebular component from the ionized CSM (i.e. that produced by thermal plasma) and is the contribution from the cool giant.
To achieve the aim of this paper, it means to disentangle the observed composite spectrum into its individual components, i.e. to determine their physical parameters. However, the radiation observed at the Earth have to be corrected for the attenuation by the ISM and CSM, placed between the source and the observer.
2.2 Corrections of the observed light
Assuming that no emission occurs on the path from the source to the observer, we can use the simplest solution of the radiative transfer equation to correct the observed SSS fluxes as
| (2) |
where is the spectrum emitted by the SSS, its angular radius scales it to that observed at the Earth () and the optical depth attenuates it along the line of sight. In the X-ray domain we consider attenuation of the light by b–f absorptions, while for wavelengths Å we consider selective extinction on dust particles as the only absorber within the interstellar matter (ISM). In the former case, is given by the absorption cross-section per atom, , of the element, , and the total number of atoms on the line of sight, . Thus, , where is the relative abundance and the total hydrogen column density [ cm-2] (i.e. through the ISM and CSM, see below). Then the optical depth, caused by the b–f absorptions within the X-ray domain, can be written in a convenient form as
| (3) |
where [cm2] is the total cross-section for photoelectric absorption per hydrogen atom (e.g. Cruddace et al., 1974). To correct the observed X-ray fluxes for absorptions I used the tbabs absorption model for ISM composition with abundances given by Wilms, Allen & McCray (2000) (e.g. ).
The minimum of is given by its ISM component, (ISM). The CSM component, (CSM), can be variable, depending on the activity of a SSS and/or its composition. For example, an increase of the mass-loss rate from a SSS leads to a decrease of the supersoft spectrum due to the b–f transitions, while the near-UV/optical spectrum brighten up throughout the f–b and f–f transitions, and vice versa. This effect is measured in some SSSs (see Paper II). A nice example is AG Dra, which shows a strict anticorrelation between the supersoft X-ray and near-UV/optical fluxes (Greiner et al., 1997; González-Riestra et al., 2008; Skopal et al., 2009). If a SSS contains a strong source of the neutral hydrogen (SyXBs), the amount of b–f absorptions on the line of sight can vary with the orbital phase, when viewing the hot accreting source throughout a different amount of the neutral stellar wind from the giant. An example here is SMC 3 (Kahabka, 2004) and the symbiotic binary 4 Dra (see Fig 6 of Wheatley, Mukai, & de Martino, 2003). The above-mentioned examples imply that the amount of absorption between the observer and a SSS can be variable due to its CSM component. Thus in the modelling the SED one has to consider that
| (4) |
Photons that are not capable of ionizing hydrogen are attenuated predominantly by scattering on the dust grains in the ISM. In this case the light attenuation is given by the extinction curve, (e.g. Cardelli et al., 1989), parametrized with the colour excess, , to the object. This correction to the observed fluxes, , for Å can be expressed as
| (5) |
where is the so-called ‘dereddened’ flux and the ratio of total to selective extinction (e.g. Wegner, 2003).
In the following sections, I will briefly introduce the radiative components of Eq. (1) as observed at the Earth, and will outline principles of the method of disentangling the composite continuum.
2.3 The hot stellar continuum
It is understood that the radiation from SSSs is produced by their (pseudo)photospheres, and thus it is of stellar nature. A good example is the supersoft X-ray radiation generated by the WD photosphere as measured from novae during their SSS phases (e.g. Gallagher & Code, 1974; Krautter et al., 1996). Also the supersoft X-ray radiation from AG Dra (the strongest source among classical symbiotics) was associated with the hot star photosphere (Greiner et al., 1997; Viotti et al., 2005), and later confirmed with the model SED by Skopal et al. (2009).
For the sake of simplicity and with respect to the current modelling the low-resolution supersoft X-ray data, the observed fluxes from the hot stellar source (i.e. the SSS) can be approximated with the blackbody radiation at a temperature , which is attenuated by b–f absorptions in the X-ray domain. Then, according to Eqs. (2) and (3), the observed fluxes from the SSS can be fitted with
| (6) |
where the angular radius of the SSS, , is given by its effective radius, (i.e. the radius of a sphere with the same luminosity) and the distance . Fitting parameters here are , and , which define the luminosity of the SSS as . If required, the blackbody fluxes in Eq. (6) can be replaced by a more sophisticated model of a hot stellar atmosphere or accretion disk.
2.3.1 from the Rayleigh scattering
Rayleigh scattering describes the absorption process, when an atom is excited to the intermediate state and is immediately stabilized by a transition to the same true bound state, re-emitting a photon of the same wavelength (see Fig. 1 of Nussbaumer et al., 1989). The effect is best observable for transitions from the ground state of hydrogen atom, i.e. around the lines of the hydrogen Lyman series, where it can be identified as a strong attenuation of the continuum. Its strength is therefore determined by the column density of neutral hydrogen between the emitting source and the observer, causing the optical depth in the continuum,
| (7) |
where [cm2] is the Rayleigh cross-section for scattering by hydrogen in its ground state (see Eq. (5) and Fig. 2 of Nussbaumer et al., 1989). The attenuation of the far-UV spectrum by Rayleigh scattering thus provides an independent estimate of . It measures exclusively the amount of neutral hydrogen within the ISM. From this point of view, derived from fitting the X-ray data can be larger by the CSM component than that obtained from fitting the Rayleigh attenuated continuum (cf. Eq. (4)). In the case, when a SSS does not produce any nebular emission (e.g. RX J0439.8-6809), values from both approaches should be equal.
For of a few cm-2, the effect of the Rayleigh attenuation creates an absorption core with the zero rest intensity and FWHM Å around the Ly- line. It is thus well measurable on medium/high resolution spectra (e.g. by the HST/GHRS and FUSE spectrograph), but hardly detectable on the low resolution IUE spectra, because of influence of other absorption effects and the presence of the geocoronal Ly- component. Here, an example is shown for RX J0439.8-6809 (Fig. 3, also Paper II).
2.4 The nebular continuum
The nebular component of radiation in the UV/optical continuum can be approximated by processes of recombination and thermal bremsstrahlung in the circumstellar material ionized by the SSS. In this case the energy distribution in the nebular continuum is determined by the total volume emission coefficient (), i.e. the sum of contributions from recombination and bremsstrahlung for considered ions (mostly H+, He+ and He++). Its profile depends on the electron temperature, , and is a function of the wavelength (e.g. Brown & Mathews, 1970). Thus, the observed nebular flux can be expressed as a simple scaling of the emission coefficient, i.e.,
| (8) |
According to the meaning of the coefficient, and assuming that and thus are constant throughout the nebula, the flux produced by the optically thin nebula (i.e. the second term in Eq. (1)), EM, where EM is the so-called emission measure. Using its definition, Eq. (8) can be expressed as
| (9) |
which determines the fitting parameter as the emission measure scaled by the distance. Further fitting parameter is the electron temperature . Selection of an appropriate emission coefficient depends on the properties of the nebula. To get the first estimate of the nebular parameters, contributions only from hydrogen plasma can be considered. Also it is difficult to separate contributions from the He I continuum on the IUE and HST spectra, because of a very similar profile of its recombination coefficients to that of H I (e.g. Brown & Mathews, 1970) and a small abundance. In the case of recognizable signatures of the He II continuum (e.g. a jump in emission at 2050 Å and a pronounced Paschen series of the HeII recombination lines), the emission coefficient should be used, with the possibility to estimate the abundance of He++ ions. Finally, it is reasonable to assume that the nebula is sufficiently dense ( cm-3), which excludes contributions due to the two-photon emission (e.g. Gurzadyan, 1997).
2.5 The giant contribution
If a SSS contains an M-type giant, its contribution usually rivals that from the nebula in the optical, but dominates the near-IR (see Figs. 2-22 of Skopal, 2005). Therefore, it is satisfactory to figure the observed SED of the giant by the broad-band photometric fluxes. With respect to a large difference in the SED between a simple blackbody and the true giant’s photosphere, it is suggested to approximate the observed fluxes from the giant, , with an appropriate synthetic spectrum, . Then we can write
| (10) |
where the angular radius of the giant (= ) scales its emitted spectrum to that observed at the Earth. The fitting parameters are the effective temperature and . These define the observed bolometric flux, (see Eq. (3) of Skopal, 2005) and thus the luminosity of the giant, .
2.6 The SED-fitting analysis
Having defined individual components of radiation in the composite spectrum (Eq. (1)), we can model the X-ray—IR fluxes, as observed at the Earth, with a function
| (11) |
whose terms are defined by Eqs. (6), (8) and (10). The fitted fluxes consist of the absorbed X-ray fluxes (Eq. (2)) and dereddened UV/IR fluxes (Eq. (5)). If applicable, it is convenient to subtract the observed fluxes from the giant, which simplifies the task. To find the best solution, a grid of models SED (11) is calculated for reasonable ranges of the fitting parameters (, , for the SSS and , for the nebula) to select that corresponding to the minimum of the function
| (12) |
where are observed fluxes of the continuum (i.e. the absorbed X-ray fluxes and dereddened UV/IR fluxes), is their number, are their errors and are the theoretical fluxes given by Eq. (11).
In the following section I demonstrate this multiwavelength SED-fitting analysis on four selected objects. Their list with the log of the used spectroscopic observations are found in Table 1. In all cases, typical values for flux deviations of % were adopted. Resulting parameters are introduced in Table 2 and the corresponding models are depicted in Figs. 1,2,4 and 5.
3 Application to selected SSS
3.1 The SMC symbiotic X-ray binary RX J0059.1-7505
Originally, this star was included in “A New Catalogue of Emission-Line Stars and Planetary Nebulae in the Small Magellanic Cloud” by Lindsay (1961) under the number 358. According to Sanduleak & Pesch (1981), LIN 358 has a late K or early M-type continuum, displaying a variable H emission. Later, on the basis of the optical observations, Walker (1983) found that the LIN 358 spectrum satisfies characteristics of a symbiotic star. Nussbaumer & Vogel (1995) analyzed the HST FOS spectra of LIN 358 and estimated its temperature within the range of K and the luminosity between 2 400 and 3 600 . Mürset et al. (1996), analyzing ultraviolet and optical spectroscopy and infrared photometry, derived the spectral type of the giant as mid K, its temperature to 4000 K, the luminosity of 5 500 and the radius of 150 . Using the Zanstra method, they estimated K, and for the hot component. Mürset, Wolff & Jordan (1997) found that the pointed ROSAT PSPC observations of RX J0059.1-7505 coincides in the position with the symbiotic star LIN 358. They classified its X-ray spectrum as an -type, i.e. with supersoft distribution. RX J0059.1-7505 is presented in the catalogue of Haberl et al. (2000) as a SSS.
Kahabka & Haberl (2006) observed RX J0059.1-7505 with XMM-Newton on 2003 November 16/17. Their blackbody fit to the supersoft component (0.13 – 1.0 keV) corresponded to the hot source temperature, K, its radius, and luminosity, for the total absorption parameterized with cm-2. The authors tried to extrapolate their X-ray flux distribution into the UV with the aim to compare their model to the HST observations (see their Fig. 4). The same observations were analyzed also by Orio et al. (2007), who obtained a blackbody model parameters, K, , , and cm-2. Their best fit with an atmospheric model corresponded to unrealistically high luminosity, within the (0.15 – 1.0) keV range only ( K, and cm-2). Applying the photoionization code CLOUDY to optical and ultraviolet IUE spectra, they estimated , K, which corresponds to . Their parameters of the nebular component of radiation implied the emission measure, cm-3.
| Date | Julian date | Region | Observatory | |
|---|---|---|---|---|
| yyyy/mm/dd | JD 2 4… | [nm] | [ks] | |
| RXJ0059.1-7505 (LIN 358) | ||||
| 2009/09/25 | 55099.5 | 3.1–8.4 | XMM-Newton1 | 32 |
| 2002/07/25 | 52480.5 | 92–119 | FUSE | 26.4 |
| 1995/03/20 | 49796.5 | 150–540 | HST | 2.5 |
| RXJ0438.8-6809 | ||||
| 1992/01/03 | 48626.5 | 1.7–6.9 | ROSAT2 | 2.7 |
| 1998/11/17 | 51135.5 | 115–316 | HST | 2.1 |
| 1995/10/15 | 50006.5 | 380–695 | La Silla, 3.6-m3 | 10.8 |
| RX J2030.5+5237 (V1974 Cyg) | ||||
| 1992/12/07 | 48964.5 | 1.24–4.13 | ROSAT4 | 2.9 |
| 1993/07/14 | 49183.5 | 1.24–4.13 | ROSAT4 | 2.3 |
| 1993/04/04 | 49082.3 | 115–198 | IUE | 0.87 |
| 1993/07/23 | 49192.4 | 190–335 | IUE | 1.5 |
| 1993/07/24 | 49192.5 | 115–198 | IUE | 1.5 |
| RX J1601.6+6648 (AG Dra) | ||||
| 1993/04/15 | 49093.5 | 3.5–11.5 | ROSAT5 | 2.5 |
| 2004/06/15 | 53172.0 | 3.1–6.9 | XMM-Newton6 | 12.4 |
| 2004/06/15 | 53172.0 | 212–291 | XMM-OM6 | 4.4 |
| 2005/06/11 | 53533.5 | 2.8–6.9 | XMM-Newton6 | 18.3 |
| 2005/06/11 | 53533.5 | 231 | XMM-OM6 | 14.2 |
| 2004/06/24 | 53181.0 | 100–108 | FUSE | 10.8 |
| 1979/09/25 | 44143.0 | 116–325 | IUE | 3.4 |
| 1993/04/09 | 49087.4 | 116–325 | IUE | 0.48 |
3.1.1 Multiwavelength model SED of RX J0059.1-7505
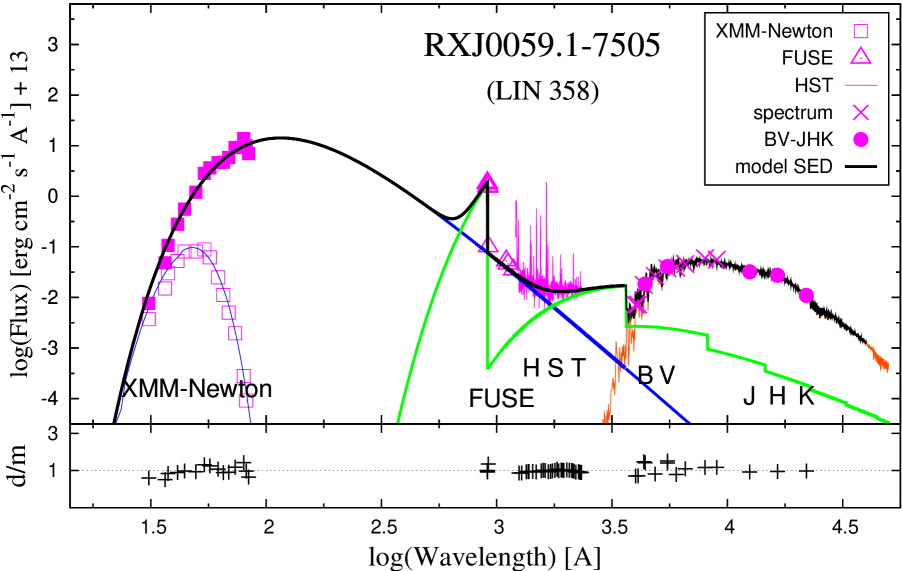
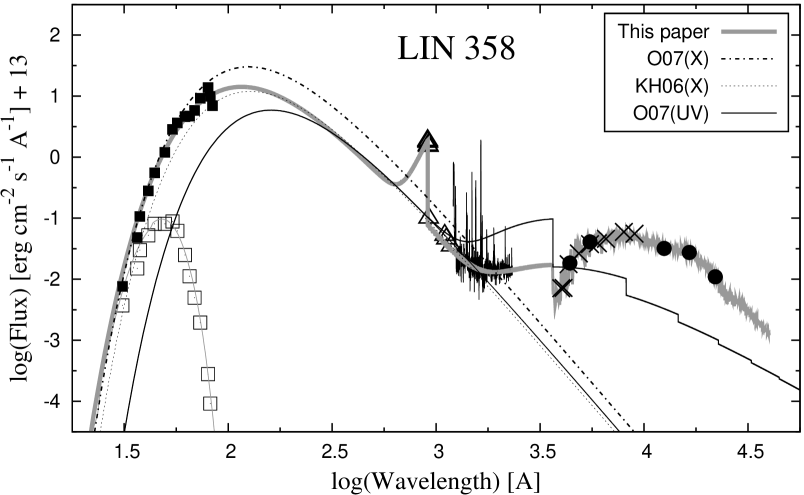
Spectroscopic observations used to model the SED of RX J0059.1-7505 cover the spectral range from the supersoft X-rays to the near-IR ( nm, Table 1). The supersoft X-ray fluxes, taken with XMM-Newton, were reconstructed from Fig. 4 of Kahabka & Haberl (2006). The ultraviolet spectra with FUSE (E9500501), HST FOS (Y2CQ0203T, Y2CQ0204T, Y2CQ0205T) and HST COS (LAAZ01010) were obtained from the satellite archives with the aid of the Multimission Archive at the Space Telescope Science Institute (MAST). These observations were supplemented with the photometric measurements published by Mürset et al. (1996). UV to IR data were dereddened with mag and the corresponding parameters were scaled to the distance of SMC, 60 kpc (Mateo, 1998).
It was possible to match the photometric flux-points with a synthetic spectrum calculated for K (selected from a grid of models made by Hauschildt et al., 1999), and scaled with , which corresponds to the bolometric flux, , and thus the luminosity , (i.e. absolute bolometric magnitude ). The value of gives the radius of the giant, . These parameters allow us to classify the cool giant in RX J0059.1-7505 as a K5 Ib supergiant.
After subtracting the contribution from the giant, I modelled 15 representative supersoft X-ray fluxes between 31 and 84 Å and 30 ultraviolet continuum flux-points between 1 250 and 2 330 Å by the function (see Eq. (11)) to determine its variables , , , and . The best model has the reduced (for 40 degrees of freedom), and is determined by the most probable fitting parameters, , K, cm-2, cm-5 and K, which yield , and cm-3.
Observations with FUSE were not used directly in the fitting procedure, because of large uncertainties of the faint continuum for different exposures. Therefore, I compared only a few selected mean fluxes from LiF2A (1087 – 1181 Å) channel spectrum to demonstrate the steep slope of the far-UV spectrum, where the SSS has a dominant contribution. Another very interesting feature of the FUSE spectrum is a strong Lyman jump in emission, which signals that the nebula is optically thin in the Lyman continuum. Its value is very sensitive to the electron temperature, which constrains its uncertainty only to K. However, the extinction curve is not well determined at this region (see Cardelli et al. (1989) and Sect. 2.2 of Skopal et al. (2006)). Therefore, I dereddened the data around 912 Å by multiplying them with a factor of 2.5, which places corrected fluxes for Å at the hot star model. Here I used the SiC1B channel spectrum (915 – 992 Å).
3.2 The LMC X-ray source RX J0439.8-6809
RX J0439.8-6809 is a bright SSS in the LMC, which was discovered in the ROSAT All-Sky-Survey during 1990 November 16–29. Following pointing observations, performed on 1992 January 3-rd, allowed its more detailed study (Greiner at el., 1994). Fitting the combined survey and pointing data with a blackbody spectrum, the authors derived an effective temperature of the source, eV ( K), absorbed with cm-2, which, as they noted, is in excellent agreement with the galactic column density towards RX J0439.8-6809 of cm-2. Greiner at el. (1994) also found that RX J0439.8-6809 was remarkably constant during its monitoring with ROSAT ( months), exhibiting only a few days X-ray variability. Van Teeseling et al. (1996) identified RX J0439.8-6809 with a very blue and faint (B = 21.5) object. They revealed that the steep profile of their optical spectrum corresponds to the Rayleigh-Jeans tail of the SSS component. Taking cm-2 they obtained acceptable blackbody fit to both the X-ray and the optical data with K, a radius cm and a luminosity . An additional interesting feature of the optical spectrum was the absence of any absorption or emission line. Schmidtke & Cowley (1996) confirmed the optical counterpart to the X-ray source by the photometry, and revealed a low-amplitude 0.1403 and 0.1637-day period in the V-band. Van Teeseling et al. (1997) investigated the nature of RX J0439.8-6809 and concluded that it is most probably an accreting double-degenerate binary with an orbital period of a few minutes. Based on the HST/STIS ultraviolet spectroscopy, Van Teeseling et al. (1999) estimated the neutral hydrogen column density to cm-2 by fitting the broad Ly- profile with a pure damping effect. They also performed a blackbody fit to the X-ray, UV and optical fluxes, corresponding to K, cm and for the distance of 50 kpc. Application of a more sophisticated NLTE model to the same observations, also yielded acceptable fits with similar parameters. Finally, a very good fit with a pure CO model (, K, ), the absence of long-term variability and the proximity of RX J0439.8-6809 to the theoretical carbon-burning main sequence, led the authors to speculate that RX J0439.8-6809 represents a completely new type of star.
3.2.1 Multiwavelength model SED of RX J0439.8-6809
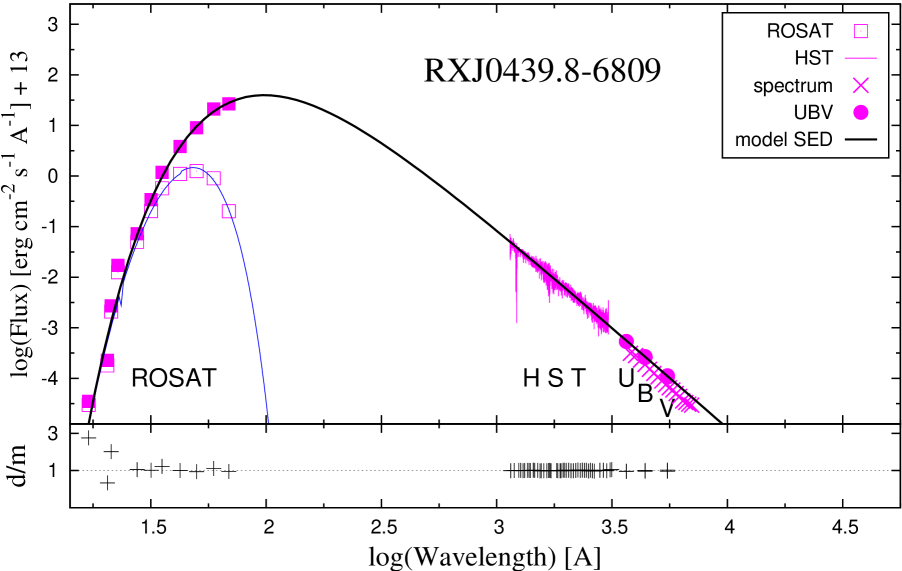
Observations used to model the SED of RX J0439.8-6809 cover the spectral range from the supersoft X-rays to the optical UBV flux-points ( nm). The supersoft X-ray fluxes were taken from Fig. 5 of Van Teeseling et al. (1999). The ultraviolet HST/STIS spectrum (O55G01010) was obtained from the satellite archive with the aid of the MAST. Spectroscopic observations were supplemented with the UBV broad-band photometry according to Schmidtke & Cowley (1996) and the catalog of Zaritsky et al. (2002) (U = 20.068, B = 21.361, V = 21.534). Ultraviolet and optical data were corrected for interstellar extinction with mag and the corresponding parameters were scaled to the distance of LMC, 49 kpc (Mateo, 1998).
Fitting a simple blackbody radiation to 61 selected fluxes (11 X-ray, 44 UV and 6 UBV fluxes) with the same weight, yielded K, cm-2 and , which corresponds to and . The resulting model SED with the used observations are shown in Fig. 2. The Planck curve matches the selected unabsorbed and dereddened fluxes with the reduced for 10% errors adopted for all fluxes, but with only , when enlarging errors to 20–30% in the first 3 fluxes at 17.0, 20.5 and 21.3 Å (see Fig. 5 of Van Teeseling et al., 1999). The optical spectrum of Van Teeseling et al. (1996) was not included in the fitting, because its continuum was a factor of 1.2 below the UBV fluxes that follow exactly the model of the UV spectrum. However, the steep slope of the optical spectrum is very similar to that given by the UBV flux-points (see Fig. 2).

According to the suggestion in Sect. 2.3.1., I matched the attenuated continuum around the Ly- line with the Rayleigh scattering process. The fit corresponds to cm-2 (see Fig. 3), which is equal to that derived independently from modelling the SED. This suggests that there is no CSM absorption component in the direction of RX J0439.8-6809, because the Rayleigh scattering measures only the ISM component. This result is consistent with the fact that there is no nebular component of radiation indicated in the spectrum of this SSS.
Modelling the SED of RX J0439.8-6809 represents the simplest case here presented. Its radiation dominates the entire observed spectrum (1.7–680 nm), which allows to determine unambiguously all the fitting parameters with relatively small uncertainties (Table 2).
3.3 Classical nova V1974 Cyg
The classical nova V1974 Cyg (Nova Cygni 1992, RX J2030.5+5237) was discovered by Collins (1992) on 1992 February 19.07 UT. It reached a peak visual magnitude of 4.5 on 1992 February 21.01 UT (Schmeer et al., 1992). It was classified as a moderately fast O-Ne-Mg nova with days (Chochol et al., 1993; Shore et al., 1993). The distance to the nova can be put to 1.8 kpc (Chochol et al., 1993; Paresce et al., 1995) and the colour excess = 0.36 (Austin et al., 1996).
V1974 Cyg was observed across the entire electromagnetic spectrum, from the -rays to the radio (see Austin et al., 1996, for a review). Extensive observations in the optical and ultraviolet wavelengths showed that the nova entered the nebular phase from 1992 April ( days after the optical maximum), and from 1992 September ( days) the nebular lines dominated its spectrum (e.g. Shore et al., 1993; Chochol et al., 1993; Barger et al, 1993).
Observations in the X-ray domain were carried out with the ROSAT satellite from 1992 April 22 to 1993 December 3. Krautter et al. (1996) analyzed first the X-ray observations. They found that a soft component ( keV) dominated the emitted energy during 255–511 days after the optical maximum (see their Fig. 1), and had all the characteristics of a SSS. Their blackbody models fitted well the measured SED of the soft X-ray component in the range of 0.2–1 keV. However, their best fits gave column densities of the order of several times cm-2, effective temperatures eV (i.e. 220600 – 302000 K), but totally unrealistic bolometric luminosities of several thousand of for a 1 WD and the distance of 1.7 kpc. Therefore, the authors judged these parameters as unreliable and suggested that results obtained from blackbody fits to the supersoft X-ray sources should be used with care. To satisfy theoretical calculations they adopted the Eddington luminosity and the temperature of K for the postnova WD in V1974 Cyg. The ROSAT spectra were reanalyzed by Balman et al. (1998), who compared them with hydrostatic LTE atmosphere models for a 1.2 WD. They determined its luminosity to be a factor of 2 below the Eddington one and its temperature to 590000 K (day 511), assuming cm-2.
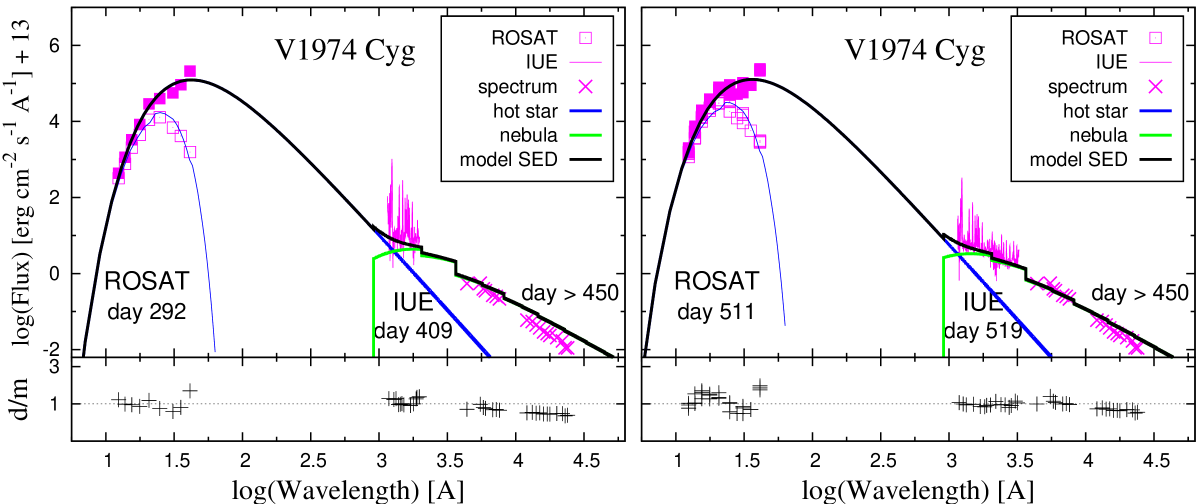
3.3.1 Multiwavelength model SED of V1974 Cyg
To demonstrate the multiwavelength modelling the SED for the classical nova V1974 Cyg, I reanalyzed its energy spectra made on day 292 and 511 presented in Fig. 4 of Krautter et al. (1996). As the SSS phase of V1974 Cyg lasted for a long time, from day 255 to 511 after the optical maximum, the X-ray data were complemented with observations in other wavelengths made during this period, being the nearest to day 292 and 511, respectively. In particular, the day 292 was complemented with the well exposed IUE spectra SWP47416(7) and the day 511 with SWP48219(20) and LWP25981(2) spectra. Some optical/near-IR fluxes were extracted from the ground-based spectroscopic observations of Rafanelli et al. (1995) from 1993 March 19 (day 393, nm) and of Wagner & DePoy (1996) from 1993 May 2 (day 438, nm). Finally, photometric flux-points were derived from observations published by Chochol et al. (1993). Due to a rich and very strong emission line spectrum of the nova, the magnitudes were corrected for emission lines to get fluxes of the real continuum (see Table 2 in Skopal, 2007). The total observed spectrum covers the range from 1.24 nm to 2400 nm. It was fitted by the function, (Eq. (11)). Fluxes at nm suffer with a systematic deviation with respect to the predicted model, so their errors were formally enlarged to 30%. The large value of the reduced results mainly from very uncertain measurements at the low energies of the X-ray spectrum (Krautter et al., 1996).
The resulting parameters are given in Table 2 and the observed and model SED are depicted in Fig. 4. The results are discussed in Sect. 4.
3.4 Classical symbiotic star AG Dra
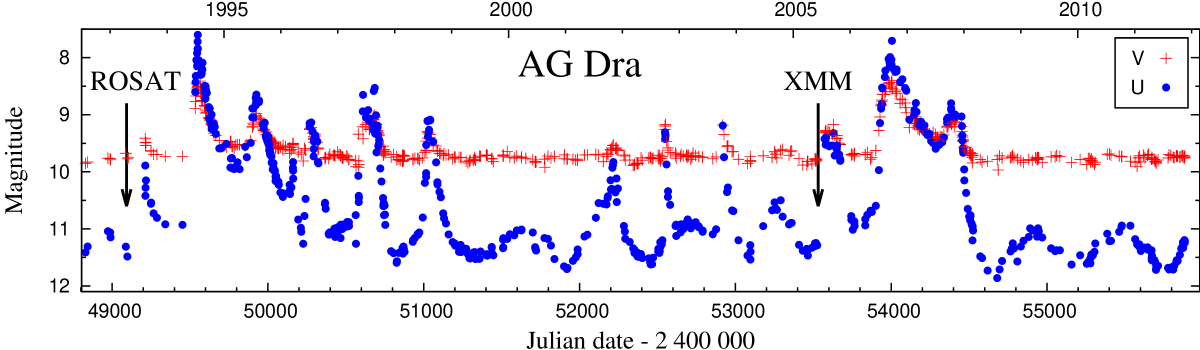
AG Dra (RX J1601.6+6648) is a classical symbiotic star. It is classified as a yellow symbiotic binary, because it comprises a K2 III giant (Mürset & Schmid, 1999) as the donor component. The accretor is a low mass WD accreting from the giant’s wind on a 549-day orbit (e.g. Fekel et al., 2000). The optical light curve of AG Dra shows numerous bursts with amplitude of 1–3 mag in , which are abandoned with large periods of quiescent phases (e.g. Meinunger, 1979; Leedjärv et al., 2004; Skopal et al., 2012). Modelling the UV/IR continuum, Skopal (2005) found a significant contribution from the nebula in the near-UV/optical that strengthens during outbursts. AG Dra is a halo binary system with a low orbital inclination (Schmid & Schild, 1997; González-Riestra et al., 2008), a low reddening ( mag, Birriel et al., 2000) and a low interstellar absorption ( cm-2, Anderson et al., 1981). These properties makes AG Dra the brightest system in the supersoft X-ray energies among other galactic symbiotics.
Therefore, AG Dra has been frequently observed by the X-ray satellites, (Einstein, EXOSAT, ROSAT, XMM-Newton, see Greiner et al., 1997; González-Riestra et al., 2008). Greiner et al. (1997) modelled the ROSAT PSPC observations during quiescent phase between 1992 April 16 to 1993 May 12. Using the blackbody model for fixed galactic value of cm-2, they obtained eV (168300 K) and . Analyzing the ROSAT data together with IUE and optical observations, they revealed an anticorrelation between the supersoft X-ray and the UV/optical fluxes. During the optical maxima (1994 and 1995) the X-ray flux decreased remarkably, while during the following quiescence it recovered to the pre-outburst value. The X-ray emission of AG Dra was reviewed and discussed by González-Riestra et al. (2008). They found that the anticorrelation between the X-ray and optical/UV emission appears to be a general feature of AG Dra radiation and is independent of the type of the outburst. They suggested that the WD radiation increases during outbursts, but is strongly absorbed by the circumstellar ionized gas. Modelling the X-ray—UV/optical continuum during different stages of the AG Dra activity, Skopal et al. (2009) suggested that the flux anticorrelation is caused by the enhanced wind from the hot star as it is indicated for symbiotic binaries during active phases (Skopal, 2006). The wind absorbs the supersoft X-ray photons via the b–f transitions, and via the f–b and f–f transitions enhances the nebular emission in the near-UV/optical domain.
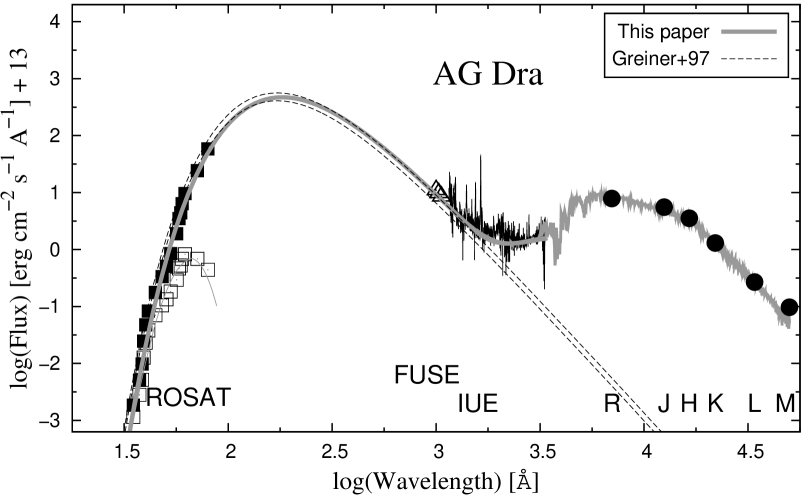
3.4.1 Multiwavelength model SED of AG Dra
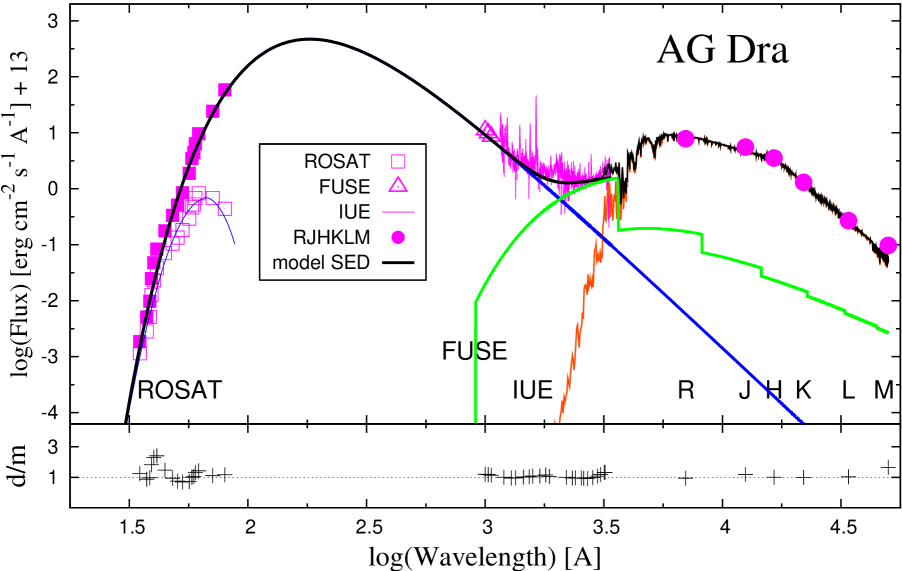
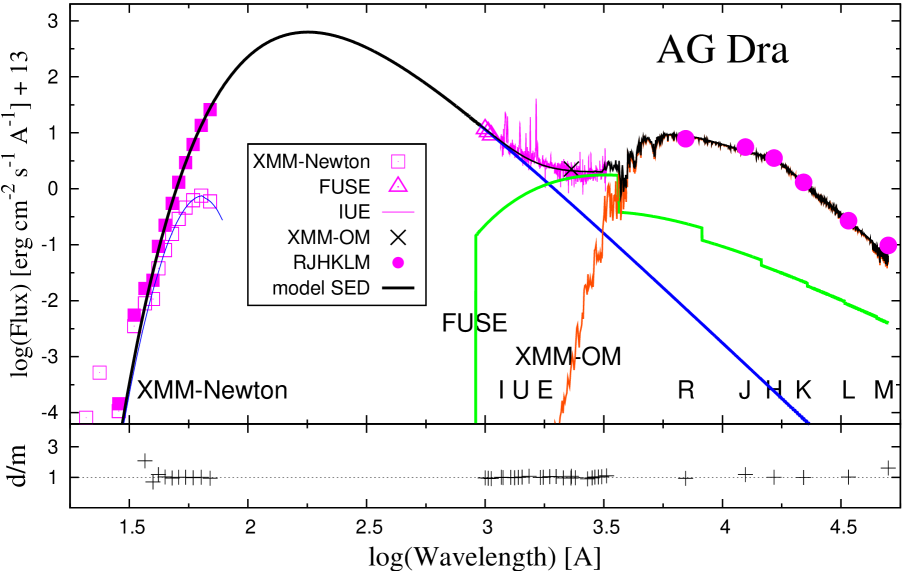
Two examples of the multi-band modelling the SED of AG Dra during its quiescent phase, i.e. with a strong supersoft X-ray component, were selected to demonstrate the method on a classical symbiotic star. The first model is composed of the ROSAT PSCP observation (Greiner et al., 1997) taken on 1993 April 15 and a nearly-simultaneous ultraviolet observation with IUE from 1993 April 9. The second one includes the supersoft X-ray data made with XMM-Newton and its optical monitor (XMM-OM) from 2005 June 11 (González-Riestra et al., 2008), the far-UV observations with FUSE taken during quiescent phase on 2004 June 24 and the IUE spectra, taken during quiescence at a similar orbital position (1979 September 25–27). In spite of a different time, their fluxes at the near-UV overlap those measured with XMM-OM. Both sets of observations were complemented with the photometric flux-points, which define the cool giant radiation. Its model SED was adopted according to Skopal (2005). Assuming that the radiation from the giant is constant, its contribution was subtracted from the near-UV fluxes, which reduced the model SED to (see Eq. 11). Resulting models and the corresponding parameters are depicted in Fig. 5 and given in Table 2, respectively. They are scaled with the distance to AG Dra of 1.1 kpc (Skopal, 2005). Relatively constant values of the X-ray and the far-UV fluxes, measured at very different dates, reflect a stability of the WD’s radiation in AG Dra (Table 2).
| Object | Distance | Giant | Hot star (SSS) | Nebula | |||||||
|---|---|---|---|---|---|---|---|---|---|---|---|
| / d.o.f. | |||||||||||
| [ kpc ] | [ ] | [ K ] | [ ] | [ ] | [ ] | [ kK ] | [ ] | [ kK ] | [ ] | ||
| LIN 358 | 60 | 178 | 4000 | 7300 | 6.1 | 0.089 | 38.03 | 18 | 2.4 | 1.3 / 40 | |
| RX J0439 | 49 | – | – | – | 4.2 | 0.08 | 38.23 | – | – | 0.96 / 58 | |
| V1974 Cyg | 1.8 | – | – | – | 18 | 0.020 | 38.49 | 40 | 0.39 | 15 / 17 | |
| V1974 Cyg | 1.8 | – | – | – | 17 | 0.014 | 38.43 | 50 | 0.30 | 11 / 21 | |
| AG Dra | 1.1 | 34 | 4300 | 360 | 2.90 | 0.029 | 36.28 | 15.0 | 0.060 | 5.4 / 39 | |
| AG Dra | 1.1 | —— dtto —— | 3.2 | 0.033 | 36.38 | 22.5 | 0.11 | 1.5 / 32 | |||
| AG Dra | 1.1 | —— dtto —— | 3.15 | 0.032 | 36.39 | 22.5 | 0.11 | 0.69 / 32 | |||
day 292 of the X-ray observation, day 511 of the X-ray observation, on 1993/04/13 with ROSAT, as in , but with an atmosphere model, on 2004/06/15 with XMM-Newton,
4 Discussion
Physical parameters of SSSs, derived from the multiwavelength modelling the SED, are, in some cases, very different from those currently inferred from modelling only their X-ray fluxes. This is caused by the (well known) problem of mutual dependence between the , and parameters in fitting the X-ray data, because they cover only a very small part ( nm) of the total measurable spectrum. In the following sections I examine this problem by comparing both the X-ray-band and the multi-band modelling the spectra of SSSs in more detail.
4.1 Modelling only the X-ray data
The supersoft X-ray fluxes, which are measurable by the current detectors, cover only the short-wavelength tail of the SSS spectrum, beyond its unabsorbed maximum. The absorption of the X-ray radiation increases markedly at longer wavelengths (e.g. Fig 1 of Wilms, Allen & McCray, 2000). These facts preclude unambiguous determination of the physical parameters, , and , because they are mutually dependent, when modelling only the X-ray data. A larger/lower value of constrains a larger/lower , but lower/larger value of , to fit satisfactorily the absorbed X-ray fluxes. By other words, the observed X-ray fluxes can be reproduced by very different sets of parameters. An illustrative example of this effect is shown in Fig. 4 of Ness et al. (2008), who fitted the supersoft spectrum of the classical nova V723 Cas by very wide range of parameters, (in ), cm-2 and K. Other convincing examples of this effect can be found in Table 6 of Greiner et al. (1997), Table 1 of Asai et al. (1998) or in Table 2 of Sturm et al. (2011).
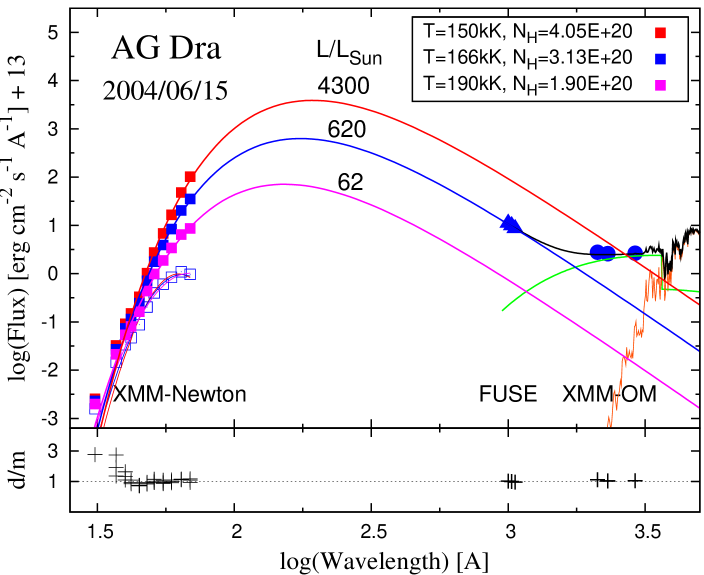
Here, I demonstrate the mutual dependence of the physical parameters defining the SSS radiation on the XMM-Newton spectrum of AG Dra from 2004 June 15th (Fig. 6). The spectrum was already described by González-Riestra et al. (2008) and modelled by Skopal et al. (2009). It covers the range of 31–69 Å. In fitting only the X-ray SED, I have fixed and fitted the observed fluxes with the function (6) for () and . In this way, it was possible to fit the X-ray data with , cm-2 and K. To select the correct model, we have to use fluxes from the far-UV, where the radiation from the SSS also dominates the spectrum (Figs. 1, 2, 4 and 5). Here I used the FUSE spectrum, which was obtained on 2004/06/24, nearly simultaneously with the XMM-Newton observations.
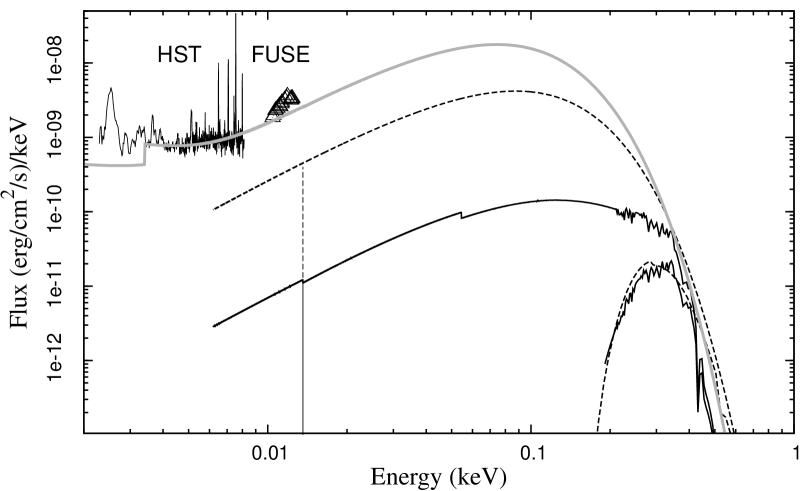
It is useful to note that modelling solely the X-ray data can result in a misleading conclusion. For example, Heise et al. (1994) modelled the X-ray data with ROSAT PSPC of the SSS SMP SMC 22 (RX J0058.6-7136) using the blackbody and atmospheric model. Both models fitted well the observed X-ray fluxes (see their Table 1 and Fig. 2), but the bolometric luminosity of the blackbody () was more than a factor of 10 higher than that of the model atmosphere. Therefore the authors concluded that fitting the WD model atmospheres yields a much smaller luminosity than blackbody spectra. However, the parameters presented in their Table 1 suggest that such a conclusion can be a result of the mutual dependence between fitting parameters, when one models only a very small fraction of the total spectrum. Therefore, I have reconstructed Fig. 2 of Heise et al. (1994) by using the parameters from their Table 1 to verify if their models can fit also the far-UV data. For the model atmosphere I used that with K calculated by Rauch et al. (2010) (spectrum 450000-9-HHeCNONeMgSiS, available at 111 http://astro.uni-tuebingen.de/∼rauch/TMAD/TMAD.html). However, the ultraviolet observations with FUSE and HST are located far above the Heise et al. (1994) models (see Fig. 7). This exposes the shortcoming of modelling the global SED of SSSs using only the X-ray fluxes, irrespectively of the model used.
4.2 Multiwavelength modelling the SED
To determine trustworthy physical parameters of SSSs, it is necessary to use fluxes from both sides of the SSS spectrum and to apply the multiwavelength modelling the SED. The far-UV fluxes put a limit for the scaling in Eq. (6) (i.e. the luminosity), while the X-rays are essential to estimate the temperature. Dereddened far-UV fluxes are firm (they are not dependent on the variable absorption by CSM), which allows us to select the correct model from those constrained by the X-ray data (see Figs. 6 and 7). By other words, the multiwavelength modelling of the global SED of SSSs allows us to determine their , and parameters unambiguously, as independent fitting variables.
4.3 Comparison with previous models
4.3.1 LIN 358
Previous blackbody models of the X-ray radiation emitted by LIN 358 (Kahabka & Haberl, 2006; Orio et al., 2007, Sect. 3.1) are clustered around the solution obtained by the multiwavelength approach of this paper (Fig. 8). Orio et al. (2007) tried also to model the X-ray data with an atmospheric model. Their solution led to an unrealistically high luminosity, within the 0.15–1.0 keV range. They also modelled the ultraviolet IUE spectrum SWP 49297, ignoring the X-ray and near-IR data. Their model ( K, , ) does not reproduce the observations for 160 nm (Fig. 8). It is far above the continuum of the ultraviolet spectrum, because of the large emission measure, cm-3 as given by the quantities in their Table 2. In addition, such a high cannot be generated by the hot stellar source in their UV model, which is not capable of producing the required flux of ionizing photons (parameter , see Eq. (21) of Skopal, 2005).
The effective temperature of the giant in LIN 358, as estimated by Mürset et al. (1996), is equal to that determined in this paper, while its radius and the luminosity are larger by a factor of 1.2. This is probably caused by a different approach. However, their parameters for the hot component, i.e. the SSS, are entirely different from those obtained by the multiwavelength modelling (Sect. 3.1, Table 2). The large difference in , and is probably a result of using the Zanstra method, which is very sensitive to the true level of the continuum adjacent to the HeII 1641 Å emission line. A faint and noisy UV continuum can yield a very large uncertainty in the Zanstra temperature.
The multiwavelength modelling the SED of the LIN 358 spectrum suggests a high luminosity of its SSS, . According to Van den Heuvel et al. (1992), the source of the radiative energy of ’classical’ SSSs is a steady nuclear burning of the hydrogen rich material on the WD surface. In the case of LIN 358, a high mass (0.9–1.2 ) WD accreting at should generate the observed bolometric luminosity under the condition of the stable nuclear burning (see e.g. Fig. 1 of Van den Heuvel, 2011).
4.3.2 RX J0439.8-6809
Our solution is, within the uncertainties, identical to that already found by Van Teeseling et al. (1999), because the same data from both the sides of the spectrum were used. Van Teeseling et al. (1999) also demonstrated that the luminosities derived from the blackbody and atmospheric model are well comparable, which contradicts the previous suggestion by Heise et al. (1994) and Krautter et al. (1996) (see Sect. 4.1).
The case of RX J0439.8-6809 justifies the significant contribution of the SSS radiation to the far-UV domain (see Fig. 2). The luminosity of RX J0439.8-6809 is as high as the Eddington limit for a 1.4 compact object. This makes it difficult to reveal the true nature of this SSS (see references in Sect. 3.2). The basic two questions, (i) what is the source of the high energy output, when a main-sequence donor star is not consistent with observations (Van Teeseling et al., 1997), and (ii) why such the luminous source does not generate any mass outflow, have not been answered yet satisfactorily.
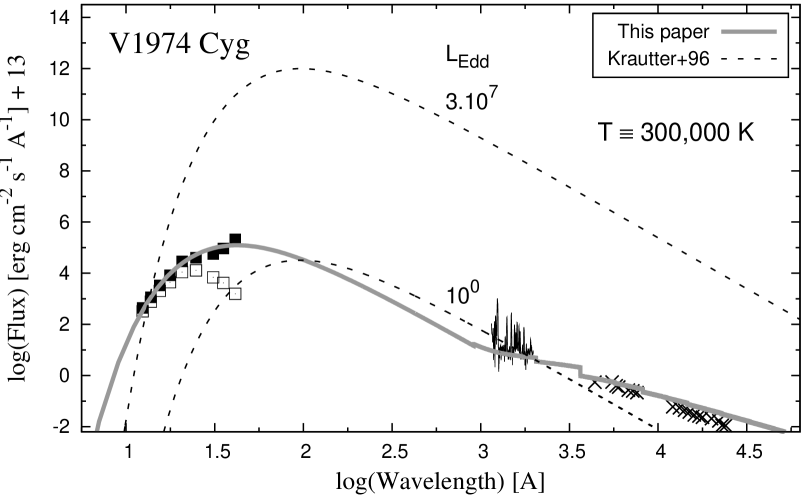
4.3.3 V1974 Cyg
The multiwavelength model SED of the classical nova V1974 Cyg fits satisfactorily fluxes from both the Wien and the Rayleigh-Jeans tail of the spectrum and corresponds to expected physical parameters (Fig. 4, Table 2). The evolution during the plateau phase of the nova was consistent with a constant luminosity, for the distance of 1.8 kpc. The multi-band model also suggested a constant , whose values, cm-2, can be attributed to the interstellar quantity, because they are consistent with the extinction to the nova, (Sect. 3.3) according to the relationship, (Diplas & Savage, 1994). As expected, at the end of the SSS phase the multi-band model indicated an increase in the temperature and a decrease in the effective radius of the WD photosphere (Table 2).
The large difference between the Krautter et al. (1996) fitting parameters and those derived by the multiwavelength approach, is caused by the mutual dependence between , and parameters in fitting the short X-ray range of fluxes. According to this effect, selection of a significantly lower temperature than the real one, requires an unrealistically high luminosity and absorbing column density to fit the X-ray data (see Sect. 4.1). Krautter et al. (1996) adopted K, which required a totally unrealistically high and to match the X-ray data. Therefore, to satisfy theoretical calculations, they scaled the model with the Eddington luminosity, which, however, lies outside observations (Fig. 9). Comparing the same ROSAT data with an atmospheric model calculated for a significantly higher temperature, Balman et al. (1998) derived more realistic parameters (see their Table 1). They are comparable with those of this paper (Table 2). A lower effective temperature, somewhat higher values of and a factor of lower luminosity in the Balman’s et al. (1998) model is again a result of modelling solely the X-ray fluxes.
Also in this case, modelling only the X-ray data showed that the problem in determining correct parameters of the SSSs radiation is primarily caused by using the insufficient wavelength range of the X-ray fluxes and not by using a blackbody model.
4.3.4 AG Dra
In both our examples, multiwavelength models fit well the observed fluxes from the supersoft X-ray to the near-IR. A higher value of for the 1993 model is probably caused by extracting the data from the figure (Fig. 4 of Greiner et al., 1997). The fundamental parameters of the SSS in both models are the same within their uncertainties. This reflects a stability of the energy production of the burning WD. A marginal change is indicated only in the hydrogen column density. The reality of its possible variation is supported by the variation in the EM (Table 2, Fig. 5), which can be caused by a variation in the mass loss rate from the hot star. The wind particles absorb the X-ray photons, but emit at energies for Å (see Skopal et al., 2009). Due to a strong absorption effect to the supersoft X-rays, a small change in the mass loss rate can result in a measurable change in and . The resulting parameters of our two models, cm-2, cm-5 and cm-2, cm-5 (Table 2, Eq. (8)) are consistent with this ionization/recombination process.
Greiner et al. (1997) fitted the ROSAT PSPC observations with three parameters (, Flux, ) and with two parameters (Flux, ) keeping fixed to 3.15 cm-2. The former set of models always required a lower for larger and flux () than in the latter models (see their Table 6). Their results thus demonstrated the mutual dependence between the , and parameters (see Sect. 4.1, Fig. 6). However, comparing the SSS component in the AG Dra spectrum to the IUE spectra from quiescence (see their Fig. 5), their resulting model for cm-2 ( eV, ) was, within uncertainties, identical in with the multiwavelength model SED of this paper (Fig. 10).
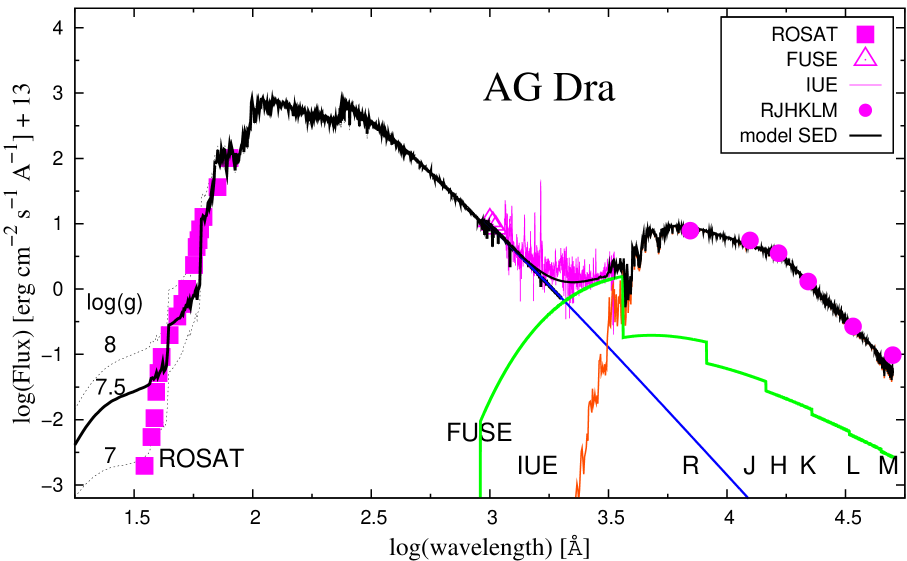
4.4 Comparison of blacbody and atmospheric model SED
To compare a blackbody model with an atmospheric model, it is important that the profile of the Planck curve for a very high temperature is nearly identical with that given by atmospheric models of the hot WDs for Å (e.g. Fig. 1 in Rauch, 2003, Fig. 7 here). Therefore, to fit the X-ray—UV SED, one always needs to scale both the atmospheric and the blackbody model to the far-UV fluxes with a similar . This thus implies that also the corresponding values will be comparable in both cases. In general, the atmosphere models have a steeper Wien tail of the spectrum than the blackbody, because of the presence of deep absorption lines and absorption edges seen in the high-resolution X-ray spectra (e.g. Ness et al., 2011). Thus to match the specific profile of the supersoft fluxes, a model atmosphere is required to obtain more reliable parameters than with a simple blackbody. However, the multiwavelength modelling must be used.
Here, I demonstrate an application of modelling the SED with the atmospheric model for the case of AG Dra (see Fig. 5, left panel). For the purpose of this illustration I used publicly available NLTE atmosphere models described by Rauch (2003) and Rauch et al. (2010). I used models with K, the H-Ni halo abundances and . Figure 11 shows the best comparison using the spectra 0160000-7.00-H-Ni-halo and 0160000-8.00-H-Ni-halo interpolated to . The model corresponds to the luminosity , and cm-2, which are similar to those given by the blackbody fit (Table 2).
In modelling the global SED by the multiwavelength approach with the aim to estimate the fundamental and parameters of a SSS, selection of a model (blackbody or atmospheric) is not of crucial importance.
5 Summary
In this paper I investigated the supersoft X-ray to near-IR SED of selected SSSs with the aim to determine their physical parameters by disentangling their composite spectra (Table 2). To model the global SED between 12 Å and 5 m, I used the multiwavelength modelling (Sect. 2). This represents the main novelty of this paper. The method was demonstrated on two extragalactic SSSs, the SyXB LIN 358 in the SMC, a bright SSS RX J0439.8-6809 in the LMC and two Galactic SSSs, the classical nova V1974 Cyg during its supersoft phase and the classical symbiotic star AG Dra during its quiescent phase. The main results can be summarized as follows.
-
1.
The models SED showed that the SSS radiation dominates also the far-UV domain. With the exception of RX J0439.8-6809, the modelling identified the nebular component of radiation, which dominates the spectra from the mid-UV to longer wavelengths (further conclusive examples are found in Paper II of this series).
-
2.
The multiwavelength modelling the SED overcomes the problem of the mutual dependence between the , and parameters, which arises in modelling only the X-ray data. The multi-band fitting procedure allows to determine these parameters as independent variables (Sects. 4.1. and 4.2., Fig. 6).
-
3.
The physical parameters of the global SED do not depend basically on the model used. A blackbody or an atmospheric model yield a similar luminosity, because they are nearly identical in the profile for Å and thus are equally scaled to the far-UV fluxes (Sects. 4.1., 4.3.2., 4.3.3. and 4.4., Figs. 7 and 11).
-
4.
An independent determination of the hydrogen column density in the ISM, based on the Rayleigh scattering the continuum photons around the Ly- line, is suggested. Values of obtained from modelling the SED and the Rayleigh attenuated continuum are consistent (Sects. 2.3.1. and 3.2.1., Fig. 3).
-
5.
Finally, the multiwavelength approach to modelling the SED of SSSs, as introduced in this paper, represents the main conceptional difference in comparison with previous approaches.
Acknowledgments
The author thanks the anonymous referee for a detailed commenting on the manuscript. FUSE, IUE and HST data presented in this paper were obtained from the MAST. STScI is operated by the Association of Universities for Research in Astronomy, Inc., under NASA contract NAS5-26555. Support for MAST for non-HST data is provided by the NASA Office of Space Science via grant NNX09AF08G and by other grants and contracts. The author thanks Rossario González-Riestra for providing XMM-Newton observations of AG Dra. Early versions of this work were presented at conferences in Brno (2009), Bowness-on-Windermere (2010), Via del Mar (2011) and Asiago (2011). This research has been in part supported by the project No. SLA/103115 of the Alexander von Humboldt foundation and by the Slovak Academy of Sciences under a grant VEGA No. 2/0002/13.
References
- Anderson et al. (1981) Anderson, C. M., Cassinelli, J. P., Sanders, W. T.: 1981, ApJ, 247, L127
- Asai et al. (1998) Asai, K., Dotani, T., Nagase, F. et al.: 1998, ApJ, 503, L143
- Austin et al. (1996) Austin, S. J., Wagner, R. M., Starrfield, S., et al.: 1996, AJ, 111, 869
- Balman et al. (1998) Balman, S., Krautter, J., Ögelman, H.: 1998, ApJ, 499, 395
- Barger et al (1993) Barger, A. J., Gallagher, J. S., Bjorkman, K. S., Johansen, K. A., Nordsieck, K. H.: 1993, ApJ, 419L, 85
- Birriel et al. (2000) Birriel, J. J., Espey, B. R., Schutle-Ladbeck, R. E.: 2000, ApJ, 545, 1020
- Brown & Mathews (1970) Brown R. L., & Mathews W. G.: 1970, ApJ, 160, 939
- Cardelli et al. (1989) Cardelli, J. A., Clayton, G. C., Mathis, J. S.: 1989, ApJ, 345, 245
- Chochol et al. (1993) Chochol, D., Hric, L., Urban, Z., et al.: 1993. A&A 277, 103
- Collins (1992) Collins, P.: 1992. IAU Circ. No. 5454
- Cowley et al. (1990) Cowley, A. P., Schmidtke, P. C., Crampton, D., Hutchings, J. B.: 1990, ApJ, 350, 288
- Cruddace et al. (1974) Cruddace, R., Paresce, F., Bowyer, S., Lampton, M.: 1974, ApJ, 187, 497
- Davidsen et al. (1977) Davidsen, A., Malina, R., Bowyer, S.: 1977, ApJ, 211, 866
- Diplas & Savage (1994) Diplas A., Savage B. D.: 1994, ApJ, 427, 274
- Fekel et al. (2000) Fekel, F. C., Hinkle, K. H., Joyce, R. R., Skrutskie, M.: 2000, AJ, 120, 3255
- Gallagher & Code (1974) Gallagher, J. S., Code, A. D.: 1974, ApJ, 189, 303
- González-Riestra et al. (2008) González-Riestra, R., Viotti, R. F., Iijima, T., Rossi, C., Montagni, F., Bernabei, S., Frasca, A., Skopal, A.: 2008, A&A, 481, 725
- Greiner at el. (1991) Greiner, J., Hasinger, G., Kahabka, P.: 1991, A&A, 246, L17
- Greiner at el. (1994) Greiner, J., Hasinger, G., & Thomas, H.-C.: 1994, A&A, 281, L61
- Greiner et al. (1997) Greiner, J. Bickert, K., Luthardt, R., Viotti, R., Altamore, A. Gonzalez-Riestra, R., Stencel, R. E.: 1997, A&A, 322, 576
- Gurzadyan (1997) Gurzadyan, G.A.: 1997, The Physics and Dynamics of Planetary Nebulae (Berlin: Springer-Verlag)
- Haberl et al. (2000) Haberl, F., Filipovič, M.D., Pietsch, W., Kahabka, P.: 2000, A&AS, 142, 41
- Hauschildt et al. (1999) Hauschildt, P. H., Allard, F., Ferguson, J., Baron, E., Alexander, D. R.: 1999, ApJ, 525, 871
- Heise et al. (1994) Heise, J., van Teeseling, A., Kahabka, P.: 1994, A&A, 288, L45
- Kahabka (2004) Kahabka, P.: 2004, A&A, 416, 57
- Kahabka & Haberl (2006) Kahabka, P., & Haberl, F.: 2006, A&A, 452, 431
- Kato (2010) Kato, M.: 2010, Astron. Nachr., 331, 140
- Krautter et al. (1996) Krautter, J., Ögelman, H., Starrfield, S., Wichmann, R., Pfeffermann, E.: 1996, ApJ, 456, 788
- Leedjärv et al. (2004) Leedjärv, L., Burmeister, M., Mikolajewski, M., Puss, A., Annuk, K., Galan, C.: 2004, A&A, 415, 273
- Lindsay (1961) Lindsay, E. M.: 1961. AJ, 66, 169
- Long et al. (1981) Long, K. S., Helfand, D. J., Grabelsky, D. A.: 1981, ApJ, 248, 925
- Masetti et al. (2006) Masetti, N., Orlandini, M., Palazzi, E., Amati, L., Frontera, F.: 2006, A&A, 453, 295
- Mateo (1998) Mateo, M. L.: 1998, AR&A, 36, 435
- Meinunger (1979) Meinunger, L.: 1979, IBVS No. 1611
- Mereghetti et al. (2010) Mereghetti, S., Krachmalnicoff, N., La Palombara, N. Tiengo, A., et al.: 2010, A&A, 519, A42
- Mürset et al. (1991) Mürset, U., Nussbaumer, H., Schmid, H. M., Vogel, M.: 1991, A&A, 248, 458
- Mürset et al. (1996) Mürset, U., Schild, H., Vogel, M.: 1996, A&A, 307, 516
- Mürset, Wolff & Jordan (1997) Mürset, U., Wolff, B., Jordan, S.: 1997, A&A, 319, 201
- Mürset & Schmid (1999) Mürset, U., & Schmid, H. M.: 1999, A&AS, 137, 473
- Ness et al. (2008) Ness J.-U., Schwarz G., Starrfield S., Osborne J. P., Page K. L., Beardmore A. P., Wagner R. M., Woodward, C. E.: 2008, AJ, 135, 1328
- Ness et al. (2011) Ness J.-U., Osborne J. P., Dobrotka, A., et al.: 2011, ApJ, 733:70 (16pp)
- Nespoli et al. (2010) Nespoli, E., Fabregat, J., Mennickent, R. E.: 2010, A&A, 516, A94
- Nussbaumer et al. (1989) Nussbaumer,H., Schmid, H. M., Vogel, M. 1989, A&A, 211, L27
- Nussbaumer & Vogel (1995) Nussbaumer, H. & Vogel, M.: 1995, A&A, 301, 170
- Orio et al. (2007) Orio, M., Zezas, A., Munari, U., Siviero, A., Tepedelenlioglu, E.: 2007, ApJ, 661, 105
- Pakull et al. (1985) Pakull, M. W., Ilovaisky, S. A., Chevalier, C.: 1985, Space Sci. Rev., 40, 229
- Paresce et al. (1995) Paresce, F., Livio, M., Hack, W., Korista, K.: 1995, A&A, 299, 823
- Rafanelli et al. (1995) Rafanelli, P., Rosino, L., Radovich, M.: 1995, A&A, 294, 488
- Rauch (2003) Rauch, T.: 2003, A&A, 403, 709
- Rauch et al. (2010) Rauch, T., Orio, M., Gonzales-Riestra, R., Nelson, T., Still, M., Werner, K., Wilms, J.: 2010, ApJ, 717, 363
- Sanduleak & Pesch (1981) Sanduleak, N., & Pesch, P.: 1981, PASP, 93, 431
- Schmeer et al. (1992) Schmeer, P., Taylor, M., Kushida, Y. R., Hurst, G. Sventek, P.: 1992, IAU Circ. No. 5455
- Schmid & Schild (1997) Schmid, H. M., & Schild, H.: 1997, A&A, 321, 791
- Schmidtke & Cowley (1996) Schmidtke, P. C., & Cowley, A. P.: 1996, AJ, 112, 167
- Seward & Mitchell (1981) Seward, F. D. & Mitchell, M.: 1981, ApJ, 243, 736
- Shore et al. (1993) Shore, S. N., Sonneborn, G., Starrfield, S., Gonzalez- Riestra, R., Ake, T. B.: 1993, AJ, 106, 2408
- Skopal (2005) Skopal, A.: 2005, A&A, 440, 995
- Skopal (2006) Skopal, A.: 2006, A&A, 457, 1003
- Skopal (2007) Skopal, A.: 2007, New Astron., 12, 597
- Skopal et al. (2006) Skopal, A., Vittone, A. A., Errico, L., et al.: 2006, A&A, 453, 279
- Skopal et al. (2012) Skopal, A., Shugarov, S., Vaňko, M., et al.: 2012, Astron. Nachr., 333, 242
- Skopal et al. (2009) Skopal, A., Sekeráš, M., González-Riestra, R., Viotti, R. F.: 2009, A&A, 507, 1531
- Sturm et al. (2011) Sturm, R., Haberl, F., Greiner, J., et al.: 2011, A&A, 529, id. A152, 5 pp
- Stute, Luna & Sokoloski (2011) Stute, M., Luna, G. J. M., Sokoloski, J. L.: 2011, ApJ, 731:12 (5pp)
- Van den Heuvel (2011) Van den Heuvel, E. P. J.: 2011, Bull. Astr. Soc. India, 39, 1-20
- Van den Heuvel et al. (1992) Van den Heuvel, E. P. J., Bhattacharya, D., Nomoto, K., Rappaport, S. A.: 1992, A&A, 262, 97
- Van Teeseling et al. (1996) Van Teeseling, A., Reinsch, K., & Beuermann, K. 1996, A&A, 307, L49
- Van Teeseling et al. (1997) Van Teeseling, A., Reinsch, K., Hessman, F. V. Beuermann, K.: 1997, A&A, 323, L41
- Van Teeseling et al. (1999) Van Teeseling, A., Gänsicke, B. T., Beuermann, K., Dreizler, S., Rauch, T., Reinsch, K.: 1999, A&A, 351, L27
- Viotti et al. (2005) Viotti, R. F., González-Riestra, R., Iijima, T., et al.: 2005, ApSS, 296, 435
- Walker (1983) Walker, A.R.: 1983, MNRAS, 203, 25
- Wagner & DePoy (1996) Wagner, R. M., & DePoy, D. L.: 1996, ApJ, 467, 860
- Wegner (2003) Wegner, W. 2003, AN, 324, 219
- Wheatley, Mukai, & de Martino (2003) Wheatley, P. J., Mukai, K., de Martino, D.: 2003, MNRAS, 346, 855
- Wilms, Allen & McCray (2000) Wilms, J., Allen, A., McCray, R.: 2000, ApJ, 542, 914
- Zaritsky et al. (2002) Zaritsky, D., Harris, J., Thompson, I. B., Grebel, E. K., Massey, P.: 2002, AJ, 123, 855