An Accreting White Dwarf near the Chandrasekhar Limit in the Andromeda Galaxy
Abstract
The iPTF detection of the most recent outburst of the recurrent nova system RX J0045.4+4154 in the Andromeda Galaxy has enabled the unprecedented study of a massive () accreting white dwarf (WD). We detected this nova as part of the near daily iPTF monitoring of M31 to a depth of mag and triggered optical photometry, spectroscopy and soft X-ray monitoring of the outburst. Peaking at an absolute magnitude of mag, and with a decay time of 1 mag per day, it is a faint and very fast nova. It shows optical emission lines of He/N and expansion velocities of 1900 to 2600 km s-1 1–4 days after the optical peak. The Swift monitoring of the X-ray evolution revealed a supersoft source (SSS) with that appeared within 5 days after the optical peak, and lasted only 12 days. Most remarkably, this is not the first event from this system, rather it is a recurrent nova with a time between outbursts of approximately 1 year, the shortest known. Recurrent X-ray emission from this binary was detected by ROSAT in 1992 and 1993, and the source was well characterized as a WD SSS. Based on the observed recurrence time between different outbursts, the duration and effective temperature of the SS phase, MESA models of accreting WDs allow us to constrain the accretion rate to and WD mass . If the WD keeps of the accreted material, it will take less than a Myr to reach core densities high enough for carbon ignition (if made of C/O) or electron capture (if made of O/Ne) to end the binary evolution.
Subject headings:
galaxies: individual (M31) — novae, cataclysmic variables — supernovae: general — X-rays: binaries — white dwarfs1. Introduction
Classical novae are the observable outcome of unstable thermonuclear burning on accreting white dwarfs (WDs). In most tight binaries with WDs of typical masses of , the recurrence time is tens of thousands of years. However, if the accretion rate, , is high and the WD mass is large, the time between flashes can become short enough so that the recurrence can be measured. Due to the large accretion rate and insignificant ejection mass loss, recurrent novae (RNe) have been proposed to grow toward the Chandrasekhar limit and could be promising progenitors of Type Ia supernovae (Starrfield et al., 1988; Di Stefano, 2010). Within our galaxy, these recurrent novae (RNe) have, at the minimum, a recurrence time of 10 years (Schaefer, 2010).
As the nearest large galaxy neighbor of the Milky Way, the Andromeda galaxy (M31) provides the best opportunity for studies of classical and recurrent novae. Extensive photometric and spectroscopic surveys have been conducted to search for novae in M31, and have resulted in the discovery of over 900 novae, with over 100 having well-sampled light curves, optical spectra, or X-ray observations (Hubble, 1929; Arp, 1956; Darnley et al., 2004; Henze et al., 2010; Shafter et al., 2011; Cao et al., 2012, see also the website maintained by Pietsch111http://www.mpe.mpg.de/{~{}}m31novae/opt/m31/M31_table.html and references therein). There are six confirmed RNe in M31, and a few other strong candidates (Shafter et al., 2013).
During our nightly monitoring of M31 in the intermediate Palomar Transient Factory (iPTF; hereafter called simply PTF; Law et al., 2009), we discovered a transient at the location of a known nova in M31 (Tang et al., 2013), and confirmed it to be a RN with a recurrence time of 1yr with four optical outbursts detected in PTF from 2009 to 2013. During the optical novae, only a fraction of envelope is ejected (Starrfield et al., 1974), while the remaining envelope is expected to continue hydrogen burning. As the ejected envelope expands, the ejecta becomes optically thin, and a supersoft source (SSS) powered by hydrogen burning is expected to emerge after the optical nova (Sala & Hernanz, 2005; Wolf et al., 2013). Recent observational work has now made it clear that all novae have an extended supersoft phase whose duration and temperature depend solely on the WD Mass (Pietsch et al., 2005; Orio et al., 2010; Henze et al., 2013c). We show here that this apparent transient behavior is an excellent match to the supersoft phase of a recurrent nova, and that the optical novae must have been missed in 1992, 1993 and 2001 when X-ray outbursts were seen (White et al., 1995; Williams et al., 2004). We describe the PTF discovery and optical follow-up observations in §2. Archival optical and X-ray studies are presented in §3 and §4, respectively. Swift observations and analyses are presented in §5. Theoretical modeling is presented in §6. Our conclusion is in §7.
2. PTF Discovery and Optical Follow-up Observations
On 2013 Nov 27.08 UT222All times are in UT, we detected a transient at , with 18.9 mag (Tang et al., 2013) in the nightly monitoring of M31 in the PTF using the 48-inch telescope at Palomar. It brightened to 18.3 mag on Nov 28.08. No source was detected at the same location to mag in PTF images taken on Nov 26.08 and Nov 25.29. There was no detection in 270 nightly PTF -band images taken between 2013 May 19 to Nov 13 to a similar depth during non-bright time. The transient is coincident within measurement uncertainties with the reported positions of three optical novae or novae candidates, i.e. He/N nova M31N2012-10a (Nishiyama & Kabashima, 2012; Shafter et al., 2012), nova candidates M31N2011-10e (Korotkiy & Elenin, 2010; Barsukova et al., 2011) and M31N 2008-12a (Nishiyama & Kabashima, 2008). It is also coincident with the position of a ROSAT recurrent supersoft transient RX J0045.4+4154 (White et al., 1995), which was the first discovery of outbursts from this source. Therefore, we refer to the transient as RX J0045.4+4154 hereafter.
Following our discovery, we initiated rapid photometric and spectroscopic follow-up observations. We obtained observations on the Palomar 60-inch telescope (P60; Cenko et al., 2006) on Nov 29, Nov 30, and Dec 1, and images on the Low Resolution Imaging Spectrometer (LRIS; Oke et al., 1995) mounted on the Keck I 10 m telescope on Dec 4. Final reduction of the PTF images was performed using a forced-position Point-Spread Function (PSF) photometry pipeline (Ofek et al., 2012, Masci et al. in prep.). The P60 and LRIS images were reduced using aperture photometry. We calibrated the LRIS images using the Local Group Survey catalog (LGS; Massey et al., 2006), and obtained a refined position for the transient of , with uncertainty of (dominated by systematic uncertainties; the scattering of positions on the 3 LRIS images are ). The optical light curve in 2013 is shown in the top panel in Figure 1.
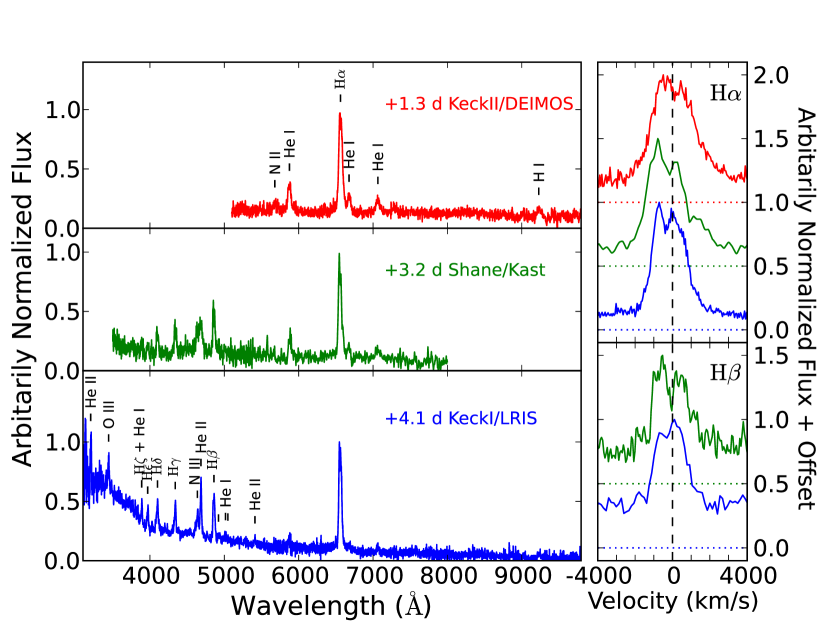
Optical spectroscopic follow-up of RX J0045.4+4154 was undertaken with the Deep Imaging Multi-Object Spectrograph (DEIMOS; Faber et al., 2003) mounted on the Keck II 10 m telescope on Nov 29, 2013 (1.3 days post peak), the Kast double spectrograph (Miller & Stone, 1993) on the Shane 3 m telescope at Lick Observatory on Dec 1 (3.2 days post peak), and LRIS mounted on the Keck I 10 m telescope on Dec 2 (4.1 days post peak). The spectral resolution is 4.2 Å, 6 Å (blue side) to 11 Å (red side), and 7 Å, for the DEIMOS, Kast, and LRIS spectrum, respectively. Spectra were reduced with standard IRAF routines.
The spectroscopic series of RX J0045.4+4154 is shown in Figure 2. It showed strong emission lines of Balmer series, He i, He ii, and N iii. The observed optical lines place it into the “He/N” class of Williams (1992). The spectra are similar to the HET spectrum taken 0.6 days post peak of the 2012 outburst (M31N2012-10a; Shafter et al., 2012). Such similarity suggests that RN outbursts only depend on system parameters like the WD mass and binary properties. Compared with the DEIMOS spectrum, He i lines weakened significantly in the LRIS spectrum, suggesting a decrease in the shell ionization during this period. The FWHM of H emission line decreased, from km s-1 in the DEIMOS spectrum, to km s-1 in the LRIS spectrum, suggesting decreased ejecta velocity. Such velocity is at the low end of He/N nova (Shafter et al., 2011), and is at the low end of RNe (see e.g. Kato & Hachisu, 2003; Yamanaka et al., 2010).
The galactic extinction along the line of sight of RX J0045.4+4154 is and (Schlafly & Finkbeiner, 2011), which is the lower limit of extinction of the object. To estimate the line-of-sight extinction contribution from M31 from the LRIS spectrum, we subtract the continuum, and measure the flux ratio of to be 3.89. Assuming case B recombination (optically thick in Ly Lines, optically thin in all other Hydrogen lines), the extinction is and (uncertainty comes from the range in expected ratios for Case B of 2.76–3.30; Osterbrock & Ferland, 2006), which corresponds to cm-2 (Predehl & Schmitt, 1995). If the nebula is not optically thin in Balmer lines or if the collisional excitation is non-negligible, a higher ratio is expected relative to the case B recombination, leading to an overestimated extinction. Therefore, the above dust extinction and hydrogen column density should be regarded as upper bounds.
3. Archival Optical Observations
3.1. Past Outbursts
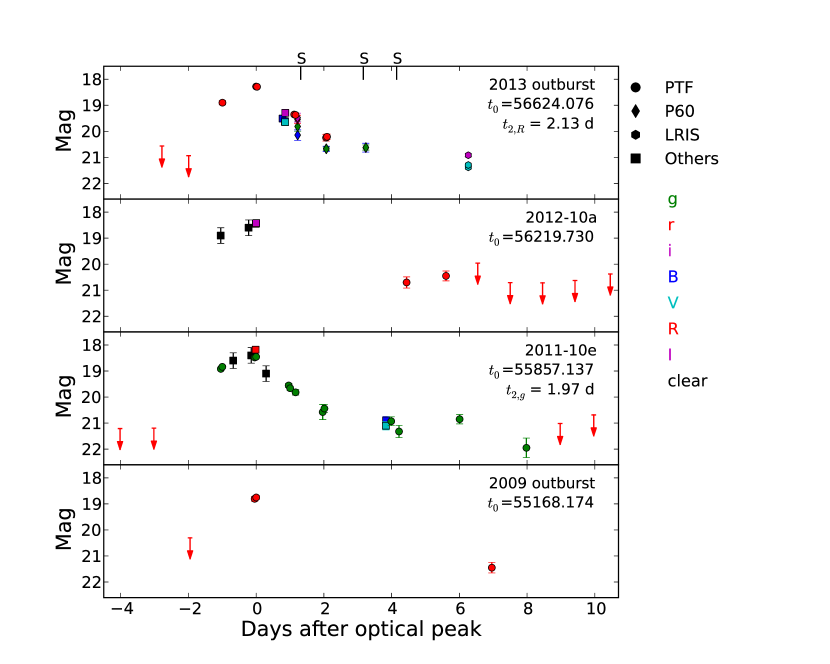
Archival work within PTF revealed other outbursts. We confirmed outbursts in Oct 2012 (He/N nova M31N2012-10a; Nishiyama & Kabashima, 2012; Shafter et al., 2012) and Oct 2011 (nova candidate M31N2011-10e; Korotkiy & Elenin, 2010; Barsukova et al., 2011), and identified another un-reported outburst in Dec 2009. The transient is also coincident with the reported positions of nova candidate M31N 2008-12a (Nishiyama & Kabashima, 2008). We also went back to Arp’s survey (1956) of M31 novae in the 1950s and found nothing at this location in his catalog.
The observed outbursts are listed in Table 1. The recurrence time is 341 days from ROSAT (White et al., 1995), and the recurrence times between the five most recent outbursts (2008–2013) are 342, 689, 363, and 404 days, respectively. Assuming a recurrence time between 330–410 days, we expect an outburst in 2010 during Oct 29 to Nov 27. During this time, there are 30 PTF images ( band, typical limiting mag mag), 6 images taken by P60 ( and bands, typical limiting mag mag), and 6 images taken by MegaCam on the Canada-France-Hawaii Telescope (CFHT; Boulade et al., 2003) on Oct 31, 2010 in , , and with 200s to 600s exposures (limiting mag mag). No outburst was detected. If there is an outburst with light curve similar to the 2013 and 2011 novae, it will be detected by PTF during to (where is the optical peak time), by P60 during to , and by CFHT/MegaCam during to . Only two possible windows are left if there was a nova in 2010, i.e. Nov 10–12, or Nov 20–27.
The optical light curves of the 2009, 2011, 2012, and 2013 outbursts are shown in Figure 1, and are similar. We have daily sampled , and band light curves covering the rise, peak, and decay of the 2011 and 2013 outbursts. The derived (time to decay from the peak by 2 mag) is 2.0 days in the 2011 outburst, and 2.1 days in the 2013 outburst, making it among the fastest novae (Cao et al., 2012). The declines within 2 mag from the peak are more or less linear, and thus linear regression is used to derive . The peak magnitude in the 2013 outburst is mag at from PTF data. The peak magnitudes in the 2011 outburst is mag at from PTF data, and mag at from Barsukova et al. (2011).
The simultaneous or nearly simultaneous photometric measurements in the 2011 and 2013 outbursts are listed in Table 1. Assuming an intrinsic effective temperature of K as observed in typical novae, the inferred extinction is ( cm-2).
Adopting an extinction of and ( cm-2), which is consistent with both the Balmer decrement and available colors of the outbursts, and given the distance modulus of M31 of 24.4 (Vilardell et al., 2010), the peak absolute magnitude of the 2013 and 2011 outbursts is then mag, and mag, respectively. With the fastest decline rate (1 mag d-1) yet faint peak magnitude among novae, RX J0045.4+4154 is an extreme outlier in the canonical maximum-magnitude-rate-of-decline (MMRD) relation (della Valle & Livio, 1995). As discussed by Kasliwal et al. (2011), such faint and fast novae can arise from progenitors containing high accretion rate and relatively massive white dwarfs (thus lower envelope masses at Hydrogen ignition; see e.g. Wolf et al. 2013), as we expect for recurrent novae.
3.2. Archival HST Observations
Following the candidate progenitor reported in Williams et al. (2013), we re-analysed the Hubble Space Telescope (HST) archival exposures to investigate photometric properties of RX J0045.4+4154 in quiescence. Besides the ACS/WFC data (Filters: F475W and F814W; Date: 2010 August 7) mentioned in the report, we made use of newer ACS/WFC (Filters: F475W and F814W; Date: 2012 January 10) and WFC3/UVIS&IR (Filters: F110W, F160W, F275W, and F336W; Date: 2011 January 25 and August 31) observations in the analysis. To search for the progenitor, accurate astrometry with precision down to – between our Keck/LRIS image (see §2) and the HST images were performed based on 5–18 bright reference stars. Within the Keck/LRIS error circle (astrometric uncertainty dominated) of RX J0045.4+4154, a clear source is present in the optical/UV-band HST images but is undetectable in the IR band. We measured magnitudes of the detected source through the Dolphot PSF photometry package (Dolphin, 2000) with HST-dedicated parameters suggested in the manual. All calculated photometric measures are listed in Table 3. The mean magnitudes for the optical/UV filters are F275W=23.07, F336W=22.96, F475W=24.24, and F814W=23.91333See Table 3 for details. . For the IR bands, we estimated the upper limits by examining the faintest stars detected by the HST exposures, which gives us F110W 24.44 (exposure: 800s) and F160W 25.22 (exposure: 1700s). Variability is present in all optical/UV bands with amplitudes up to mag for F275W, mag for F336W, mag for F475W, and mag for F814W, likely from the high accretion rate disk. There is a significant change in color between 2010 and 2012 with suggesting the system was possibly in a different phase of the nova recurrent cycle or/and at a different accretion rate. The results are consistent with an independent study on the same object by Darnley et al. (2014).
4. Archival X-ray Data
In the M31 second ROSAT PSPC survey catalog (Supper et al., 2001), a recurrent supersoft X-ray transient RXJ 0045.4+4154, identified by White et al. (1995), is spatially coincident with the optical RN (offset: ; uncertainty ). RXJ 0045.4+4154 showed two distinct supersoft X-ray outbursts of duration days in February 1992 and January 1993 (340 days apart) (see White et al., 1995, figure 2), in which rapid luminosity changes over the 5-day intervals were clearly seen while a comparably bright X-ray source was completely absent before or after the outbursts. White et al. (1995) interpreted the supersoft X-rays as the consequence of thermonuclear burning of hydrogen on the surface of a WD and estimated the WD atmosphere temperature to be eV by fitting the spectrum with a blackbody model, inferring a peak luminosity (absorption corrected) of erg s-1(0.1–2 keV) and a blackbody radius of cm ( kpc assumed). From an O viii ionization edge detection at 0.87 keV, RXJ 0045.4+4154 was believed to be a massive WD with (i.e., ).
Williams et al. (2004) reported a Chandra/HRC transient detection in Sep 2001, in which the X-ray transient, named n1-85, was mostly quiescent ( erg s-1), but was detected at one epoch with erg s-1(see Williams et al., 2004, Figure 6). Their reported coordinates of n1-85 is offset from the optical position of RX J0045.4+4154, seemingly making an association with RX J0045.4+4154 unlikely. However, we registered the Chandra/HRC image to the Swift/XRT WCS frame to investigate possible association. Using four common X-ray sources detected by both the instruments in the field, the astrometric corrected offset of n1-85 and RXJ 0045.4+4154 dropped to about , which is smaller than the positional uncertainty of the XRT position (), hence, we are confident of the association.
5. Swift Observations
5.1. Swift XRT and UVOT light curves
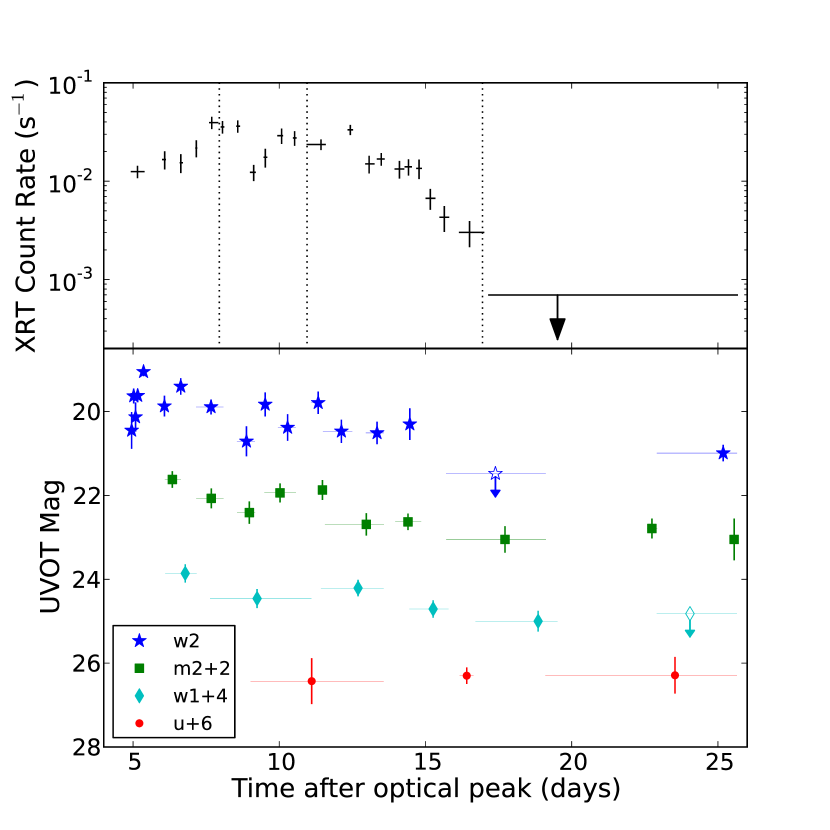
Given the short X-ray outburst duration observed in ROSAT (White et al., 1995), we launched high cadence ToO X-ray and UV observations with the Swift observatory (Gehrels et al., 2004). Another Swift campaign was carried out by M. Henze and collaborators (Henze et al., 2013a) following our optical discovery (Tang et al., 2013). RX J0045.4+4154 was observed with the Swift X-ray telescope (XRT; Burrows et al., 2005) and the Ultraviolet/Optical Telescope (UVOT; Roming et al., 2005) in a series of 36 observations beginning on 2013 Dec 3 (5 days after the optical peak). Typically 4–6 ks observations were taken in 1–2 ks snapshots each day from Dec 3 to Dec 16, and 7–8 ks observations once every 3 days from Dec 17 to Dec 23. The total exposure time is 97.6 ks.
A highly variable source is detected in both XRT and UVOT at the optical position of RX J0045.4+4154 (see also Henze et al., 2013b). The enhanced position given by the online Swift XRT pipeline software of the UK Swift Science Data Centre at the University of Leicester (Evans et al., 2007) is , with a 90% error of 1.6″, which is consistent with the optical position of the nova. The Swift XRT light curve of RX J0045.4+4154 given by the same pipeline is shown in black in the top panel of Figure 3. The first detection in optical is 1 day before the optical peak, and we have a 5 upper limit of mag 2 days before the optical peak. Hence the onset of the thermonuclear runaway (TNR) is 1-2 days before the optical peak. Therefore, from the XRT light curve, we measured the turn-on time (defined as the time it takes for the source to emerge as a SSS after the onset of TNR) of 6–7 days, and turn-off time (defined as the time it takes for the source to disappear in X-rays after the onset of TNR) of 18–19 days. Both timescales are among the shortest ones measured for novae (Henze et al., 2013c).
The UVOT data were reduced with the HEASoft V6.15 package and with the calibration files released in January 2013. Aperture photometry was performed using UVOTPRODUCT, with a 5″ radius for the source, and an annulus with inner radius 27″ and outer radius 35″ for background, as recommended by Poole et al. (2008). No bright UV source is located in the background annulus. The resulting UVOT light curves are shown in the bottom panel of Figure 3. The magnitudes are in the Vega system. It showed significant short-time variations, notably 1 mag variations on hourly timescales in the uvw2 filter ( Å; Poole et al., 2008) during the 5 snapshots in the first Swift observation. It also showed a relatively monotonical decline on longer timescales (a few days) after the first Swift observation. The long-term variation amplitude during the Swift campaign is about 2 mag, 1.4 mag and 1 mag in the uvw2, uvm2 ( Å) and uvw1 ( Å) filters, respectively. No significant variation is detected in the u band ( Å). The relatively smaller variation amplitudes in UV compared with X-ray are consistent with the scenario of decreasing effective temperature in the late stage of SSS.
5.2. Effective temperature and column density evolution
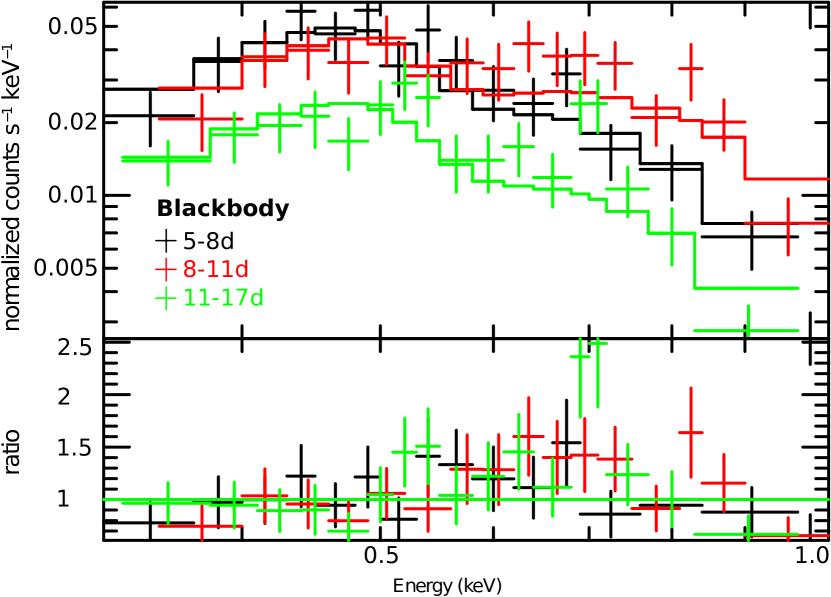
We obtained the Swift data including the corresponding ancillary files from the Swift quick look data archive, extracted the level-2 event files to spectra using HEASoft version 6.14, and performed spectral fittings using XSPEC version 12.8.1 with the an absorbed blackbody model (i.e., phabs*bbobyrad). Given that the X-ray variability is high over the entire supersoft phase, we split the spectrum into parts according to the observing time to investigate the luminosity and temperature evolutions of the system. We divided the observations into three groups (Table 4) and fitted each with an absorbed blackbody. Due to a low photon count, we assumed two possible , i.e. cm-2 and cm-2, to increase the degrees of freedom of the fits. The assumed are consistent with the extinction measured from the Balmer decrement ( cm-2) and optical colors ( cm-2), as well as the results from an independent study on the same object by Henze et al. (2014) who estimated a of cm-2 from the Swift data.
As listed in Table 4, the fits show significant variabilities in temperature and luminosity and all best-fit parameters are consistent with the ROSAT outbursts. The limited number of XRT photons and our lack of knowledge of the metallicity at the stellar photosphere inhibited our use of the more accurate stellar atmosphere models of Rauch et al. (2010) that were constructed for hot and massive WDs.
6. High and Nova Models
The short nova recurrence time, rapid evolution as an X-ray source and high surface temperature during the SSS phase all consistently point to a high mass WD. To quantify just how large the WD mass must be to explain the observations, we undertook an expansion of the recent work of Wolf et al. (2013) using the Modules for Experiments in Astrophysics (MESA rev. 5596; Paxton et al., 2011, 2013). We simulated WDs with 1.30, 1.32, 1.34, and 1.36 accreting material with solar composition, focusing on models that yielded the observed recurrence time of 1 yr, yielding an accretion rate range of . These model WDs have core temperatures of K, except for the 1.36 model, which had K. The value of does not impact the outcome at these high ’s due to the heat buffer created by the even hotter helium layer () (Prialnik & Kovetz, 1995; Cassisi et al., 1998; Piersanti et al., 1999; Yaron et al., 2005; Wolf et al., 2013). The mass loss prescription during the novae events is a super Eddington wind, as described in Denissenkov et al. (2013) and Wolf et al. (2013).
These calculations immediately show that the WD in RX J0045.4+4154 has a mass of at least , as lower mass WDs could not yield a minimum recurrence time as short as 1 yr. The ’s for the and models that yielded were, respectively, , , and . These models retained of the accreted material through the outburst, yielding effective accretion rates onto the helium layer of , , and . Assuming this matter ultimately stays on the WD and that the effective accretion rate remains constant, these models would evolve to within years.
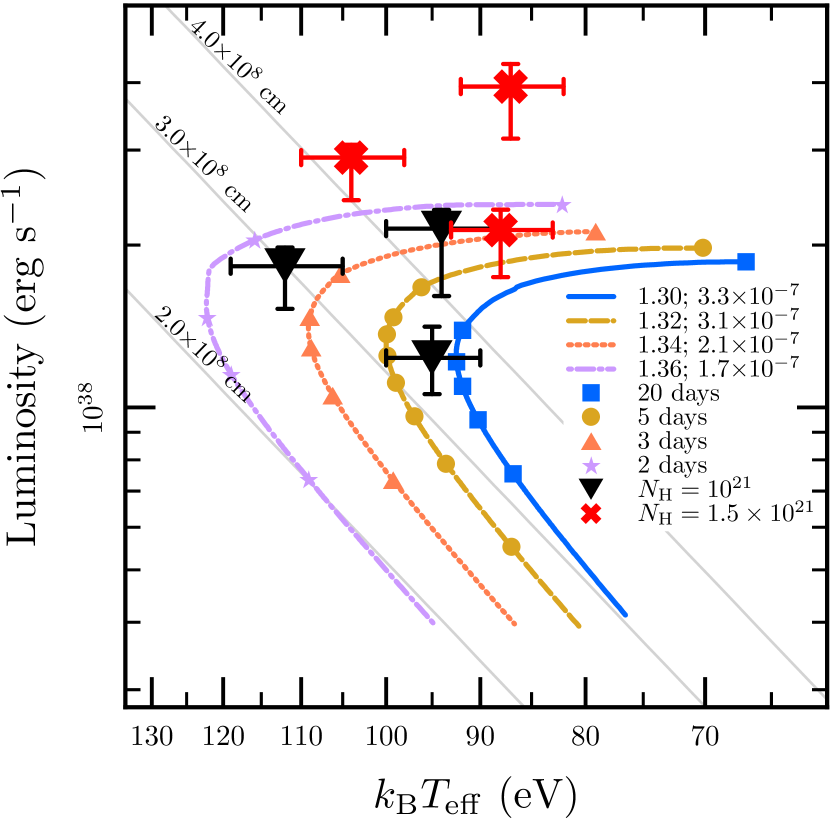
We next studied the location of these high mass WDs in the HR diagram during the SSS phase, all of which enter the SSS phase after only about 10–20 days from the onset of the TNR. As listed in Table 4, the measured from the two absorbed blackbody models are consistent with each other within uncertainties, though there is a modest discrepancy in the blackbody luminosities. As shown in Figure 5, all theoretical tracks are consistent with the measured of RX J0045.4+4154, with either cm-2 or cm-2. However, the WDs have different rates of evolution in the HR diagram depending on their mass, as denoted by the solid points that denote the elapsed time between each point. For example, the WD (orange dotted line and triangles) evolves through the SSS phase in about 15 days, whereas the WD is in a SSS phase for only 8 days. Clearly, the WD evolves far too slowly. So, this comparison again points to WD masses of in our super Eddington wind model, with mass loss due to Roche lobe overflow indicating more massive WDs (Wolf et al., 2013). The turnoff times could be shorter if there was substantial mixing of elements heavier than hydrogen (e.g. He, C, O) into the burning layer during the TNR (Sala & Hernanz, 2005), pointing to WD masses at the lower end, i.e. .
7. Conclusion
As a recurrent nova, RX J0045.4+4154 has many remarkable features, with the shortest recurrence time of 1 year, rapid turn-on and turn-off of the stable burning SSS phase, and the highest peak effective temperature during the SSS (100–110 eV). We showed here that these are all remarkably consistent with theoretical models of hydrogen thermonuclear flashes on a WD with a mass in the range of . Securely identifying such a massive WD is key to our understanding of the larger problem of deciding how some massive WDs lead to explosions as Type Ia SNe (if the core is carbon rich) or undergo an accretion-induced collapse (when the core is composed of O/Ne). At the accretion rate inferred from our theoretical calculations, and assuming (from the duration of the supersoft phase) that about 30% of the accreted material stays on the WD, it will take less than a million years for the core density of the accreting WD to reach values adequate for either an unstable carbon ignition or onset of electron capture (if an O/Ne core). This assumes that mass loss in the inevitable intervening unstable helium flashes is negligible (Kato & Hachisu, 2004).
This remarkable system will certainly undergo additional outbursts, and we hope that the next one (likely in Nov–Dec 2014) will be studied in even more detail, especially in the X-rays where spectra can certainly reveal much more about the WD mass and surface composition. More detailed theoretical modeling is certainly justified, including simulations that resolve the state of the accumulating helium layer.
References
- Arp (1956) Arp, H. C. 1956, AJ, 61, 15
- Barsukova et al. (2011) Barsukova, E., Fabrika, S., Hornoch, K., et al. 2011, The Astronomer’s Telegram, 3725, 1
- Boulade et al. (2003) Boulade, O., Charlot, X., Abbon, P., et al. 2003, in Society of Photo-Optical Instrumentation Engineers (SPIE) Conference Series, Vol. 4841, Instrument Design and Performance for Optical/Infrared Ground-based Telescopes, ed. M. Iye & A. F. M. Moorwood, 72–81
- Burrows et al. (2005) Burrows, D. N., Hill, J. E., Nousek, J. A., et al. 2005, Space Sci. Rev., 120, 165
- Cao et al. (2012) Cao, Y., Kasliwal, M. M., Neill, J. D., et al. 2012, ApJ, 752, 133
- Cassisi et al. (1998) Cassisi, S., Iben, I. J., & Tornambe, A. 1998, ApJ, 496, 376
- Cenko et al. (2006) Cenko, S. B., Fox, D. B., Moon, D.-S., et al. 2006, PASP, 118, 1396
- Darnley et al. (2014) Darnley, M. J., Williams, S. C., Bode, M. F., et al. 2014, ArXiv e-prints, arXiv:1401.2905
- Darnley et al. (2004) Darnley, M. J., Bode, M. F., Kerins, E., et al. 2004, MNRAS, 353, 571
- della Valle & Livio (1995) della Valle, M., & Livio, M. 1995, ApJ, 452, 704
- Denissenkov et al. (2013) Denissenkov, P. A., Herwig, F., Bildsten, L., & Paxton, B. 2013, ApJ, 762, 8
- Di Stefano (2010) Di Stefano, R. 2010, ApJ, 719, 474
- Dolphin (2000) Dolphin, A. E. 2000, PASP, 112, 1383
- Evans et al. (2007) Evans, P. A., Beardmore, A. P., Page, K. L., et al. 2007, A&A, 469, 379
- Faber et al. (2003) Faber, S. M., Phillips, A. C., Kibrick, R. I., et al. 2003, in Society of Photo-Optical Instrumentation Engineers (SPIE) Conference Series, Vol. 4841, Instrument Design and Performance for Optical/Infrared Ground-based Telescopes, ed. M. Iye & A. F. M. Moorwood, 1657–1669
- Gehrels et al. (2004) Gehrels, N., Chincarini, G., Giommi, P., et al. 2004, ApJ, 611, 1005
- Henze et al. (2013a) Henze, M., Ness, J.-U., Bode, M. F., Darnley, M. J., & Williams, S. C. 2013a, The Astronomer’s Telegram, 5627, 1
- Henze et al. (2013b) Henze, M., Ness, J.-U., Bode, M. F., et al. 2013b, The Astronomer’s Telegram, 5633, 1
- Henze et al. (2014) Henze, M., Ness, J.-U., Darnley, M. J., et al. 2014, ArXiv e-prints, arXiv:1401.2904
- Henze et al. (2010) Henze, M., Pietsch, W., Haberl, F., et al. 2010, A&A, 523, A89
- Henze et al. (2013c) —. 2013c, ArXiv e-prints, arXiv:1312.1241
- Hubble (1929) Hubble, E. P. 1929, ApJ, 69, 103
- Kasliwal et al. (2011) Kasliwal, M. M., Cenko, S. B., Kulkarni, S. R., et al. 2011, ApJ, 735, 94
- Kato & Hachisu (2003) Kato, M., & Hachisu, I. 2003, ApJ, 587, L39
- Kato & Hachisu (2004) —. 2004, ApJ, 613, L129
- Korotkiy & Elenin (2010) Korotkiy, S., & Elenin, L. 2010, Central Bureau for Astronomical Telegrams, http://www.cbat.eps.harvard.edu/unconf/followups/J00452885+4154094.html
- Law et al. (2009) Law, N. M., Kulkarni, S. R., Dekany, R. G., et al. 2009, PASP, 121, 1395
- Massey et al. (2006) Massey, P., Olsen, K. A. G., Hodge, P. W., et al. 2006, AJ, 131, 2478
- Miller & Stone (1993) Miller, J. S., & Stone, R. P. S. 1993, Lick Obs. Tech. Rep., 66, Santa Cruz: Lick Obs.
- Nishiyama & Kabashima (2008) Nishiyama, K., & Kabashima, F. 2008, Central Bureau for Astronomical Telegrams, http://www.cbat.eps.harvard.edu/iau/CBAT_M31.html#2008-12a
- Nishiyama & Kabashima (2012) —. 2012, Central Bureau for Astronomical Telegrams, http://www.cbat.eps.harvard.edu/unconf/followups/J00452884+4154095.html
- Ofek et al. (2012) Ofek, E. O., Laher, R., Law, N., et al. 2012, PASP, 124, 62
- Oke et al. (1995) Oke, J. B., Cohen, J. G., Carr, M., et al. 1995, PASP, 107, 375
- Orio et al. (2010) Orio, M., Nelson, T., Bianchini, A., Di Mille, F., & Harbeck, D. 2010, ApJ, 717, 739
- Osterbrock & Ferland (2006) Osterbrock, D. E., & Ferland, G. J. 2006, Astrophysics of gaseous nebulae and active galactic nuclei
- Paxton et al. (2011) Paxton, B., Bildsten, L., Dotter, A., et al. 2011, ApJS, 192, 3
- Paxton et al. (2013) Paxton, B., Cantiello, M., Arras, P., et al. 2013, ApJS, 208, 4
- Piersanti et al. (1999) Piersanti, L., Cassisi, S., Iben, I. J., & Tornambe, A. 1999, ApJ, 521, L59
- Pietsch et al. (2005) Pietsch, W., Fliri, J., Freyberg, M. J., et al. 2005, A&A, 442, 879
- Poole et al. (2008) Poole, T. S., Breeveld, A. A., Page, M. J., et al. 2008, MNRAS, 383, 627
- Predehl & Schmitt (1995) Predehl, P., & Schmitt, J. H. M. M. 1995, A&A, 293, 889
- Prialnik & Kovetz (1995) Prialnik, D., & Kovetz, A. 1995, ApJ, 445, 789
- Rauch et al. (2010) Rauch, T., Ringat, E., & Werner, K. 2010, ArXiv e-prints, arXiv:1011.3628
- Roming et al. (2005) Roming, P. W. A., Kennedy, T. E., Mason, K. O., et al. 2005, Space Sci. Rev., 120, 95
- Sala & Hernanz (2005) Sala, G., & Hernanz, M. 2005, A&A, 439, 1061
- Schaefer (2010) Schaefer, B. E. 2010, ApJS, 187, 275
- Schlafly & Finkbeiner (2011) Schlafly, E. F., & Finkbeiner, D. P. 2011, ApJ, 737, 103
- Shafter et al. (2013) Shafter, A. W., Curtin, C., Pritchet, C. J., Bode, M. F., & Darnley, M. J. 2013, ArXiv e-prints, arXiv:1307.2296
- Shafter et al. (2012) Shafter, A. W., Hornoch, K., Ciardullo, J. V. R., Darnley, M. J., & Bode, M. F. 2012, The Astronomer’s Telegram, 4503, 1
- Shafter et al. (2011) Shafter, A. W., Darnley, M. J., Hornoch, K., et al. 2011, ApJ, 734, 12
- Starrfield et al. (1988) Starrfield, S., Sparks, W. M., & Shaviv, G. 1988, ApJ, 325, L35
- Starrfield et al. (1974) Starrfield, S., Sparks, W. M., & Truran, J. W. 1974, ApJS, 28, 247
- Supper et al. (2001) Supper, R., Hasinger, G., Lewin, W. H. G., et al. 2001, A&A, 373, 63
- Tang et al. (2013) Tang, S., Cao, Y., & Kasliwal, M. M. 2013, The Astronomer’s Telegram, 5607, 1
- Vilardell et al. (2010) Vilardell, F., Ribas, I., Jordi, C., Fitzpatrick, E. L., & Guinan, E. F. 2010, A&A, 509, A70
- White et al. (1995) White, N. E., Giommi, P., Heise, J., Angelini, L., & Fantasia, S. 1995, ApJ, 445, L125
- Williams et al. (2004) Williams, B. F., Garcia, M. R., Kong, A. K. H., et al. 2004, ApJ, 609, 735
- Williams (1992) Williams, R. E. 1992, AJ, 104, 725
- Williams et al. (2013) Williams, S. C., Darnley, M. J., & Bode, M. F. and Shafter, A. W. 2013, The Astronomer’s Telegram, 5611, 1
- Wolf et al. (2013) Wolf, W. M., Bildsten, L., Brooks, J., & Paxton, B. 2013, ApJ, 777, 136
- Yamanaka et al. (2010) Yamanaka, M., Uemura, M., Kawabata, K. S., et al. 2010, PASJ, 62, L37
- Yaron et al. (2005) Yaron, O., Prialnik, D., Shara, M. M., & Kovetz, A. 2005, ApJ, 623, 398
| 111Time of the optical peak. | 222Time of the X-ray peak. | Time since last observed outburst | Source | Reference |
|---|---|---|---|---|
| (UT) | (UT) | (days) | ||
| 2013-12-05 | X-ray (Swift) | this paper; Henze et al. (2014) | ||
| 2013-11-28 | 404 | Optical (PTF) | Tang et al. (2013); this paper | |
| 2012-10-19 | 363 | Optical | Nishiyama & Kabashima (2012); Shafter et al. (2012) | |
| 2011-10-23 | 689 | Optical | Korotkiy & Elenin (2010); Barsukova et al. (2011); this paper | |
| 2009-12-03 | 342 | Optical (PTF) | this paper | |
| 2008-12-26 | Optical | Nishiyama & Kabashima (2008) | ||
| 2001-09-08 | X-ray (Chandra) | Williams et al. (2004) | ||
| 1993-01-11 | 341 | X-ray (ROSAT) | White et al. (1995) | |
| 1992-02-05 | X-ray (ROSAT) | White et al. (1995) |
| MJD | B | V | R | I | g’ | r’ | i’ | Ref. 111References: W13 is Williams et al. 2013; B11 is Barsukova et al. 2011. Others are either PTF photometry or our follow-up using Palomar 60-inch or KeckI/LRIS. | |
|---|---|---|---|---|---|---|---|---|---|
| (days) | (mag) | (mag) | (mag) | (mag) | (mag) | (mag) | (mag) | ||
| 2013, in MJD | |||||||||
| 56624.93 | 0.85 | W13 | |||||||
| 56625.26 | 1.18 | P60 | |||||||
| 56626.15 | 2.07 | PTF and P60 | |||||||
| 56627.32 | 3.24 | P60 | |||||||
| 56630.34 | 6.26 | LRIS | |||||||
| 2011, in MJD | |||||||||
| 55857.1 | 0 | B11; PTF | |||||||
| Filter ID | Observing Time | Days after111Days in parenthesis are the ones assuming there was a missing nova on Nov 12, 2010, which is the middle point between the 2009 and the 2011 novae. | Days before111Days in parenthesis are the ones assuming there was a missing nova on Nov 12, 2010, which is the middle point between the 2009 and the 2011 novae. | Exposure | Vega Magnitude |
| (yyyy-mm-dd hh:mm:ss) | previous nova | next nova | (s) | (mag) | |
| F275W | 2011-01-25 04:56:24 | 418 (74) | 271 | 350 | |
| 2011-01-25 05:20:52 | 418 (74) | 271 | 660 | ||
| 2011-08-31 12:18:37 | 636 (292) | 53 | 350 | ||
| 2011-08-31 12:41:25 | 636 (292) | 53 | 575 | ||
| F336W | 2011-01-25 04:44:43 | 418 (74) | 271 | 550 | |
| 2011-01-25 05:04:54 | 418 (74) | 271 | 800 | ||
| 2011-08-31 12:06:56 | 636 (292) | 53 | 550 | ||
| 2011-08-31 12:27:07 | 636 (292) | 53 | 700 | ||
| F475W | 2010-08-07 12:27:39 | 247 | 431 (87) | 600 | |
| 2010-08-07 12:40:20 | 247 | 431 (87) | 370 | ||
| 2010-08-07 12:49:08 | 247 | 431 (87) | 370 | ||
| 2010-08-07 12:57:56 | 247 | 431 (87) | 370 | ||
| 2012-01-10 02:45:00 | 79 | 284 | 700 | ||
| 2012-01-10 02:59:21 | 79 | 284 | 360 | ||
| 2012-01-10 03:07:59 | 79 | 284 | 360 | ||
| 2012-01-10 03:16:37 | 79 | 284 | 470 | ||
| F814W | 2010-08-07 10:44:08 | 247 | 431 | 350 | |
| 2010-08-07 10:52:38 | 247 | 431 (87) | 700 | ||
| 2010-08-07 11:06:56 | 247 | 431 (87) | 455 | ||
| 2012-01-10 00:23:51 | 79 | 284 | 350 | ||
| 2012-01-10 01:09:03 | 79 | 284 | 800 | ||
| 2012-01-10 01:25:01 | 79 | 284 | 550 |
| Time111Time after the optical peak in 2013. | Temperature ()222All uncertainty ranges are 90% confidence interval. | Radius333The radii of the blackbody were calculated using the best-fit normalizations (i.e., with kpc). () | Blackbody emission444The luminosities (0.3–1 keV) are absorption corrected with an assumption of kpc while the uncertainties were estimated by approximating //. () | (dof) | |
|---|---|---|---|---|---|
| (days) | ( cm-2) | (eV) | (108cm) | (1038 erg s-1) | (1038 erg s-1) |
| Single Absorbed Blackbody with a fixed = cm-2 | |||||
| 5–8 | 1.0 (fixed) | 1.40 (42) | |||
| 8–11 | |||||
| 11–17 | |||||
| Single Absorbed Blackbody with a fixed = cm-2 | |||||
| 5–8 | 1.5 (fixed) | 1.27 (42) | |||
| 8–11 | |||||
| 11–17 | |||||