d+Au Hadron Correlation Measurements at PHENIX
Abstract
In these proceedings, we discuss recent results from d+Au collisions in PHENIX ridge related measurements and their possible hydrodynamic origin. We present the at midrapidity and measurements of the pseudorapidity dependence of the ridge, distinguishing between the d-going and Au-going directions. We investigate the possible geometrical origin by comparing in d+Au to that in p+Pb, Au+Au and Pb+Pb collisions. Future plans to clarify the role of geometry in small collision systems at RHIC are discussed.
keywords:
In heavy ion collisions at both RHIC and the LHC the properties of the created matter are understood to be described by hydrodynamics with a very small shear viscosity to entropy density ratio, [1]. The value of is constrained via measurements of Fourier coefficients of the azimuthal distribution of particles ( where is the order of the Fourier coefficient). Measurements of the particle pair correlations in heavy ion collisions have been well described by products of the same at the appropriate [2, 3]. One prominent feature of these correlation functions is the so-called ridge, a long range in pseudorapidity, small correlation resulting from the sum of positive from hydrodynamic flow [4, 2].
Surprisingly, a similar long range correlation was observed in very high multiplicity p+p collisions at the LHC [5] where a hydrodynamical system was not generally expected to be created. Recently, at the LHC a double ridge structure, with long range correlations at 0 and has been observed also in p+Pb collisions at 5.02 TeV [6, 7]. This feature can be largely described by a modulation. Extractions of yielded values with a similar magnitude to those in heavy ion collisions [6, 7]. Obviously, such similar behavior between A+A and p(d)+A collisions is suggestive of a similar physical origin. This was quite surprising considering the small size of the overlap region between the two nuclei in p(d)+A collisions. The observation of a double ridge structure, of course, does not prove hydrodynamic behavior; in fact, similar effects were expected within the Color Glass Condensate model [8]. Therefore, experimentally, it is of great interest to investigate the nature of the correlations observed in p(d)+A and to compare measurements in p(d)+A to what is known from A+A collisions. Approximately 1.6 billion d+Au collisions at = 200 GeV was taken in 2008. Here we report on measurements by the PHENIX collaboration using that data.
1 Midrapidty Correlations &
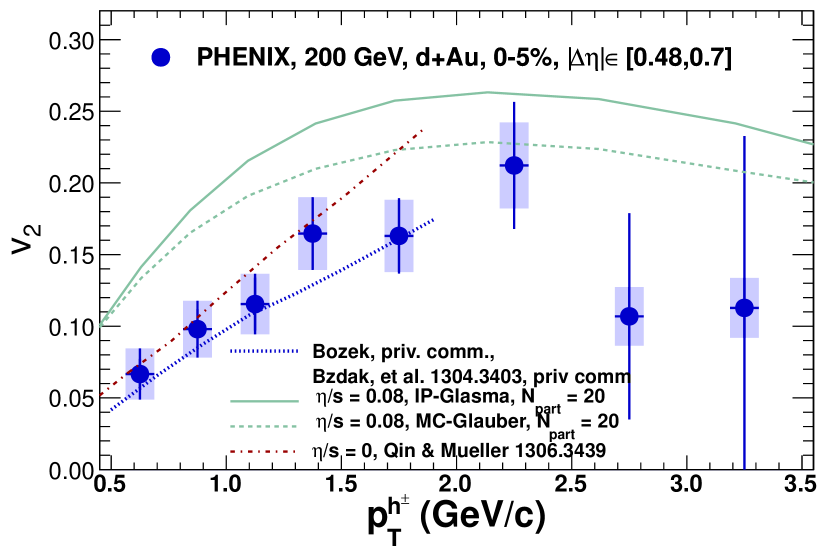
PHENIX has measured the of charged hadrons at midrapidity in central d+Au collisions using two-particle correlations. Correlations from jets are removed under the assumption that the conditional yields are unmodified from peripheral d+Au events. Resulting values as a function of are shown in Fig. 1 [13]. The rises with reaching a maximal value of about 15%. Also shown on the plot are hydrodynamic calculations from three groups [9, 10, 11, 12]. All three calculations agree well with the data. Refs. [9, 10, 11] use = 0.08, while the calculation in Ref. [12] is for ideal hydrodynamics.
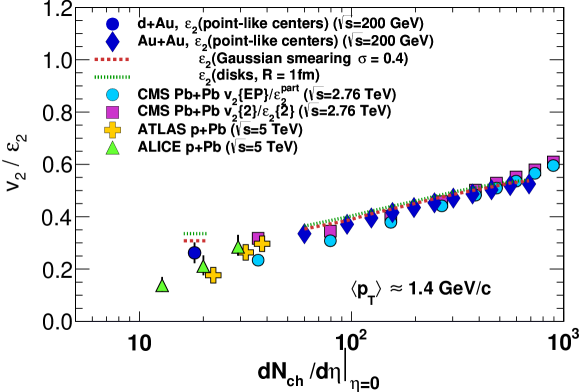
In order to further investigate the possible relationship between the geometry of the collision system and the observed we compare the values (at 1.4 GeV/c) scaled by estimates of the initial state second order eccentricity, . The values are shown as a function of at mid-rapidity in Fig. 2 for d+Au, p+Pb, Au+Au and Pb+Pb collisions at both RHIC and the LHC. The values are from a Glauber Monte Carlo calculation; is consistent between central d+Au and midcentral p+Pb (systems which have a similar ) despite the factor of 25 difference in collision energy per nucleon pair. The value in central d+Au collisions is approximately 50% larger than in in midcentral p+Pb. The ratio rises as a function and follows approximately a common trend between the four collisions systems.
There are uncertainties within the Glauber Monte Carlo calculation of the spatial eccentricity, , values. We have investigated the uncertainty due to the modeling of the nucleons within the calculation. The default values take the nucleons as point-like centers and we have also investigated treating the nucleons as disks with a radius of 1 fm and as Gaussians with = 0.4 in both d+Au and Au+Au collisions. In d+Au collisions these variations change by approximately 30% at maximum; in Au+Au the effect is much smaller.
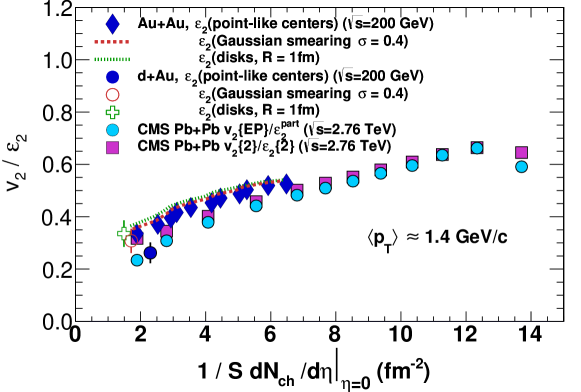
In addition to the multiplicity scaling shown in Fig. 2 it is also of interest to investigate the scaling of the same data as a function of the charged particle multiplicity divided by , a measure of the overlap area between the two nucleons which is defined as where . This scaling has been found to approximately hold between RHIC and the LHC for integrated values [16]. In Fig. 3 is plotted as a function of at 1.4 GeV/c. We observe this scaling to hold in d+Au, Au+Au and Pb+Pb collisions. The same three assumptions about the nucleon representation within the Glauber model are used here as well. In this case, the different nucleon representations affect both the values of and .
2 Rapidity Separated Correlations
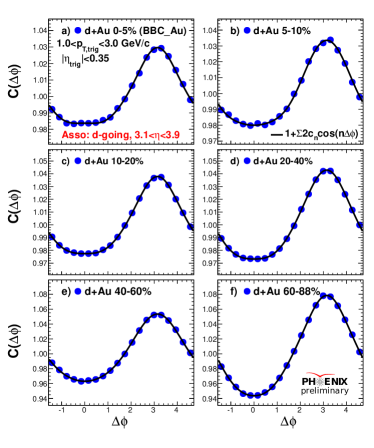
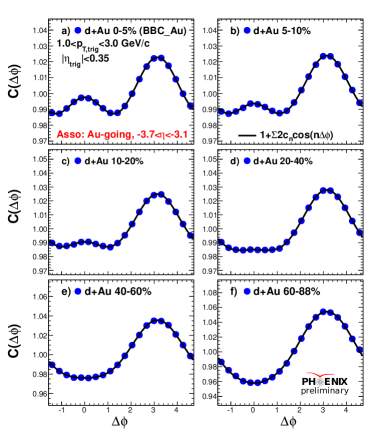
In order to investigate whether the correlations seen at midrapidity are long-range in pseudorapidity and, if so, what the pseudorapidity dependence is, we have measured correlations between mid-rapidity hadrons (0.35) and electromagnetic energy in the Au-going and d-going Muon Piston Calorimeters (MPC) [17]. These calorimeters are positioned on either side of the interaction region at 3.1 3.7 (3.9) in the Au-going (d-going) direction. With this large separation, no same-side jet correlations remain.
In d+Au collisions there is a large asymmetry in the number of particles produced at large pseudorapidity between the -going and Au-going directions. In the most central 20% of the collisions approximately four times as many charged particles are produced in the Au-going direction as in the -going direction [18].
The azimuthal correlations for both the d-going and Au-going MPC with midrapidity tracks are shown in Fig. 4 as a function of centrality. In all cases the dominant feature of the correlation functions is the peak at =. This peak has contributions from jet correlations and momentum conservation.
In the d-going correlations no near side correlations are seen at any centrality. In the Au-going correlations, peripheral correlations look similar to those observed in the d-going direction. However, in central collisions a positive correlation at 0 is observed for the 20% most central events. The magnitude of the correlation relative to the peak at = increases toward more central events. This provides evidence that the observed at midrapidity is from a long-range pseudorapidity correlation.
3 Future Investigations
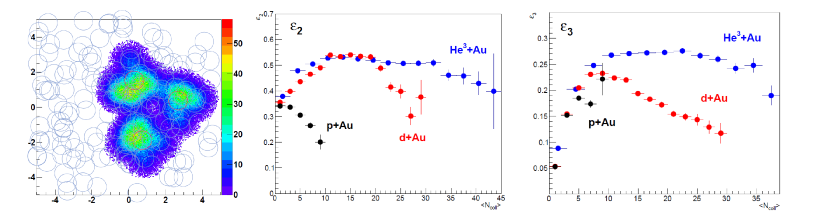
While many of the existing measurements in p+Pb and d+Au are suggestive of hydrodynamic behavior in d+Au collisions, further investigations of this surprising effect are certainly in order. No significant in d+Au collisions was observed [13]. This is consistent with the large driven by the elongated shape of the deuteron and, as discussed above, the values extracted from the d+Au data are much smaller than and consistent with zero. If the geometry of the deuteron causes the observed values then it could be possible to induce a large by using a projectile nucleus with a large . PHENIX has proposed running 3He+Au, d+Au and p+Au collisions at RHIC in 2015 to directly investigate the relationship between and geometry.
Fig. 5 shows the results of Glauber Monte Carlo calculations of 3He+Au, d+Au and p+Au collisions. The value decreases with an increasing number of binary nucleon-nucleon collisions () in p+Au collisions while for d+Au and 3He+Au collisions it increases up to a maximal value of approximately 0.5. The in 3He+Au collisions reaches 0.25 at about 10 collisions and remains approximately constant for all more central collisions. In the 0-5% central d+Au collisions studied here the mean value is about 18, thus the value in central 3He+Au collisions will be approximately 40% bigger than in d+Au collisions.
Additionally, in the 2015 run PHENIX will have additional tracking, compared to the measurements presented here, provided by the silicon vertex detectors. This will provides larger coverage around midrapidity. Thus, it will be possible to determine whether the increased in 3He+Au collisions leads to a correspondingly large as a conclusive test of the role of geometry in generating the observed in p+A and d+A collisions. Recently, hydrodynamic calculations of in p+Au, d+Au and 3He+Au collisions have been done [19] and they provide support for pursing this program.
4 Conclusions
Over the past year, there has been much excitement around the novel effects observed in p+Pb and d+Au collisions. We have presented PHENIX results on the d+Au at midrapidity and shown new results using our MPC detector which provide the first evidence for long range ( 3.5) correlations at small in d+Au collisions. We have also discussed future plans to constrain the role of geometry in small collision systems by varying the shape of the projectile nucleus in order to significantly vary the value of the collision region. The collision system variation possible at RHIC make feature studies in this direction especially exciting.
References
- [1] A. Adare, et al., Phys.Rev.Lett. 107 (2011) 252301. arXiv:1105.3928.
- [2] K. Aamodt, et al., Phys.Lett. B708 (2012) 249–264. arXiv:1109.2501.
- [3] G. Aad, et al., Phys.Rev. C86 (2012) 014907. arXiv:1203.3087.
- [4] B. Abelev, et al., Long range rapidity correlations and jet production in high energy nuclear collisions, Phys.Rev. C80 (2009) 064912. arXiv:0909.0191, doi:10.1103/PhysRevC.80.064912.
- [5] V. Khachatryan, et al., JHEP 1009 (2010) 091. arXiv:1009.4122.
- [6] B. Abelev, et al., Phys.Lett. B719 (2013) 29–41. arXiv:1212.2001.
- [7] G. Aad, et al., Phys.Rev.Lett. 110 (2013) 182302. arXiv:1212.5198.
- [8] K. Dusling, R. Venugopalan, Phys.Rev. D87 (2013) 054014. arXiv:1211.3701.
- [9] P. Bozek, Phys.Rev. C85 (2012) 014911. arXiv:1112.0915.
- [10] P. Bozek, private communication.
- [11] A. Bzdak, B. Schenke, P. Tribedy, R. VenugopalanarXiv:1304.3403.
- [12] G.-Y. Qin, B. MullerarXiv:1306.3439.
- [13] A. Adare, et al., Phys.Rev.Lett.arXiv:1303.1794, doi:10.1103/PhysRevLett.111.212301.
- [14] S. Adler, et al., Phys.Rev. C71 (2005) 034908. arXiv:nucl-ex/0409015, doi:10.1103/PhysRevC.71.049901,10.1103/PhysRevC.71.034908.
- [15] R. A. Lacey, A. Taranenko, R. Wei, N. Ajitanand, J. Alexander, et al., Phys.Rev. C82 (2010) 034910. arXiv:1005.4979, doi:10.1103/PhysRevC.82.034910.
- [16] S. Chatrchyan, et al., Phys.Rev. C87 (2013) 014902. arXiv:1204.1409, doi:10.1103/PhysRevC.87.014902.
- [17] A. Adare, et al., Phys.Rev.Lett. 107 (2011) 172301. arXiv:1105.5112.
- [18] B. Back, et al., Phys.Rev. C72 (2005) 031901. arXiv:nucl-ex/0409021, doi:10.1103/PhysRevC.72.031901.
- [19] J. Nagle, A. Adare, S. Beckman, T. Koblesky, J. O. Koop, et al.arXiv:1312.4565.