Multi Terminal Probabilistic Compressed Sensing

Saeid Haghighatshoar
EPFL, Lausanne, Switzerland
Email: saeid.haghighatshoar@epfl.ch
Abstract

In this paper, the ‘Approximate Message Passing’ (AMP) algorithm, initially developed for compressed sensing of signals under i.i.d. Gaussian measurement matrices, has been extended to a multi-terminal setting (MAMP algorithm). It has been shown that similar to its single terminal counterpart, the behavior of MAMP algorithm is fully characterized by a ‘State Evolution’ (SE) equation for large block-lengths. This equation has been used to obtain the rate-distortion curve of a multi-terminal memoryless source. It is observed that by spatially coupling the measurement matrices, the rate-distortion curve of MAMP algorithm undergoes a phase transition, where the measurement rate region corresponding to a low distortion (approximately zero distortion) regime is fully characterized by the joint and conditional Rényi information dimension (RID) of the multi-terminal source. This measurement rate region is very similar to the rate region of the Slepian-Wolf distributed source coding problem where the RID plays a role similar to the discrete entropy.

Simulations have been done to investigate the empirical behavior of MAMP algorithm. It is observed that simulation results match very well with predictions of SE equation for reasonably large block-lengths.

Index Terms:
Approximate message passing (AMP), Gaussian measurement matrices, Spatial coupling, Multi-Terminal Approximate Message Passing (MAMP), Rényi information dimension, Multi-terminal (distributed) compressed sensing.

I Introduction

Let (xn,yn)superscript𝑥𝑛superscript𝑦𝑛(x^{n},y^{n}) be a realization of a two terminal memoryless sources (X,Y)𝑋𝑌(X,Y) with a probability distribution pX,Ysubscript𝑝𝑋𝑌p_{X,Y} over 2superscript2\mathbb{R}^{2} and assume that one is interested to recover the signal in both terminals (xn,yn)superscript𝑥𝑛superscript𝑦𝑛(x^{n},y^{n}) by taking sufficiently many linear measurements 𝒖=Axn𝒖𝐴superscript𝑥𝑛\boldsymbol{u}=Ax^{n} and 𝒗=Byn𝒗𝐵superscript𝑦𝑛\boldsymbol{v}=By^{n}, where A𝐴A and B𝐵B denote the measurement matrices in TXsubscript𝑇𝑋T_{X} and TYsubscript𝑇𝑌T_{Y} respectively. In particular, it is implicitly assumed that the measurements are taken separately from each terminal whereas for the recovery, one has access to the measurements (𝒖,𝒗)𝒖𝒗(\boldsymbol{u},\boldsymbol{v}) from both terminals.

This problem in its general multi-terminal form is ubiquitous in different distributed processing systems and specially in ad hoc sensor networks where a collection of sensors measure a distributed environmental signal like temperature, humidity, etc. One can imagine a particular sensor as a terminal which takes a collection of linear measurements and transmits the gathered data to a data fusion center by routing them via the other sensors. Because of limited communication and low processing power of sensors, it is difficult to take joint measurements from two or several different terminals even if they are very closed to one another. Therefore, one can reasonably assume that the measurements are taken separately from each terminal and processed jointly in a data fusion center to recover the distributed signal. Usually there is a high correlation among terminals and one can exploit this redundancy to reduce the required number of measurements. In particular, in a very low energy scenario like a sensor network this results in a saving in the energy consumption of devices which in turn, increases the life time of the network.

There are two different kinds of correlation that should be considered: temporal and spatial. In a scenario like sensor networks, temporal correlations result because of the slow changes of the natural phenomenon like temperature, humidity, etc. Temporal correlations usually can be moderated by suitable sampling time and preprocessing of the signal before transmission. Spatial correlations are more important and much more difficult to deal with. If the sensors are densely distributed in the environment for precise data acquisition, the resulting measurements from different terminals will be highly redundant thus the network energy resources are wasted without any significant gain. Therefore, it is always desirable to reduce the number of sensors to a minimum possible and still be able to recover the environmental distributed signal. Compared with a densely distributed sensor network, this is as if no sensor is assigned to some of the terminals and as a result the measurement rate from those terminals is 00. In both cases, one needs to characterize the required measurement rate region of the terminals for low-distortion recovery.

In this paper, we address a two terminal scenario for a memoryless distributed source (Xn,Yn)superscript𝑋𝑛superscript𝑌𝑛(X^{n},Y^{n}). Memoryless property of the source implies that there is no temporal correlation between samples of the signals in each terminal. The spatial correlation between the sources is modeled by assuming that the samples of the signals (Xi,Yi)subscript𝑋𝑖subscript𝑌𝑖(X_{i},Y_{i}) are generated by a probability distribution pX,Ysubscript𝑝𝑋𝑌p_{X,Y}. The extension to more than two terminals is also straightforward.

This problem has been vastly studied under different signal structures and recovery algorithms (in particular [1, 2]) as an extension of the traditional single terminal compressed sensing introduced in [3, 4]. Specially, it has been attempted to make a connection between multi-terminal compressed sensing and the distributed source coding (Slepian-Wolf) counterpart in information theory (please refer to [5] for extra refrences).

A closely related work to our paper, is the ‘analog to analog’ (A2A) compression problem first studied in [6], where it was proved that under some regularity conditions on encoder and decoder, the required measurement rate in order to recover the source with a negligible block error probability is given by the upper Rényi information dimension (RID) of the source. The results was extended to prove the noise stability of the decoder [7]. In [8, 9], it was proved that under a much weaker entropic distortion measure (compared with block error probability or MSE), a measurement rate of at least Rényi information dimension is still necessary to roughly capture the information of the source. Moreover, the polarization idea [10, 11] was exploited to construct a family of deterministically truncated Hadamard matrices that universally capture the information of all probability distributions with a given RID.

In [12], using the spatially coupled Gaussian matrices and the prediction of [13, 14], it was rigorously proved that the measurement rate as large as the RID of the source is sufficient to stably recover the source with a negligible mean square error (MSE) by running a feasible complexity approximate message passing algorithm (AMP) first developed in [15] and rigorously analyzed in [16].

In [9], a characterization was given of the the measurement rate region of a memoryless multi-terminal signal in order to fully capture the information of the source in terms of the joint and conditional RID which was in spirit very similar to Slepian-Wolf (S&W) region for distributed source coding with the discrete entropy replaced by the RID and this region was also shown to be tight.

In this paper, we extend the results in [12, 9] by developing a multi-terminal variant of AMP (MAMP) algorithm to study the multi-terminal compressed sensing of a well-behaved class of probability distributions (linearly correlated signals) for which the joint and the conditional RID’s are well-defined. We use random Gaussian matrices (independent across different terminals) to take measurements and run the MAMP algorithm to reconstruct the source. We prove that the behavior of MAMP algorithm can be fully characterized by a two dimensional state111In general the number of states is equal to the number of terminals. and at each iteration, this state changes according to an explicit state evolution (SE) equation. We use this SE equation to obtain the rate distortion curve of the source, where we use the mean square error (MSE) as the distortion measure. We also show that after spatially coupling of measurement matrices in each terminal, the low distortion measurement rate region can be fully characterized by the joint and the conditional RID’s as predicted by [9].

II Rényi Information Dimension and Linearly Correlated Multi-terminal Sources

Let X𝑋X be a scalar random variable with a probability distribution pXsubscript𝑝𝑋p_{X} over \mathbb{R}. The upper and lower RID of X𝑋X are defined by

d¯(pX)=d¯(X)=lim supqH([X]q)log2(q),¯𝑑subscript𝑝𝑋¯𝑑𝑋subscriptlimit-supremum𝑞𝐻subscriptdelimited-[]𝑋𝑞subscript2𝑞\displaystyle\overline{d}(p_{X})=\overline{d}(X)=\limsup_{q\to\infty}\frac{H([X]_{q})}{\log_{2}(q)},
d¯(pX)=d¯(X)=lim infqH([X]q)log2(q),¯𝑑subscript𝑝𝑋¯𝑑𝑋subscriptlimit-infimum𝑞𝐻subscriptdelimited-[]𝑋𝑞subscript2𝑞\displaystyle\underline{d}(p_{X})=\underline{d}(X)=\liminf_{q\to\infty}\frac{H([X]_{q})}{\log_{2}(q)},

where for x𝑥x\in\mathbb{R} and q𝑞q\in\mathbb{N}, [x]q=qxqsubscriptdelimited-[]𝑥𝑞𝑞𝑥𝑞[x]_{q}=\frac{\lfloor qx\rfloor}{q} denotes the quantization of x𝑥x by spacing 1q1𝑞\frac{1}{q} and where x=max{k:kx}𝑥:𝑘𝑘𝑥\lfloor x\rfloor=\max\{k\in\mathbb{Z}:k\leq x\}. If both limits coincide then we define d(X)=d¯(X)=d¯(X)𝑑𝑋¯𝑑𝑋¯𝑑𝑋d(X)=\overline{d}(X)=\underline{d}(X). A parameter related to the RID is the MMSE dimension of X𝑋X defined in [17]. Let

mmse(s)=𝔼(X𝔼(X|Y))2,Y=sX+Z,formulae-sequencemmse𝑠𝔼superscript𝑋𝔼conditional𝑋𝑌2𝑌𝑠𝑋𝑍\displaystyle\text{mmse}(s)=\mathbb{E}(X-\mathbb{E}(X|Y))^{2},\ \ Y=\sqrt{s}X+Z,

where Z𝖭(0,1)similar-to𝑍𝖭01Z\sim{\mathsf{N}(0,1)} is a Gaussian random variable independent of X𝑋X. The upper and lower MMSE dimension of X𝑋X are defined by

D¯(pX)=D¯(X)=lim supssmmse(s)¯𝐷subscript𝑝𝑋¯𝐷𝑋subscriptlimit-supremum𝑠𝑠mmse𝑠\displaystyle\overline{D}(p_{X})=\overline{D}(X)=\limsup_{s\to\infty}s\ \text{mmse}(s)
D¯(pX)=D¯(X)=lim infssmmse(s),¯𝐷subscript𝑝𝑋¯𝐷𝑋subscriptlimit-infimum𝑠𝑠mmse𝑠\displaystyle\underline{D}(p_{X})=\underline{D}(X)=\liminf_{s\to\infty}s\ \text{mmse}(s),

and if both limits coincide then we define D(X)=D¯(X)=D¯(X)𝐷𝑋¯𝐷𝑋¯𝐷𝑋D(X)=\overline{D}(X)=\underline{D}(X). In [17], it was proved that if H(X)<𝐻𝑋H(\lfloor X\rfloor)<\infty then

D¯(X)d¯(X)d¯(X)D¯(X).¯𝐷𝑋¯𝑑𝑋¯𝑑𝑋¯𝐷𝑋\displaystyle\underline{D}(X)\leq\underline{d}(X)\leq\overline{d}(X)\leq\overline{D}(X).

Hence, if D(X)𝐷𝑋D(X) exists so does d(X)𝑑𝑋d(X) and they are equal. By Lebesgue decomposition theorem, any probability distribution like pXsubscript𝑝𝑋p_{X} can be decomposed as a convex combination of continuous, discrete and singular parts, i.e.

pX=αcpc+αdpd+αsps,subscript𝑝𝑋subscript𝛼𝑐subscript𝑝𝑐subscript𝛼𝑑subscript𝑝𝑑subscript𝛼𝑠subscript𝑝𝑠\displaystyle p_{X}=\alpha_{c}p_{c}+\alpha_{d}p_{d}+\alpha_{s}p_{s},

where αc+αd+αs=1subscript𝛼𝑐subscript𝛼𝑑subscript𝛼𝑠1\alpha_{c}+\alpha_{d}+\alpha_{s}=1 and pc,pdsubscript𝑝𝑐subscript𝑝𝑑p_{c},p_{d} and pssubscript𝑝𝑠p_{s} denote the continuous, discrete and the singular part of the distribution. Rényi proved that if αs=0subscript𝛼𝑠0\alpha_{s}=0, namely if pXsubscript𝑝𝑋p_{X} has no singular part, then d(pX)𝑑subscript𝑝𝑋d(p_{X}) is well defined and is equal to αcsubscript𝛼𝑐\alpha_{c}, the weight of the continuous part [18]. Moreover, it was proved in [17] that if αs=0subscript𝛼𝑠0\alpha_{s}=0 then D(pX)𝐷subscript𝑝𝑋D(p_{X}) also exists and is equal to d(X)=αc𝑑𝑋subscript𝛼𝑐d(X)=\alpha_{c}.

For simplicity, we will restrict ourselves to the space of linearly correlated random variables introduced in [9], where a k𝑘k dimensional random vector S𝑆S is linearly correlated if there is a sequence of independent non singular variables Znsuperscript𝑍𝑛Z^{n} and a k×n𝑘𝑛k\times n matrix A𝐴A such that S=AZn𝑆𝐴superscript𝑍𝑛S=AZ^{n}. This space is rich enough for most of the applications. Furthermore, over this space it is possible to give a full characterization of joint and conditional RID as in [9]. Appendix A contains a brief overview of linearly correlated signals and how to compute their joint and conditional RID’s.

III Statement of the Results

III-A Gaussian Measurement Matrices

Let n𝑛n\in\mathbb{N} and let (xn,yn)={(xi,yi)}i=1nsuperscript𝑥𝑛superscript𝑦𝑛superscriptsubscriptsubscript𝑥𝑖subscript𝑦𝑖𝑖1𝑛(x^{n},y^{n})=\{(x_{i},y_{i})\}_{i=1}^{n} be a realization of a two terminal memoryless source (X,Y)𝑋𝑌(X,Y) with a probability distribution pX,Ysubscript𝑝𝑋𝑌p_{X,Y}. Let 𝒖=Axn𝒖𝐴superscript𝑥𝑛\boldsymbol{u}=Ax^{n} and 𝒗=Byn𝒗𝐵superscript𝑦𝑛\boldsymbol{v}=By^{n} be the measurement vectors, where A𝐴A is an mx×nsubscript𝑚𝑥𝑛m_{x}\times n and B𝐵B is an my×nsubscript𝑚𝑦𝑛m_{y}\times n matrix whose components are i.i.d. zero mean Gaussian random variables with variance 1mx1subscript𝑚𝑥\frac{1}{m_{x}} and 1my1subscript𝑚𝑦\frac{1}{m_{y}} respectively. We define ρx=mxnsubscript𝜌𝑥subscript𝑚𝑥𝑛\rho_{x}=\frac{m_{x}}{n} and ρy=mynsubscript𝜌𝑦subscript𝑚𝑦𝑛\rho_{y}=\frac{m_{y}}{n} as the measurement rates of the two terminals.
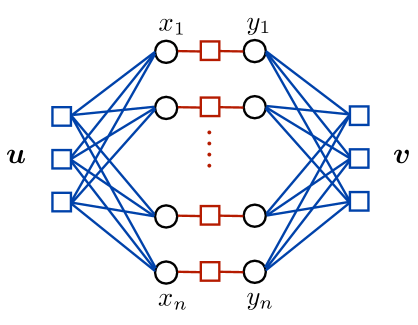
In order to recover the initial signal (xn,yn)superscript𝑥𝑛superscript𝑦𝑛(x^{n},y^{n}), we propose the following joint message passing algorithm which is an extension of the single terminal message passing proposed in [15]. We assign a variable node to each component of xnsuperscript𝑥𝑛x^{n} and ynsuperscript𝑦𝑛y^{n} and a check node to every measurement. Figure 1 shows the resulting graphical model, where the internal check node between variable nodes (xi,yi)subscript𝑥𝑖subscript𝑦𝑖(x_{i},y_{i}) show the correlation resulted because of the joint distribution pX,Ysubscript𝑝𝑋𝑌p_{X,Y}.

Refer to caption
Figure 1: Graphical Model Representation for Two Terminal Compressed Sensing. The external check nodes correspond to measurements whereas the internal check nodes between xnsuperscript𝑥𝑛x^{n} and ynsuperscript𝑦𝑛y^{n} represent the joint distribution pX,Ysubscript𝑝𝑋𝑌p_{X,Y} between (Xi,Yi)subscript𝑋𝑖subscript𝑌𝑖(X_{i},Y_{i}).

Let a,b[mx]𝑎𝑏delimited-[]subscript𝑚𝑥a,b\in[m_{x}] and i,j[n]𝑖𝑗delimited-[]𝑛i,j\in[n] be the indices for check and variable nodes in TXsubscript𝑇𝑋T_{X} and let c,d[my]𝑐𝑑delimited-[]subscript𝑚𝑦c,d\in[m_{y}] and k,l[n]𝑘𝑙delimited-[]𝑛k,l\in[n] denote the corresponding indices for TYsubscript𝑇𝑌T_{Y}. The multi-terminal message passing is given by

raitsubscriptsuperscript𝑟𝑡𝑎𝑖\displaystyle r^{t}_{a\to i} =uaj[n]\iAajxjat,absentsubscript𝑢𝑎subscript𝑗\delimited-[]𝑛𝑖subscript𝐴𝑎𝑗subscriptsuperscript𝑥𝑡𝑗𝑎\displaystyle=u_{a}-\sum_{j\in[n]\backslash i}A_{aj}x^{t}_{j\to a}, (1)
scktsubscriptsuperscript𝑠𝑡𝑐𝑘\displaystyle s^{t}_{c\to k} =vcl[n]\kBclylct,absentsubscript𝑣𝑐subscript𝑙\delimited-[]𝑛𝑘subscript𝐵𝑐𝑙subscriptsuperscript𝑦𝑡𝑙𝑐\displaystyle=v_{c}-\sum_{l\in[n]\backslash k}B_{cl}y^{t}_{l\to c}, (2)
xiat+1subscriptsuperscript𝑥𝑡1𝑖𝑎\displaystyle x^{t+1}_{i\to a} =ηtx(b[mx]\aAbirbit,d[my]Bdisdit),absentsubscriptsuperscript𝜂𝑥𝑡subscript𝑏\delimited-[]subscript𝑚𝑥𝑎subscript𝐴𝑏𝑖subscriptsuperscript𝑟𝑡𝑏𝑖subscript𝑑delimited-[]subscript𝑚𝑦subscript𝐵𝑑𝑖subscriptsuperscript𝑠𝑡𝑑𝑖\displaystyle=\eta^{x}_{t}(\sum_{b\in[m_{x}]\backslash a}A_{bi}r^{t}_{b\to i},\sum_{d\in[m_{y}]}B_{di}s^{t}_{d\to i}), (3)
ykct+1subscriptsuperscript𝑦𝑡1𝑘𝑐\displaystyle y^{t+1}_{k\to c} =ηty(b[mx]Abkrbkt,d[my]\cBkdsdkt),absentsubscriptsuperscript𝜂𝑦𝑡subscript𝑏delimited-[]subscript𝑚𝑥subscript𝐴𝑏𝑘subscriptsuperscript𝑟𝑡𝑏𝑘subscript𝑑\delimited-[]subscript𝑚𝑦𝑐subscript𝐵𝑘𝑑subscriptsuperscript𝑠𝑡𝑑𝑘\displaystyle=\eta^{y}_{t}(\sum_{b\in[m_{x}]}A_{bk}r^{t}_{b\to k},\sum_{d\in[m_{y}]\backslash c}B_{kd}s^{t}_{d\to k}), (4)

Notice that the only interaction between the messages in TXsubscript𝑇𝑋T_{X} and TYsubscript𝑇𝑌T_{Y} is via the threshold functions ηtxsubscriptsuperscript𝜂𝑥𝑡\eta^{x}_{t} and ηtysubscriptsuperscript𝜂𝑦𝑡\eta^{y}_{t}. In particular, if ηtxsubscriptsuperscript𝜂𝑥𝑡\eta^{x}_{t} only depends on the first argument and if ηtysubscriptsuperscript𝜂𝑦𝑡\eta^{y}_{t} only depends on the second argument, this message passing algorithms is transformed to two independent message passing algorithms one running on TXsubscript𝑇𝑋T_{X} and the other on TYsubscript𝑇𝑌T_{Y}. As the measurement matrices A𝐴A and B𝐵B are dense matrices with columns with 2subscript2\ell_{2} norms close to 111, it is possible to approximate the above message passing algorithm. This has been done heuristically in Appendix B. The resulting MAMP (multi-terminal approximate message passing) algorithm is as follows initialized with r1=0,s1=0formulae-sequencesuperscript𝑟10superscript𝑠10r^{-1}=0,s^{-1}=0 and x0=y0=0superscript𝑥0superscript𝑦00x^{0}=y^{0}=0:

rt=𝒖Axt1ηtx(Art1+xt1,Bst1+yt1)ρxrt1,superscript𝑟𝑡𝒖𝐴superscript𝑥𝑡delimited-⟨⟩subscript1subscriptsuperscript𝜂𝑥𝑡superscript𝐴superscript𝑟𝑡1superscript𝑥𝑡1superscript𝐵superscript𝑠𝑡1superscript𝑦𝑡1subscript𝜌𝑥superscript𝑟𝑡1\displaystyle r^{t}=\boldsymbol{u}-Ax^{t}-\frac{\left\langle\partial_{1}\eta^{x}_{t}(A^{*}r^{t-1}+x^{t-1},B^{*}s^{t-1}+y^{t-1})\right\rangle}{\rho_{x}}r^{t-1}, (5)
st=𝒗Byt2ηty(Art1+xt1,Bst1+yt1)ρxst1,superscript𝑠𝑡𝒗𝐵superscript𝑦𝑡delimited-⟨⟩subscript2subscriptsuperscript𝜂𝑦𝑡superscript𝐴superscript𝑟𝑡1superscript𝑥𝑡1superscript𝐵superscript𝑠𝑡1superscript𝑦𝑡1subscript𝜌𝑥superscript𝑠𝑡1\displaystyle s^{t}=\boldsymbol{v}-By^{t}-\frac{\left\langle\partial_{2}\eta^{y}_{t}(A^{*}r^{t-1}+x^{t-1},B^{*}s^{t-1}+y^{t-1})\right\rangle}{\rho_{x}}s^{t-1}, (6)
xt+1=ηtx(Art+xt,Bst+yt),superscript𝑥𝑡1subscriptsuperscript𝜂𝑥𝑡superscript𝐴superscript𝑟𝑡superscript𝑥𝑡superscript𝐵superscript𝑠𝑡superscript𝑦𝑡\displaystyle x^{t+1}=\eta^{x}_{t}(A^{*}r^{t}+x^{t},B^{*}s^{t}+y^{t}), (7)
yt+1=ηty(Art+xt,Bst+yt),superscript𝑦𝑡1subscriptsuperscript𝜂𝑦𝑡superscript𝐴superscript𝑟𝑡superscript𝑥𝑡superscript𝐵superscript𝑠𝑡superscript𝑦𝑡\displaystyle y^{t+1}=\eta^{y}_{t}(A^{*}r^{t}+x^{t},B^{*}s^{t}+y^{t}), (8)

where rtmxsuperscript𝑟𝑡superscriptsubscript𝑚𝑥r^{t}\in\mathbb{R}^{m_{x}} and stmysuperscript𝑠𝑡superscriptsubscript𝑚𝑦s^{t}\in\mathbb{R}^{m_{y}} are the residual terms and xt,ytnsuperscript𝑥𝑡superscript𝑦𝑡superscript𝑛x^{t},y^{t}\in\mathbb{R}^{n} are estimates of the signals at time t𝑡t and where for a function f:2:𝑓superscript2f:\mathbb{R}^{2}\to\mathbb{R}, 1fsubscript1𝑓\partial_{1}f and 2fsubscript2𝑓\partial_{2}f denote the partial derivative of f𝑓f with respect to the first and the second argument respectively. Moreover, with some abuse of notation, we assume that ηt(gl,hl)=(ηt(g1,h1),,ηt(gl,hl))subscript𝜂𝑡superscript𝑔𝑙superscript𝑙subscript𝜂𝑡subscript𝑔1subscript1subscript𝜂𝑡subscript𝑔𝑙subscript𝑙\eta_{t}(g^{l},h^{l})=(\eta_{t}(g_{1},h_{1}),\dots,\eta_{t}(g_{l},h_{l})) applies component-wise. Also for an n𝑛n dimensional vector unsuperscript𝑢𝑛u^{n}, un=1ni=1nuidelimited-⟨⟩superscript𝑢𝑛1𝑛superscriptsubscript𝑖1𝑛subscript𝑢𝑖\left\langle u^{n}\right\rangle=\frac{1}{n}\sum_{i=1}^{n}u_{i} denotes the average of the elements of unsuperscript𝑢𝑛u^{n}.

It is also important to mention the appearance of Onsager terms in the Equations (5) and (6) as also mentioned in [15, 16]. This term can be considered as a second order correction for the mean field approximation of the message passing algorithm whose addition removes the correlation that exists between the fixed measurement matrices A𝐴A and B𝐵B and the estimated signal (xt,yt)superscript𝑥𝑡superscript𝑦𝑡(x^{t},y^{t}) in the thermodynamic limit as the system size n𝑛n tends to infinity, which specially allows to completely describe the system state with a state evolution (SE) equation.

Theorem 1.

Let (xn,yn)superscript𝑥𝑛superscript𝑦𝑛(x^{n},y^{n}) be a realization of a memoryless source and assume that (xt,yt)t0subscriptsuperscript𝑥𝑡superscript𝑦𝑡𝑡0(x^{t},y^{t})_{t\geq 0} is the output of the MAMP algorithm as in Equations (5)-(8) with Lipschitz continuous threshold functions ηtxsubscriptsuperscript𝜂𝑥𝑡\eta^{x}_{t} and ηtysubscriptsuperscript𝜂𝑦𝑡\eta^{y}_{t}. Let ψ:2:𝜓superscript2\psi:\mathbb{R}^{2}\to\mathbb{R} be a pseudo-Lipschitz function. Asymptotically as n𝑛n tends to infinity

1ni=1nψ(xi,xit)1𝑛superscriptsubscript𝑖1𝑛𝜓subscript𝑥𝑖subscriptsuperscript𝑥𝑡𝑖\displaystyle\frac{1}{n}\sum_{i=1}^{n}\psi(x_{i},x^{t}_{i}) 𝔼ψ(X,ηtx(X+τxtZx,Y+τytZy)),absent𝔼𝜓𝑋subscriptsuperscript𝜂𝑥𝑡𝑋subscriptsuperscript𝜏𝑡𝑥subscript𝑍𝑥𝑌subscriptsuperscript𝜏𝑡𝑦subscript𝑍𝑦\displaystyle\to\mathbb{E}\psi(X,\eta^{x}_{t}(X+\sqrt{\tau^{t}_{x}}Z_{x},Y+\sqrt{\tau^{t}_{y}}Z_{y})),
1ni=1nψ(yi,yit)1𝑛superscriptsubscript𝑖1𝑛𝜓subscript𝑦𝑖subscriptsuperscript𝑦𝑡𝑖\displaystyle\frac{1}{n}\sum_{i=1}^{n}\psi(y_{i},y^{t}_{i}) 𝔼ψ(Y,ηty(X+τxtZx,Y+τytZy))absent𝔼𝜓𝑌subscriptsuperscript𝜂𝑦𝑡𝑋subscriptsuperscript𝜏𝑡𝑥subscript𝑍𝑥𝑌subscriptsuperscript𝜏𝑡𝑦subscript𝑍𝑦\displaystyle\to\mathbb{E}\psi(Y,\eta^{y}_{t}(X+\sqrt{\tau^{t}_{x}}Z_{x},Y+\sqrt{\tau^{t}_{y}}Z_{y}))

almost surely, where (τxt,τyt)t0subscriptsuperscriptsubscript𝜏𝑥𝑡superscriptsubscript𝜏𝑦𝑡𝑡0(\tau_{x}^{t},\tau_{y}^{t})_{t\geq 0} satisfy the equation

τxt+1subscriptsuperscript𝜏𝑡1𝑥\displaystyle\tau^{t+1}_{x} =σx2+1ρx𝔼(Xηtx(X+τxtZx,Y+τytZy))2,absentsuperscriptsubscript𝜎𝑥21subscript𝜌𝑥𝔼superscript𝑋subscriptsuperscript𝜂𝑥𝑡𝑋subscriptsuperscript𝜏𝑡𝑥subscript𝑍𝑥𝑌subscriptsuperscript𝜏𝑡𝑦subscript𝑍𝑦2\displaystyle=\sigma_{x}^{2}+\frac{1}{\rho_{x}}\mathbb{E}(X-\eta^{x}_{t}(X+\sqrt{\tau^{t}_{x}}Z_{x},Y+\sqrt{\tau^{t}_{y}}Z_{y}))^{2},
τyt+1subscriptsuperscript𝜏𝑡1𝑦\displaystyle\tau^{t+1}_{y} =σy2+1ρy𝔼(Yηty(X+τxtZx,Y+τytZy))2,absentsuperscriptsubscript𝜎𝑦21subscript𝜌𝑦𝔼superscript𝑌subscriptsuperscript𝜂𝑦𝑡𝑋subscriptsuperscript𝜏𝑡𝑥subscript𝑍𝑥𝑌subscriptsuperscript𝜏𝑡𝑦subscript𝑍𝑦2\displaystyle=\sigma_{y}^{2}+\frac{1}{\rho_{y}}\mathbb{E}(Y-\eta^{y}_{t}(X+\sqrt{\tau^{t}_{x}}Z_{x},Y+\sqrt{\tau^{t}_{y}}Z_{y}))^{2},

with τx(1)=τy(1)=subscriptsuperscript𝜏1𝑥subscriptsuperscript𝜏1𝑦\tau^{(-1)}_{x}=\tau^{(-1)}_{y}=\infty, with Zx,Zysubscript𝑍𝑥subscript𝑍𝑦Z_{x},Z_{y} zero mean unit variance Gaussian variables independent of each other and X𝑋X and Y𝑌Y and with σx2superscriptsubscript𝜎𝑥2\sigma_{x}^{2} and σy2superscriptsubscript𝜎𝑦2\sigma_{y}^{2} denoting the measurement noise variance in X𝑋X and Y𝑌Y terminals.

Proof.

Proof follows from the Bolthausen’s conditioning technique used in [16] with the only difference that one should apply the conditioning to both terminals instead of a single terminal. ∎

Remark 1.

Theorem 1 provides a single letter characterization of the asymptotic behavior of the MAMP, in the sense that to estimate a specific variable (Xk,Yk)subscript𝑋𝑘subscript𝑌𝑘(X_{k},Y_{k}) the effect of all other variables is equivalent to adding a Gaussian noise with variance (τtx,τty)superscriptsubscript𝜏𝑡𝑥subscriptsuperscript𝜏𝑦𝑡(\tau_{t}^{x},\tau^{y}_{t}). Moreover, replacing ψ(a,b)=(ab)2𝜓𝑎𝑏superscript𝑎𝑏2\psi(a,b)=(a-b)^{2} one gets the mean square error (MSE) of the estimator

xt+1x22n𝔼(Xηtx(X+τxtZx,Y+τytZy))2,superscriptsubscriptnormsuperscript𝑥𝑡1𝑥22𝑛𝔼superscript𝑋subscriptsuperscript𝜂𝑥𝑡𝑋subscriptsuperscript𝜏𝑡𝑥subscript𝑍𝑥𝑌subscriptsuperscript𝜏𝑡𝑦subscript𝑍𝑦2\displaystyle\frac{\|x^{t+1}-x\|_{2}^{2}}{n}\to\mathbb{E}(X-\eta^{x}_{t}(X+\sqrt{\tau^{t}_{x}}Z_{x},Y+\sqrt{\tau^{t}_{y}}Z_{y}))^{2},
yt+1y22n𝔼(Yηty(X+τxtZx,Y+τytZy))2.superscriptsubscriptnormsuperscript𝑦𝑡1𝑦22𝑛𝔼superscript𝑌subscriptsuperscript𝜂𝑦𝑡𝑋subscriptsuperscript𝜏𝑡𝑥subscript𝑍𝑥𝑌subscriptsuperscript𝜏𝑡𝑦subscript𝑍𝑦2\displaystyle\frac{\|y^{t+1}-y\|_{2}^{2}}{n}\to\mathbb{E}(Y-\eta^{y}_{t}(X+\sqrt{\tau^{t}_{x}}Z_{x},Y+\sqrt{\tau^{t}_{y}}Z_{y}))^{2}.

We will also consider a noiseless case where σx=σy=0subscript𝜎𝑥subscript𝜎𝑦0\sigma_{x}=\sigma_{y}=0 which using the SE equation implies that the empirical error after t𝑡t iteration is given by ρxτxtsubscript𝜌𝑥superscriptsubscript𝜏𝑥𝑡\rho_{x}\tau_{x}^{t} and ρyτytsubscript𝜌𝑦superscriptsubscript𝜏𝑦𝑡\rho_{y}\tau_{y}^{t}. One can also simply check that choosing (ηtx,ηty)subscriptsuperscript𝜂𝑥𝑡subscriptsuperscript𝜂𝑦𝑡(\eta^{x}_{t},\eta^{y}_{t}) to be the MMSE estimator minimizes the resulting error. We will always assume that the distribution of the signal is known and we will use the MMSE estimator for (ηtx,ηty)subscriptsuperscript𝜂𝑥𝑡subscriptsuperscript𝜂𝑦𝑡(\eta^{x}_{t},\eta^{y}_{t}), thus the resulting SE equation is

τxt+1subscriptsuperscript𝜏𝑡1𝑥\displaystyle\tau^{t+1}_{x} =1ρxmmse(X|X+τxtZx,Y+τytZy)absent1subscript𝜌𝑥mmseconditional𝑋𝑋subscriptsuperscript𝜏𝑡𝑥subscript𝑍𝑥𝑌subscriptsuperscript𝜏𝑡𝑦subscript𝑍𝑦\displaystyle=\frac{1}{\rho_{x}}{\text{mmse}}(X|X+\sqrt{\tau^{t}_{x}}Z_{x},Y+\sqrt{\tau^{t}_{y}}Z_{y}) (9)
τyt+1subscriptsuperscript𝜏𝑡1𝑦\displaystyle\tau^{t+1}_{y} =1ρymmse(Y|X+τxtZx,Y+τytZy).absent1subscript𝜌𝑦mmseconditional𝑌𝑋subscriptsuperscript𝜏𝑡𝑥subscript𝑍𝑥𝑌subscriptsuperscript𝜏𝑡𝑦subscript𝑍𝑦\displaystyle=\frac{1}{\rho_{y}}{\text{mmse}}(Y|X+\sqrt{\tau^{t}_{x}}Z_{x},Y+\sqrt{\tau^{t}_{y}}Z_{y}). (10)

The behavior of MAMP depends on the stable set of the SE equation. Proposition 1 states that for the special choice of MMSE estimators for ηtxsubscriptsuperscript𝜂𝑥𝑡\eta^{x}_{t} and ηtysubscriptsuperscript𝜂𝑦𝑡\eta^{y}_{t}, this stable set is a fixed point.

Proposition 1.

For a given ρx,ρysubscript𝜌𝑥subscript𝜌𝑦\rho_{x},\rho_{y} and starting from τx(1)=τy(1)=superscriptsubscript𝜏𝑥1superscriptsubscript𝜏𝑦1\tau_{x}^{(-1)}=\tau_{y}^{(-1)}=\infty, the state vector (τxt,τyt)subscriptsuperscript𝜏𝑡𝑥subscriptsuperscript𝜏𝑡𝑦(\tau^{t}_{x},\tau^{t}_{y}) given by SE equations in (9), (10) converges to a well-defined fixed point.

Proof.

It is sufficient to prove that the resulting sequence is non-increasing thus converging to a well-defined fixed point. We use induction on t𝑡t. For t=0𝑡0t=0, this obviously holds because τx0𝔼(X2)ρx<τx(1)=subscriptsuperscript𝜏0𝑥𝔼superscript𝑋2subscript𝜌𝑥superscriptsubscript𝜏𝑥1\tau^{0}_{x}\leq\frac{\mathbb{E}(X^{2})}{\rho_{x}}<\tau_{x}^{(-1)}=\infty and the same holds for τy0superscriptsubscript𝜏𝑦0\tau_{y}^{0}. Moreover, one can simply check that from the Data Processing inequality (τxt+1,τyt+1)subscriptsuperscript𝜏𝑡1𝑥subscriptsuperscript𝜏𝑡1𝑦(\tau^{t+1}_{x},\tau^{t+1}_{y}) are increasing function of (τxt,τyt)subscriptsuperscript𝜏𝑡𝑥subscriptsuperscript𝜏𝑡𝑦(\tau^{t}_{x},\tau^{t}_{y}). Therefore, if from the induction hypothesis τxtτxt1superscriptsubscript𝜏𝑥𝑡superscriptsubscript𝜏𝑥𝑡1\tau_{x}^{t}\leq\tau_{x}^{t-1} and τytτyt1superscriptsubscript𝜏𝑦𝑡superscriptsubscript𝜏𝑦𝑡1\tau_{y}^{t}\leq\tau_{y}^{t-1}, it immediately results that τxt+1τxtsuperscriptsubscript𝜏𝑥𝑡1superscriptsubscript𝜏𝑥𝑡\tau_{x}^{t+1}\leq\tau_{x}^{t} and τyt+1τytsuperscriptsubscript𝜏𝑦𝑡1superscriptsubscript𝜏𝑦𝑡\tau_{y}^{t+1}\leq\tau_{y}^{t}. ∎

III-B Spatially Coupled Gaussian Measurement Matrices

In the single terminal case, it has been already observed that with traditional Gaussian matrices, the the required measurement rate for complete recovery of the signal is far from the optimal rate given by the RID and spatial coupling is necessary to reduce the required measurement rate down to RID. The situation is very similar to coding theory where the BP threshold resulted from message passing algorithm is different from the optimal MAP threshold and extra spatial coupling is necessary to approach the optimal rate [19].

We briefly describe the structure of a spatially coupled measurement matrix as in [12]. We consider a band diagonal weighting matrix W𝑊W of dimension Lr×Lcsubscript𝐿𝑟subscript𝐿𝑐L_{r}\times L_{c} which is roughly row stochastic, i.e. 12cWr,c212subscript𝑐subscript𝑊𝑟𝑐2\frac{1}{2}\leq\sum_{c}W_{r,c}\leq 2. In order to obtain the final measurement matrix we replace every entry Wr,csubscript𝑊𝑟𝑐W_{r,c} by a i.i.d. M×N𝑀𝑁M\times N Gaussian matrix with entries having variance Wr,cMsubscript𝑊𝑟𝑐𝑀\frac{W_{r,c}}{M}, thus the final matrix will be m×n𝑚𝑛m\times n where m=MLr𝑚𝑀subscript𝐿𝑟m=ML_{r} and n=NLc𝑛𝑁subscript𝐿𝑐n=NL_{c} and the resulting measurement rate is ρ=mn=MLrNLc𝜌𝑚𝑛𝑀subscript𝐿𝑟𝑁subscript𝐿𝑐\rho=\frac{m}{n}=\frac{ML_{r}}{NL_{c}}. Figure 2, borrowed from [12], shows a typical structure of a band diagonal matrix.
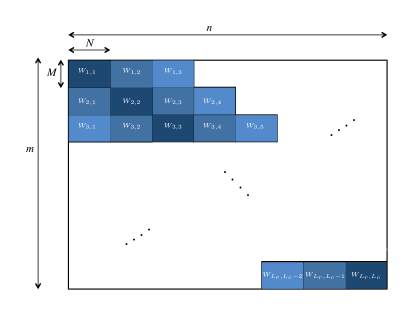
Refer to caption
Figure 2: The Structure of A Band Diagonal Gaussian Matrix with Non-homogenous Entry Variances.

Each component of Wr,csubscript𝑊𝑟𝑐W_{r,c} corresponds to one block containing an M×N𝑀𝑁M\times N matrix. Following the notations of [12], let 𝖢={1,2,,Lc}𝖢12subscript𝐿𝑐\mathsf{C}=\{1,2,\dots,L_{c}\} and 𝖱={1,2,,Lr}𝖱12subscript𝐿𝑟\mathsf{R}=\{1,2,\dots,L_{r}\} denote the row and column indices of these blocks. Let us define the following operators

mmsex(sx,sy)=mmse(X|sxX+Zx,syY+Zy),subscriptmmse𝑥subscript𝑠𝑥subscript𝑠𝑦mmseconditional𝑋subscript𝑠𝑥𝑋subscript𝑍𝑥subscript𝑠𝑦𝑌subscript𝑍𝑦\displaystyle{\text{mmse}}_{x}(s_{x},s_{y})={\text{mmse}}(X|\sqrt{s_{x}}X+Z_{x},\sqrt{s_{y}}Y+Z_{y}),
mmsey(sx,sy)=mmse(Y|sxX+Zx,syY+Zy).subscriptmmse𝑦subscript𝑠𝑥subscript𝑠𝑦mmseconditional𝑌subscript𝑠𝑥𝑋subscript𝑍𝑥subscript𝑠𝑦𝑌subscript𝑍𝑦\displaystyle{\text{mmse}}_{y}(s_{x},s_{y})={\text{mmse}}(Y|\sqrt{s_{x}}X+Z_{x},\sqrt{s_{y}}Y+Z_{y}).

In the two terminal case, for simplicity, we will use the same weight matrix in both terminals and the final measurement rate for each terminal can be controlled by the aspect ratio δx=MxNxsubscript𝛿𝑥subscript𝑀𝑥subscript𝑁𝑥\delta_{x}=\frac{M_{x}}{N_{x}} and δy=MyNysubscript𝛿𝑦subscript𝑀𝑦subscript𝑁𝑦\delta_{y}=\frac{M_{y}}{N_{y}} of the corresponding sub matrices.

Definition 1.

For a roughly stochastic matrix of dimension Lr×Lcsubscript𝐿𝑟subscript𝐿𝑐L_{r}\times L_{c}, the state evolution sequence {ϕx(t),ψx(t)}t0subscriptsuperscriptitalic-ϕ𝑥𝑡superscript𝜓𝑥𝑡𝑡0\{\phi^{x}(t),\psi^{x}(t)\}_{t\geq 0} and {ϕy(t),ψy(t)}t0subscriptsuperscriptitalic-ϕ𝑦𝑡superscript𝜓𝑦𝑡𝑡0\{\phi^{y}(t),\psi^{y}(t)\}_{t\geq 0}, ϕo(t)=(ϕao(t))a𝖱,ψo(t)=(ψio(t))i𝖢formulae-sequencesuperscriptitalic-ϕ𝑜𝑡subscriptsubscriptsuperscriptitalic-ϕ𝑜𝑎𝑡𝑎𝖱superscript𝜓𝑜𝑡subscriptsubscriptsuperscript𝜓𝑜𝑖𝑡𝑖𝖢\phi^{o}(t)=(\phi^{o}_{a}(t))_{a\in\mathsf{R}},\psi^{o}(t)=(\psi^{o}_{i}(t))_{i\in\mathsf{C}} with o{x,y}𝑜𝑥𝑦o\in\{x,y\} is defied as follows ψio(0)=,i𝖢formulae-sequencesubscriptsuperscript𝜓𝑜𝑖0𝑖𝖢\psi^{o}_{i}(0)=\infty,\ \ i\in\mathsf{C} and for all t0𝑡0t\geq 0,

ϕao(t)subscriptsuperscriptitalic-ϕ𝑜𝑎𝑡\displaystyle\phi^{o}_{a}(t) =σo2+1δoi𝖢Wa,iψio(t),absentsuperscriptsubscript𝜎𝑜21subscript𝛿𝑜subscript𝑖𝖢subscript𝑊𝑎𝑖subscriptsuperscript𝜓𝑜𝑖𝑡\displaystyle=\sigma_{o}^{2}+\frac{1}{\delta_{o}}\sum_{i\in\mathsf{C}}W_{a,i}\psi^{o}_{i}(t), (11)
ψio(t+1)subscriptsuperscript𝜓𝑜𝑖𝑡1\displaystyle\psi^{o}_{i}(t+1) =mmseo(b𝖱Wb,iϕbx(t)1,b𝖱Wb,iϕby(t)1).absentsubscriptmmse𝑜subscript𝑏𝖱subscript𝑊𝑏𝑖superscriptsubscriptitalic-ϕ𝑏𝑥superscript𝑡1subscript𝑏𝖱subscript𝑊𝑏𝑖superscriptsubscriptitalic-ϕ𝑏𝑦superscript𝑡1\displaystyle={\text{mmse}}_{o}(\sum_{b\in\mathsf{R}}W_{b,i}\phi_{b}^{x}(t)^{-1},\sum_{b\in\mathsf{R}}W_{b,i}\phi_{b}^{y}(t)^{-1}). (12)

where σo2superscriptsubscript𝜎𝑜2\sigma_{o}^{2} is the variance of the measurement noise and δo=MoNosubscript𝛿𝑜subscript𝑀𝑜subscript𝑁𝑜\delta_{o}=\frac{M_{o}}{N_{o}} is the measurement rate of the sub-matrices for terminal o{x,y}𝑜𝑥𝑦o\in\{x,y\}.

Quantities ψi(t)subscript𝜓𝑖𝑡\psi_{i}(t) and ϕa(t)subscriptitalic-ϕ𝑎𝑡\phi_{a}(t) correspond to the asymptotic MSE of the MAMP. In particular, ψi(t)subscript𝜓𝑖𝑡\psi_{i}(t) is the asymptotic MSE of the variables located in block i𝖢𝑖𝖢i\in\mathsf{C} and ϕa(t)subscriptitalic-ϕ𝑎𝑡\phi_{a}(t) is the noise variance in the residual terms corresponding to row a𝖱𝑎𝖱a\in\mathsf{R} as we will explain later. Using {ϕ,ψ}italic-ϕ𝜓\{\phi,\psi\} sequence for each terminal it is possible to define the following MAMP algorithm. Let Qtsuperscript𝑄𝑡Q^{t} be an m×n𝑚𝑛m\times n whose i,j𝑖𝑗i,j component is given by

Qijt=ϕr(t)1k=1LrWkcϕk(t)1subscriptsuperscript𝑄𝑡𝑖𝑗subscriptitalic-ϕ𝑟superscript𝑡1superscriptsubscript𝑘1subscript𝐿𝑟subscript𝑊𝑘𝑐subscriptitalic-ϕ𝑘superscript𝑡1\displaystyle Q^{t}_{ij}=\frac{\phi_{r}(t)^{-1}}{\sum_{k=1}^{L_{r}}W_{kc}\phi_{k}(t)^{-1}} (13)

where r𝑟r is the row index of the measurement i𝑖i and c𝑐c is the column index of the variable j𝑗j, thus it is a block constant matrix. We also define the MMSE threshold functions as

ηt,ix(gi,hi)=𝔼(X|X+six(t)1Zx=gi,Y+siy(t)1Zy=hi),subscriptsuperscript𝜂𝑥𝑡𝑖subscript𝑔𝑖subscript𝑖𝔼formulae-sequenceconditional𝑋𝑋subscriptsuperscript𝑠𝑥𝑖superscript𝑡1subscript𝑍𝑥subscript𝑔𝑖𝑌subscriptsuperscript𝑠𝑦𝑖superscript𝑡1subscript𝑍𝑦subscript𝑖\displaystyle\eta^{x}_{t,i}(g_{i},h_{i})=\mathbb{E}(X|X+s^{x}_{i}(t)^{-1}Z_{x}=g_{i},Y+s^{y}_{i}(t)^{-1}Z_{y}=h_{i}),

with sio(t)=u𝖱Wu,cϕuo(t)1subscriptsuperscript𝑠𝑜𝑖𝑡subscript𝑢𝖱subscript𝑊𝑢𝑐subscriptsuperscriptitalic-ϕ𝑜𝑢superscript𝑡1s^{o}_{i}(t)=\sum_{u\in\mathsf{R}}W_{u,c}\phi^{o}_{u}(t)^{-1}, where c𝑐c is the column index of variable i𝑖i. MMSE estimator for TYsubscript𝑇𝑌T_{Y} is defined similarly. We also assume that both of these estimator apply component wise, i.e. ηt(gl,hl)=(ηt,1(g1,h1),,ηt,l(gl,hl))subscript𝜂𝑡superscript𝑔𝑙superscript𝑙subscript𝜂𝑡1subscript𝑔1subscript1subscript𝜂𝑡𝑙subscript𝑔𝑙subscript𝑙\eta_{t}(g^{l},h^{l})=(\eta_{t,1}(g_{1},h_{1}),\dots,\eta_{t,l}(g_{l},h_{l})). With these notations the MAMP can be written as follows

xt+1superscript𝑥𝑡1\displaystyle x^{t+1} =ηtx(xt+(QxtA)rxt,yt+(QytB)ryt),absentsubscriptsuperscript𝜂𝑥𝑡superscript𝑥𝑡superscriptdirect-productsuperscriptsubscript𝑄𝑥𝑡𝐴superscriptsubscript𝑟𝑥𝑡superscript𝑦𝑡superscriptdirect-productsuperscriptsubscript𝑄𝑦𝑡𝐵superscriptsubscript𝑟𝑦𝑡\displaystyle=\eta^{x}_{t}(x^{t}+(Q_{x}^{t}\odot A)^{*}r_{x}^{t},y^{t}+(Q_{y}^{t}\odot B)^{*}r_{y}^{t}), (14)
rxtsuperscriptsubscript𝑟𝑥𝑡\displaystyle r_{x}^{t} =𝒖Axt+bxtrxt1,absent𝒖𝐴superscript𝑥𝑡direct-productsuperscriptsubscript𝑏𝑥𝑡superscriptsubscript𝑟𝑥𝑡1\displaystyle=\boldsymbol{u}-Ax^{t}+b_{x}^{t}\odot r_{x}^{t-1}, (15)
yt+1superscript𝑦𝑡1\displaystyle y^{t+1} =ηty(xt+(QxtA)rxt,yt+(QytB)ryt),absentsubscriptsuperscript𝜂𝑦𝑡superscript𝑥𝑡superscriptdirect-productsuperscriptsubscript𝑄𝑥𝑡𝐴superscriptsubscript𝑟𝑥𝑡superscript𝑦𝑡superscriptdirect-productsuperscriptsubscript𝑄𝑦𝑡𝐵superscriptsubscript𝑟𝑦𝑡\displaystyle=\eta^{y}_{t}(x^{t}+(Q_{x}^{t}\odot A)^{*}r_{x}^{t},y^{t}+(Q_{y}^{t}\odot B)^{*}r_{y}^{t}), (16)
rytsuperscriptsubscript𝑟𝑦𝑡\displaystyle r_{y}^{t} =𝒗Byt+bytryt1,absent𝒗𝐵superscript𝑦𝑡direct-productsuperscriptsubscript𝑏𝑦𝑡superscriptsubscript𝑟𝑦𝑡1\displaystyle=\boldsymbol{v}-By^{t}+b_{y}^{t}\odot r_{y}^{t-1}, (17)

where A𝐴A and B𝐵B denote the spatially coupled measurement matrices, 𝒖=Ax,𝒗=Byformulae-sequence𝒖𝐴𝑥𝒗𝐵𝑦\boldsymbol{u}=Ax,\boldsymbol{v}=By are the measurements, rxsubscript𝑟𝑥r_{x} and rysubscript𝑟𝑦r_{y} are residual terms, Qxsubscript𝑄𝑥Q_{x} and Qysubscript𝑄𝑦Q_{y} are defined according to Equation (13) and bxsubscript𝑏𝑥b_{x} and bysubscript𝑏𝑦b_{y} are defined as follows. Let C(c)𝐶𝑐C(c) denote all the variables i𝑖i with column index c𝖢𝑐𝖢c\in\mathsf{C} and let

1ηtxc=1ηtx(xit+((QxtA)rxt)i,yit+((QytB)ryt)i\displaystyle\left\langle\partial_{1}\eta^{x}_{t}\right\rangle_{c}=\left\langle\partial_{1}\eta^{x}_{t}(x_{i}^{t}+((Q_{x}^{t}\odot A)^{*}r_{x}^{t})_{i},y_{i}^{t}+((Q_{y}^{t}\odot B)^{*}r_{y}^{t})_{i}\right\rangle

where the average is taken over all variables belonging to the the column block c𝑐c. We define bxtsuperscriptsubscript𝑏𝑥𝑡b_{x}^{t} as a column vector of length m𝑚m which takes the same value for all components belonging to a row block r𝖱𝑟𝖱r\in\mathsf{R} and is defined as follows

bx,it=1δxc𝖢Wri,cQ~ai,ct11ηt1xc,superscriptsubscript𝑏𝑥𝑖𝑡1subscript𝛿𝑥subscript𝑐𝖢subscript𝑊subscript𝑟𝑖𝑐subscriptsuperscript~𝑄𝑡1subscript𝑎𝑖𝑐subscriptdelimited-⟨⟩subscript1subscriptsuperscript𝜂𝑥𝑡1𝑐\displaystyle b_{x,i}^{t}=\frac{1}{\delta_{x}}\sum_{c\in\mathsf{C}}W_{r_{i},c}\tilde{Q}^{t-1}_{a_{i},c}\left\langle\partial_{1}\eta^{x}_{t-1}\right\rangle_{c},

where risubscript𝑟𝑖r_{i} is the row block that i𝑖i belongs to and Q~tsuperscript~𝑄𝑡\tilde{Q}^{t} is a Lr×Lcsubscript𝐿𝑟subscript𝐿𝑐L_{r}\times L_{c} matrix defined by Q~r,ct=Qx,ijtsubscriptsuperscript~𝑄𝑡𝑟𝑐subscriptsuperscript𝑄𝑡𝑥𝑖𝑗\tilde{Q}^{t}_{r,c}=Q^{t}_{x,\,ij} for any i𝑖i that belong to the row block r𝑟r and any column that belongs to the column block c𝑐c. Notice that Qtsuperscript𝑄𝑡Q^{t} itself is also block constant therefore it is not important which i𝑖i or j𝑗j is taken from the block. A similar expression holds for the bytsuperscriptsubscript𝑏𝑦𝑡b_{y}^{t} by replacing 1ηxtsubscript1superscriptsubscript𝜂𝑥𝑡\partial_{1}\eta_{x}^{t} by 2ηytsubscript2superscriptsubscript𝜂𝑦𝑡\partial_{2}\eta_{y}^{t}, Qxtsuperscriptsubscript𝑄𝑥𝑡Q_{x}^{t} by Qytsuperscriptsubscript𝑄𝑦𝑡Q_{y}^{t} and δxsubscript𝛿𝑥\delta_{x} by δysubscript𝛿𝑦\delta_{y}.

Using a similar steps as in [12], it is possible to show that the performance of the MAMP algorithm can be described by the state evolution given in Equation (11) and (12) where the number of states is equal to 2(Lr+Lc)2subscript𝐿𝑟subscript𝐿𝑐2(L_{r}+L_{c}).

Theorem 2.

Let (xn,yn)superscript𝑥𝑛superscript𝑦𝑛(x^{n},y^{n}) be a two terminal signal and let 𝐮=Axn𝐮𝐴superscript𝑥𝑛\boldsymbol{u}=Ax^{n} and 𝐯=Byn𝐯𝐵superscript𝑦𝑛\boldsymbol{v}=By^{n}, where A𝐴A and B𝐵B are spatially coupled matrices with the same weight matrix W𝑊W. Let (xt,yt)superscript𝑥𝑡superscript𝑦𝑡(x^{t},y^{t}) be the output of MAMP algorithm in Equations (14)-(17), where {ϕo(t),ψo(t)}t0,o{x,y}subscriptsuperscriptitalic-ϕ𝑜𝑡superscript𝜓𝑜𝑡formulae-sequence𝑡0𝑜𝑥𝑦\{\phi^{o}(t),\psi^{o}(t)\}_{t\geq 0,o\in\{x,y\}} is obtained from the SE equation (11)-(12). Asymptotically, as Nx,Nysubscript𝑁𝑥subscript𝑁𝑦N_{x},N_{y} go to infinity

1NxjC(i)(xjxjt)2ψix(t),1NyjC(i)(yjyjt)2ψiy(t).formulae-sequence1subscript𝑁𝑥subscript𝑗𝐶𝑖superscriptsubscript𝑥𝑗subscriptsuperscript𝑥𝑡𝑗2subscriptsuperscript𝜓𝑥𝑖𝑡1subscript𝑁𝑦subscript𝑗𝐶𝑖superscriptsubscript𝑦𝑗subscriptsuperscript𝑦𝑡𝑗2subscriptsuperscript𝜓𝑦𝑖𝑡\displaystyle\frac{1}{N_{x}}\sum_{j\in C(i)}(x_{j}-x^{t}_{j})^{2}\to\psi^{x}_{i}(t),\frac{1}{N_{y}}\sum_{j\in C(i)}(y_{j}-y^{t}_{j})^{2}\to\psi^{y}_{i}(t).

Based on the results proved in [12] for the single terminal case and the lower bound provided in [9], it is possible to give the following characterization for the achievable measurement rate region in the multi-terminal case.

Theorem 3.

Let (X,Y)𝑋𝑌(X,Y) be a linearly correlated two terminal source and let ρx,ρy[0,1]subscript𝜌𝑥subscript𝜌𝑦01\rho_{x},\rho_{y}\in[0,1] be such that

ρx>d(X|Y),ρy>d(Y|X),ρx+ρy>d(X,Y).formulae-sequencesubscript𝜌𝑥𝑑conditional𝑋𝑌formulae-sequencesubscript𝜌𝑦𝑑conditional𝑌𝑋subscript𝜌𝑥subscript𝜌𝑦𝑑𝑋𝑌\displaystyle\rho_{x}>d(X|Y),\,\rho_{y}>d(Y|X),\,\rho_{x}+\rho_{y}>d(X,Y). (18)

There is an ensemble of spatially coupled measurement matrices that separately captures the signals in the two terminals and an MAMP algorithm that jointly recovers the signals in each terminal with a negligible distortion.

Remark 2.

The optimal measurement rate region given by Equation (18), is very similar to the Slepian-Wolf rate region for distributed source coding where the RID in the compressed sensing setting plays a role similar to the discrete entropy in distributed source coding.

Proof.

We prove that the corner points (d(X),d(Y|X))𝑑𝑋𝑑conditional𝑌𝑋(d(X),d(Y|X)) and (d(Y),d(X|Y))𝑑𝑌𝑑conditional𝑋𝑌(d(Y),d(X|Y)) are achievable under MAMP. In the single terminal case, If ρx>d(X)subscript𝜌𝑥𝑑𝑋\rho_{x}>d(X) asymptotically the signal in TXsubscript𝑇𝑋T_{X} can be recovered with a negligible distortion. In multi-terminal case, if we consider only the terms related to TXsubscript𝑇𝑋T_{X}, from Equation (11)-(12), we have

ϕax(t)subscriptsuperscriptitalic-ϕ𝑥𝑎𝑡\displaystyle\phi^{x}_{a}(t) =1ρxi𝖢Wa,iψix(t),absent1subscript𝜌𝑥subscript𝑖𝖢subscript𝑊𝑎𝑖subscriptsuperscript𝜓𝑥𝑖𝑡\displaystyle=\frac{1}{\rho_{x}}\sum_{i\in\mathsf{C}}W_{a,i}\psi^{x}_{i}(t),
ψix(t+1)subscriptsuperscript𝜓𝑥𝑖𝑡1\displaystyle\psi^{x}_{i}(t+1) =mmsex(b𝖱Wb,iϕbx(t)1,b𝖱Wb,iϕby(t)1).absentsubscriptmmse𝑥subscript𝑏𝖱subscript𝑊𝑏𝑖superscriptsubscriptitalic-ϕ𝑏𝑥superscript𝑡1subscript𝑏𝖱subscript𝑊𝑏𝑖superscriptsubscriptitalic-ϕ𝑏𝑦superscript𝑡1\displaystyle={\text{mmse}}_{x}(\sum_{b\in\mathsf{R}}W_{b,i}\phi_{b}^{x}(t)^{-1},\sum_{b\in\mathsf{R}}W_{b,i}\phi_{b}^{y}(t)^{-1}).

As ηx,ηysubscript𝜂𝑥subscript𝜂𝑦\eta_{x},\eta_{y} are MMSE estimators, from Data Processing inequality, one can check that mmsex(sx,sy)subscriptmmse𝑥subscript𝑠𝑥subscript𝑠𝑦{\text{mmse}}_{x}(s_{x},s_{y}) and mmsey(sx,sy)subscriptmmse𝑦subscript𝑠𝑥subscript𝑠𝑦{\text{mmse}}_{y}(s_{x},s_{y}) are decreasing functions of sxsubscript𝑠𝑥s_{x} and sysubscript𝑠𝑦s_{y}. This implies that mmsex(b𝖱Wb,iϕbx(t)1,b𝖱Wb,iϕby(t)1)subscriptmmse𝑥subscript𝑏𝖱subscript𝑊𝑏𝑖superscriptsubscriptitalic-ϕ𝑏𝑥superscript𝑡1subscript𝑏𝖱subscript𝑊𝑏𝑖superscriptsubscriptitalic-ϕ𝑏𝑦superscript𝑡1{\text{mmse}}_{x}(\sum_{b\in\mathsf{R}}W_{b,i}\phi_{b}^{x}(t)^{-1},\sum_{b\in\mathsf{R}}W_{b,i}\phi_{b}^{y}(t)^{-1}) is less than or equal to mmsex(b𝖱Wb,iϕbx(t)1,0)subscriptmmse𝑥subscript𝑏𝖱subscript𝑊𝑏𝑖superscriptsubscriptitalic-ϕ𝑏𝑥superscript𝑡10{\text{mmse}}_{x}(\sum_{b\in\mathsf{R}}W_{b,i}\phi_{b}^{x}(t)^{-1},0), which is equal to the variance of the MMSE estimator for X𝑋X which does not use the information of Y𝑌Y. One can also check that SE equation is increasing with respect to ψix(t)superscriptsubscript𝜓𝑖𝑥𝑡\psi_{i}^{x}(t), which implies that the ψxsuperscript𝜓𝑥\psi^{x} sequence for the MAMP is dominated by the ψxsuperscript𝜓𝑥\psi^{x} sequence of a single terminal AMP, which converges to 00 for any ρx>d(X)subscript𝜌𝑥𝑑𝑋\rho_{x}>d(X). If ψix(t)subscriptsuperscript𝜓𝑥𝑖𝑡\psi^{x}_{i}(t) converges to zero so does the ϕaxsubscriptsuperscriptitalic-ϕ𝑥𝑎\phi^{x}_{a} sequence, thus the SE equation for TYsubscript𝑇𝑌T_{Y} will be as follows

ϕay(t)subscriptsuperscriptitalic-ϕ𝑦𝑎𝑡\displaystyle\phi^{y}_{a}(t) =1ρyi𝖢Wa,iψiy(t),absent1subscript𝜌𝑦subscript𝑖𝖢subscript𝑊𝑎𝑖subscriptsuperscript𝜓𝑦𝑖𝑡\displaystyle=\frac{1}{\rho_{y}}\sum_{i\in\mathsf{C}}W_{a,i}\psi^{y}_{i}(t),
ψiy(t+1)subscriptsuperscript𝜓𝑦𝑖𝑡1\displaystyle\psi^{y}_{i}(t+1) =mmsey(,b𝖱Wb,iϕby(t)1),absentsubscriptmmse𝑦subscript𝑏𝖱subscript𝑊𝑏𝑖superscriptsubscriptitalic-ϕ𝑏𝑦superscript𝑡1\displaystyle={\text{mmse}}_{y}(\infty,\sum_{b\in\mathsf{R}}W_{b,i}\phi_{b}^{y}(t)^{-1}),

which using the same steps as in the single terminal case, can be proved to converge to zero provides that

ρy>lim supssmmse(Y|X,sY+Zy)=d(Y|X),subscript𝜌𝑦subscriptlimit-supremum𝑠𝑠mmseconditional𝑌𝑋𝑠𝑌subscript𝑍𝑦𝑑conditional𝑌𝑋\displaystyle\rho_{y}>\limsup_{s\to\infty}s{\text{mmse}}(Y|X,\sqrt{s}Y+Z_{y})=d(Y|X),

where Zysubscript𝑍𝑦Z_{y} is a zero mean unit variance Gaussian noise and where we used the fact that for the class of linearly correlated signals that we use, d(Y|X)𝑑conditional𝑌𝑋d(Y|X) is well defined.

Similarly, it is possible to prove that (ρx,ρy)=(d(X|Y),d(Y))subscript𝜌𝑥subscript𝜌𝑦𝑑conditional𝑋𝑌𝑑𝑌(\rho_{x},\rho_{y})=(d(X|Y),d(Y)) is also achievable. Furthermore, any point on the dominant face is also achievable because if we consider two ensembles of measurement matrices (A1,B1)subscript𝐴1subscript𝐵1(A_{1},B_{1}) and (A2,B2)subscript𝐴2subscript𝐵2(A_{2},B_{2}) with rate vectors R1=(d(X),d(Y|X))subscript𝑅1𝑑𝑋𝑑conditional𝑌𝑋\vec{R}_{1}=(d(X),d(Y|X)) and R2=(d(Y),d(X|Y))subscript𝑅2𝑑𝑌𝑑conditional𝑋𝑌\vec{R}_{2}=(d(Y),d(X|Y)) achieving the two corner points respectively, by diagonally concatenating r𝑟r copies of the former with s𝑠s copies of the latter, one can get an ensemble with measurement rate rr+sR1+sr+sR2𝑟𝑟𝑠subscript𝑅1𝑠𝑟𝑠subscript𝑅2\frac{r}{r+s}\vec{R}_{1}+\frac{s}{r+s}\vec{R}_{2} and a negligible distortion.

The other points on the region are also achieved because their measurement rate is larger than or equal to the measurement rate of at least one point on the dominant face, thus their distortion will be asymptotically negligible as well. ∎

IV Simulation Results

IV-A Signal Model

For simulation, we will use a linearly correlated random vector from 2subscript2{\cal L}_{2} whose independent constituents are random variables with Bernoulli-Gaussian distribution. Let Zksuperscript𝑍𝑘Z^{k} be a sequence of independent random variables with probability distribution pi(z)=(1αi)δ0(z)+αi𝖭(0,1αi)subscript𝑝𝑖𝑧1subscript𝛼𝑖subscript𝛿0𝑧subscript𝛼𝑖𝖭01subscript𝛼𝑖p_{i}(z)=(1-\alpha_{i})\delta_{0}(z)+\alpha_{i}\mathsf{N}(0,\frac{1}{\alpha_{i}}) where δ0subscript𝛿0\delta_{0} is a delta measure at point zero and 𝖭(0,σ2,z)𝖭0superscript𝜎2𝑧\mathsf{N}(0,\sigma^{2},z) denotes a zero mean Gaussian distribution with variance σ2superscript𝜎2\sigma^{2}. One can simply check that Var(Zi)=1Varsubscript𝑍𝑖1{\text{Var}}(Z_{i})=1 and d(Zi)=αi𝑑subscript𝑍𝑖subscript𝛼𝑖d(Z_{i})=\alpha_{i}. Let ΦΦ\Phi be a 2×k2𝑘2\times k real-valued matrix. The two terminal linearly correlated source is given by ΦZkΦsuperscript𝑍𝑘\Phi Z^{k}. As explained in Section II, the joint and conditional RID of this source is well-defined. Notice that depending on the values of αisubscript𝛼𝑖\alpha_{i} and the structure of the matrix ΦΦ\Phi, this model can cover a wide variety of correlations between the signals in two terminals. In Appendix D, we have obtained a closed form expression for the MMSE estimator (ηx,ηy)superscript𝜂𝑥superscript𝜂𝑦(\eta^{x},\eta^{y}) of this source in presence of the Gaussian measurement noise which we will use as a denoising (threshold) function in MAMP algorithm.

IV-B Performance without Spatial Coupling

In this section, we use the message passing algorithm given by Equations (5)-(8) to recover a linearly correlated Bernoulli-Gaussian signal for the noiseless case where there is no measurement noise.

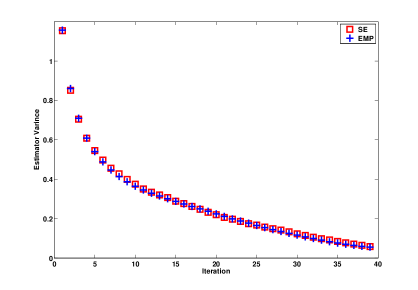
IV-B1 Comparison of the Empirical Results and SE predictions
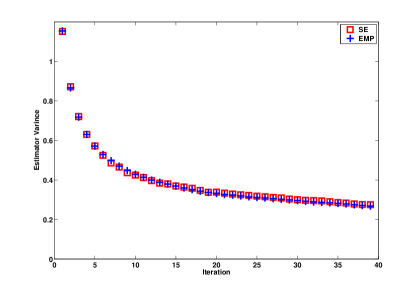
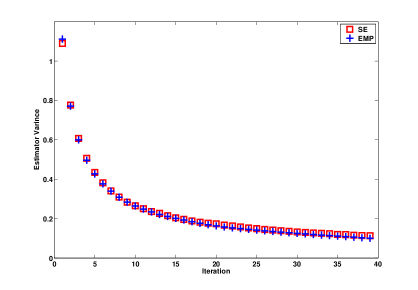
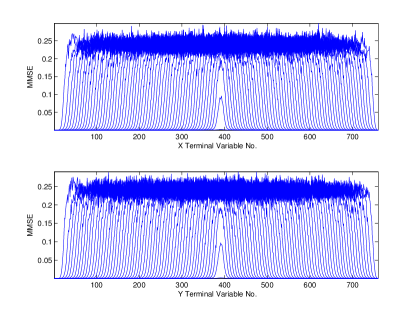
We consider a very simple case where Z1,Z2,Z3subscript𝑍1subscript𝑍2subscript𝑍3Z_{1},Z_{2},Z_{3} are three Bernoulli-Gaussian random variables with d(Z1)=d(Z3)=0.2𝑑subscript𝑍1𝑑subscript𝑍30.2d(Z_{1})=d(Z_{3})=0.2 and d(Z2)=0.3𝑑subscript𝑍20.3d(Z_{2})=0.3. The signal for the two terminals is given by X=Z1+Z2𝑋subscript𝑍1subscript𝑍2X=Z_{1}+Z_{2} and Y=Z2+Z3𝑌subscript𝑍2subscript𝑍3Y=Z_{2}+Z_{3}, thus Z1subscript𝑍1Z_{1} and Z3subscript𝑍3Z_{3} are the private parts of the signals and Z2subscript𝑍2Z_{2} is the common part which creates correlation between X𝑋X and Y𝑌Y. It is easy to check that d(X)=d(Y)=0.44𝑑𝑋𝑑𝑌0.44d(X)=d(Y)=0.44 and d(X|Y)=d(Y|X)=0.248𝑑conditional𝑋𝑌𝑑conditional𝑌𝑋0.248d(X|Y)=d(Y|X)=0.248.

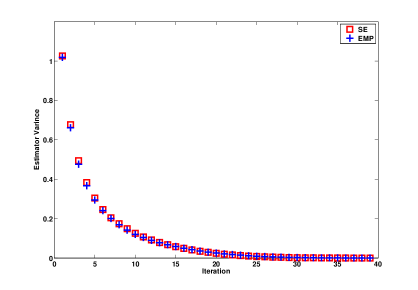
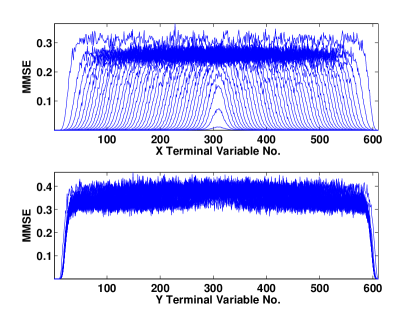
Figure 3, 4 show the simulation results for ρ1=0.5,ρ2=0.6formulae-sequencesubscript𝜌10.5subscript𝜌20.6\rho_{1}=0.5,\rho_{2}=0.6. It is seen that there is a good match between the empirical variance of the estimator and the predictions of the SE. Moreover, the algorithm can not fully recover the signal which means that the SE equation has a fixed point other than (τx,τy)=(0,0)subscript𝜏𝑥subscript𝜏𝑦00(\tau_{x},\tau_{y})=(0,0). The simulations has been repeated in Figure 5, 6 by increasing the measurement rate of the TYsubscript𝑇𝑌T_{Y} from ρ2=0.6subscript𝜌20.6\rho_{2}=0.6 to 0.70.70.7. Plots show that this time MAMP algorithm successfully recovers the signal of both terminals. It is also important to notice that because of the correlation between the terminals, increasing ρ2subscript𝜌2\rho_{2} is helpful for recovering the signal in TYsubscript𝑇𝑌T_{Y}.

Refer to caption
Figure 3: Empirical and SE Result for TXsubscript𝑇𝑋T_{X} for ρ1=0.5,ρ2=0.6formulae-sequencesubscript𝜌10.5subscript𝜌20.6\rho_{1}=0.5,\rho_{2}=0.6
Refer to caption
Figure 4: Empirical and SE Result for TYsubscript𝑇𝑌T_{Y} for ρ1=0.5,ρ2=0.6formulae-sequencesubscript𝜌10.5subscript𝜌20.6\rho_{1}=0.5,\rho_{2}=0.6
Refer to caption
Figure 5: Empirical and SE Result for TXsubscript𝑇𝑋T_{X} for ρ1=0.5,ρ2=0.7formulae-sequencesubscript𝜌10.5subscript𝜌20.7\rho_{1}=0.5,\rho_{2}=0.7
Refer to caption
Figure 6: Empirical and SE Result for TYsubscript𝑇𝑌T_{Y} for ρ1=0.5,ρ2=0.7formulae-sequencesubscript𝜌10.5subscript𝜌20.7\rho_{1}=0.5,\rho_{2}=0.7

IV-B2 Rate-Distortion Region

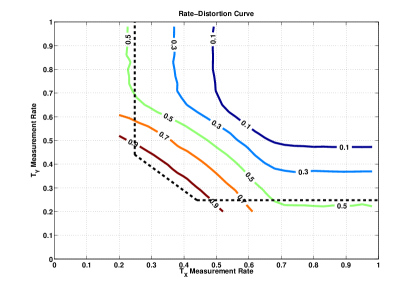
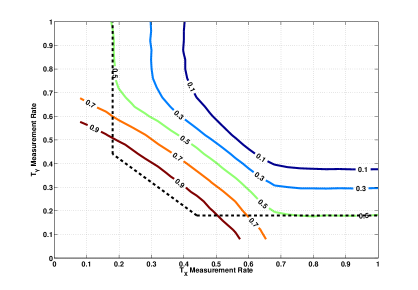
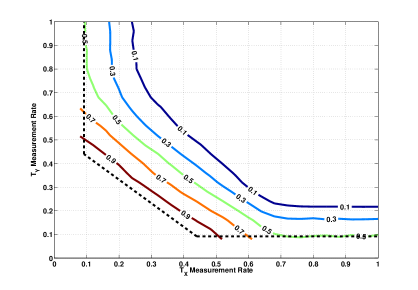
In this part, we run the MAMP algorithm for the same signal as in Section IV-B1 for different measurement rates. As a distortion measure, we consider the average of the mean square error of the two terminals. Figure 7, 8, 9 show a contour plot of the Rate-Distortion curve for three sources with the same individual but different conditional RID. The dashed lines show the boundary of the optimal pentagon. Low distortion recovery is not possible outside of this region.

In the extreme case where the signals in two terminals are independent from each other, i.e. there is no common signal, the pentagon region reduces to a square region. On the contrary, if there is no private signal then the signals in both terminals are the same and the problem is reduced to a simple single terminal problem. Obviously in this case, beacause of the independence of measurement matrices in the two terminals, individual measurement rates are not important as far as their sum is large enough. This can be seen from Figure 7, 8, 9 where we keep d(X)=d(Y)=0.44𝑑𝑋𝑑𝑌0.44d(X)=d(Y)=0.44 but gradually increase the share of the common signal where as a result d(X|Y)𝑑conditional𝑋𝑌d(X|Y) and d(Y|X)𝑑conditional𝑌𝑋d(Y|X) start to decrease. It is observed that the contour lines gradually become parallel with ρx+ρy=constantsubscript𝜌𝑥subscript𝜌𝑦constant\rho_{x}+\rho_{y}=\text{constant}.

Notice that there is a huge gap between the low-distortion curve (distortion equal to 0.10.10.1) and the optimal region. As we will see this gap is filled by using spatial coupling and running MAMP.

Refer to caption
Figure 7: Rate-Distortion region for a linearly correlated Bernoulli-Gaussian source with d(X)=d(Y)=0.44𝑑𝑋𝑑𝑌0.44d(X)=d(Y)=0.44 and d(X|Y)=d(Y|X)=0.248𝑑conditional𝑋𝑌𝑑conditional𝑌𝑋0.248d(X|Y)=d(Y|X)=0.248. The dashed lines show the boundaries of the optimal region.
Refer to caption
Figure 8: Rate-Distortion Region for the Linearly Correlated Bernoulli-Gaussian Source with d(X)=d(Y)=0.44𝑑𝑋𝑑𝑌0.44d(X)=d(Y)=0.44 and d(X|Y)=d(Y|X)=0.1802𝑑conditional𝑋𝑌𝑑conditional𝑌𝑋0.1802d(X|Y)=d(Y|X)=0.1802.
Refer to caption
Figure 9: Rate-Distortion region for a linearly correlated Bernoulli-Gaussian source with d(X)=d(Y)=0.44𝑑𝑋𝑑𝑌0.44d(X)=d(Y)=0.44 and d(X|Y)=d(Y|X)=0.0916𝑑conditional𝑋𝑌𝑑conditional𝑌𝑋0.0916d(X|Y)=d(Y|X)=0.0916. The dashed lines show the boundary of the optimal region.

IV-B3 Effect of Correlation between the Terminals

In order to investigate the effect of correlation between the two terminals, we have plotted a low distortion contour of the three sources with the same d(X)=d(Y)=0.44𝑑𝑋𝑑𝑌0.44d(X)=d(Y)=0.44 but three different conditional RID 0.2480.2480.248, 0.18200.18200.1820 and 0.09160.09160.0916. Decreasing the conditional RID while fixing the individual entropy, make the signals in two terminals more correlated. A low distortion curve of the three sources is plotted in Figure 10. The plot shows that the required measurement rate is decreasing by increasing the correlation.

Refer to caption
Figure 10: Effect of Correlation on Measurement Rate Region. The low distortion curve of three different two terminal sources with the same individual RID is plotted. The required measurement region of the more correlated source is dominated by that of the less correlated one.

IV-C Performance with Spatial Coupling

In this section, we simulate the SE equation for MAMP algorithm. We consider the same source as in Section IV-B1 where d(X)=d(Y)=0.44𝑑𝑋𝑑𝑌0.44d(X)=d(Y)=0.44 and d(X|Y)=d(Y|X)=0.248𝑑conditional𝑋𝑌𝑑conditional𝑌𝑋0.248d(X|Y)=d(Y|X)=0.248. In order to approach the corner point (d(X),d(Y|X))𝑑𝑋𝑑conditional𝑌𝑋(d(X),d(Y|X)), we consider a measurement rate with 101010 percent oversampling, i.e. ρx=1.1d(X)subscript𝜌𝑥1.1𝑑𝑋\rho_{x}=1.1d(X) and ρy=1.1d(Y|X)subscript𝜌𝑦1.1𝑑conditional𝑌𝑋\rho_{y}=1.1d(Y|X). The simulation results has been shown in Figure 11. Similar to the single terminal case, one can observe a wave-like phenomenon which starts from the boundary variables and proceeds towards the center recovering the variables gradually. In particular, to create the initial wave at the boundary one needs to oversample the boundary variables. Figure 12 depicts the simulation results for another experiment where ρxsubscript𝜌𝑥\rho_{x} is kept fixed but ρysubscript𝜌𝑦\rho_{y} is reduced. It is observed that, this time spatial coupling wave proceeds to decode the variables in TXsubscript𝑇𝑋T_{X} however the initially generated wave in TYsubscript𝑇𝑌T_{Y} stops after a while and can not proceed to recover the all the variables in TYsubscript𝑇𝑌T_{Y}.

By checking the results for non-spatially coupled case, one can see that the resulting MSE error decreases gradually by increasing the measurement rate. On the contrary, in the spatially coupled case, either wave proceeds and recovers all the variables or it stops, thus asymptotically, there is a sharp transition in the resulting MSE in terms of measurement rate.

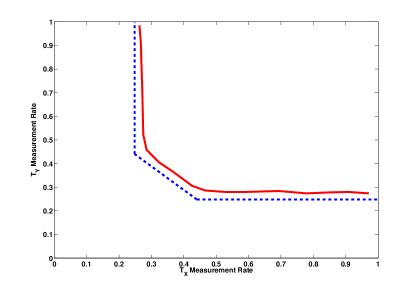
For the same source, we have done the simulations to find boundary of the phase transition. Figure 13 depicts the simulation result.

Refer to caption
Figure 11: Spatial Coupling Wave for A Linearly Correlated Source with ρx=1.1d(X)subscript𝜌𝑥1.1𝑑𝑋\rho_{x}=1.1d(X) and ρy=1.1d(Y|X)subscript𝜌𝑦1.1𝑑conditional𝑌𝑋\rho_{y}=1.1d(Y|X)
Refer to caption
Figure 12: Spatial Coupling Wave for A Linearly Correlated Source with ρx=1.1d(X)subscript𝜌𝑥1.1𝑑𝑋\rho_{x}=1.1d(X) and ρy<d(Y|X)subscript𝜌𝑦𝑑conditional𝑌𝑋\rho_{y}<d(Y|X)
Refer to caption
Figure 13: Phase Transition Boundary for MAMP and Comparison with SE Prediction. Dashed curve shows the theoretical boundary of the achievable measurement rate region.

References

  • [1] D. Baron, M. F. Duarte, S. Sarvotham, M. B. Wakin, and R. G. Baraniuk, “An information-theoretic approach to distributed compressed sensing,” in Proc. 45rd Conference on Communication, Control, and Computing, 2005.
  • [2] M. Fornasier and H. Rauhut, “Recovery algorithms for vector-valued data with joint sparsity constraints,” SIAM Journal on Numerical Analysis, vol. 46, no. 2, pp. 577–613, 2008.
  • [3] E. J. Candès, J. Romberg, and T. Tao, “Robust uncertainty principles: Exact signal reconstruction from highly incomplete frequency information,” Information Theory, IEEE Transactions on, vol. 52, no. 2, pp. 489–509, 2006.
  • [4] D. L. Donoho, “Compressed sensing,” Information Theory, IEEE Transactions on, vol. 52, no. 4, pp. 1289–1306, 2006.
  • [5] Multi-sensor and distributed compressive sensing. [Online]. Available: http://dsp.rice.edu/cs
  • [6] Y. Wu and S. Verdú, “Rényi information dimension: Fundamental limits of almost lossless analog compression,” Information Theory, IEEE Transactions on, vol. 56, no. 8, pp. 3721–3748, 2010.
  • [7] ——, “Optimal phase transitions in compressed sensing,” 2011.
  • [8] S. Haghighatshoar, E. Abbe, and E. Telatar, “Adaptive sensing using deterministic partial hadamard matrices,” in Information Theory Proceedings (ISIT), 2012 IEEE International Symposium on.   IEEE, 2012, pp. 1842–1846.
  • [9] S. Haghighatshoar and E. Abbe, “Polarization of the rényi information dimension for single and multi terminal analog compression,” arXiv preprint arXiv:1301.6388, 2013.
  • [10] E. Arikan, “Source polarization,” in Information Theory Proceedings (ISIT), 2010 IEEE International Symposium on.   IEEE, 2010, pp. 899–903.
  • [11] ——, “Channel polarization: A method for constructing capacity-achieving codes for symmetric binary-input memoryless channels,” Information Theory, IEEE Transactions on, vol. 55, no. 7, pp. 3051–3073, 2009.
  • [12] D. L. Donoho, A. Javanmard, and A. Montanari, “Information-theoretically optimal compressed sensing via spatial coupling and approximate message passing,” in Information Theory Proceedings (ISIT), 2012 IEEE International Symposium on.   IEEE, 2012, pp. 1231–1235.
  • [13] F. Krzakala, M. Mézard, F. Sausset, Y. Sun, and L. Zdeborová, “Statistical-physics-based reconstruction in compressed sensing,” Physical Review X, vol. 2, no. 2, p. 021005, 2012.
  • [14] ——, “Probabilistic reconstruction in compressed sensing: algorithms, phase diagrams, and threshold achieving matrices,” Journal of Statistical Mechanics: Theory and Experiment, vol. 2012, no. 08, p. P08009, 2012.
  • [15] D. L. Donoho, A. Maleki, and A. Montanari, “Message passing algorithms for compressed sensing: I. motivation and construction,” in Information Theory Workshop (ITW), 2010 IEEE.   IEEE, 2010, pp. 1–5.
  • [16] M. Bayati and A. Montanari, “The dynamics of message passing on dense graphs, with applications to compressed sensing,” Information Theory, IEEE Transactions on, vol. 57, no. 2, pp. 764–785, 2011.
  • [17] Y. Wu and S. Verdú, “Mmse dimension,” Information Theory, IEEE Transactions on, vol. 57, no. 8, pp. 4857–4879, 2011.
  • [18] A. Rényi, “On the dimension and entropy of probability distributions,” Acta Mathematica Academiae Scientiarum Hungarica, vol. 10, no. 1-2, pp. 193–215, 1959.
  • [19] S. Kudekar, T. J. Richardson, and R. L. Urbanke, “Threshold saturation via spatial coupling: Why convolutional ldpc ensembles perform so well over the bec,” Information Theory, IEEE Transactions on, vol. 57, no. 2, pp. 803–834, 2011.

Appendix A Linearly Correlated Random Signals and RID

Let (Ω,,)Ω{\cal L}(\Omega,{\cal F},\mathbb{P}) be a probability space. We define the space 1subscript1{\cal L}_{1} as the space of all nonsingular scalar random variables. For k,k2formulae-sequence𝑘𝑘2k\in\mathbb{N},k\geq 2, ksubscript𝑘{\cal L}_{k} is the space of all k𝑘k-dimensional random vectors that can be written as a linear combination of finitely many independent nonsingular random variables, i.e. for Xkksuperscript𝑋𝑘subscript𝑘X^{k}\in{\cal L}_{k} there is a k×n𝑘𝑛k\times n matrix A𝐴A and n𝑛n independent nonsingular random variables Znsuperscript𝑍𝑛Z^{n} such that Xk=AZnsuperscript𝑋𝑘𝐴superscript𝑍𝑛X^{k}=AZ^{n}. For this set of random variables, the RID as proved in [9], is well defined and can be obtained by the following formula

d(Xk)=𝔼{rank(A[CΘ])},𝑑superscript𝑋𝑘𝔼rank𝐴delimited-[]subscript𝐶Θ\displaystyle d(X^{k})=\mathbb{E}\{\mathrm{rank}(A[C_{\Theta}])\},

where {Θi}i=1nsuperscriptsubscriptsubscriptΘ𝑖𝑖1𝑛\{\Theta_{i}\}_{i=1}^{n} are independent binary random variables with (Θi=1)=d(Zi)subscriptΘ𝑖1𝑑subscript𝑍𝑖\mathbb{P}(\Theta_{i}=1)=d(Z_{i}), CΘ={i[n]:Θi=1}subscript𝐶Θconditional-set𝑖delimited-[]𝑛subscriptΘ𝑖1C_{\Theta}=\{i\in[n]:\Theta_{i}=1\} is a random subset of [n]delimited-[]𝑛[n] denoting the position of nonzero values in ΘnsuperscriptΘ𝑛\Theta^{n} and where for a subset S[n]𝑆delimited-[]𝑛S\in[n], A[S]𝐴delimited-[]𝑆A[S] is the matrix consisting of only those columns of A𝐴A with index in S𝑆S. For example let, d(Z1)=d(Z3)=0.2𝑑subscript𝑍1𝑑subscript𝑍30.2d(Z_{1})=d(Z_{3})=0.2 and d(Z2)=0.3𝑑subscript𝑍20.3d(Z_{2})=0.3, A=(110011)𝐴matrix110011A=\left(\begin{matrix}1&1&0\\ 0&1&1\end{matrix}\right) and X2=AZ3superscript𝑋2𝐴superscript𝑍3X^{2}=AZ^{3}. In this case one can simply check that rank(A[CΘ])=Θ1+Θ2+Θ3Θ1Θ2Θ3rank𝐴delimited-[]subscript𝐶ΘsubscriptΘ1subscriptΘ2subscriptΘ3subscriptΘ1subscriptΘ2subscriptΘ3\mathrm{rank}(A[C_{\Theta}])=\Theta_{1}+\Theta_{2}+\Theta_{3}-\Theta_{1}\Theta_{2}\Theta_{3} because adding selecting any column adds 111 unit to the rank unless all of the columns have been selected. Taking the expected value, one gets d(X2)=0.70.012=0.688𝑑superscript𝑋20.70.0120.688d(X^{2})=0.7-0.012=0.688. Similarly, one can show that d(X1)=d(X2)=0.44𝑑subscript𝑋1𝑑subscript𝑋20.44d(X_{1})=d(X_{2})=0.44. Thus, d(X1|X2)=d(X2|X1)=d(X2)d(X1)=0.248𝑑conditionalsubscript𝑋1subscript𝑋2𝑑conditionalsubscript𝑋2subscript𝑋1𝑑superscript𝑋2𝑑subscript𝑋10.248d(X_{1}|X_{2})=d(X_{2}|X_{1})=d(X^{2})-d(X_{1})=0.248.

The space of linearly correlated random variables is defined as =i=1isuperscriptsubscript𝑖1subscript𝑖{\cal L}=\cup_{i=1}^{\infty}{\cal L}_{i}. If (Xk,Yl)superscript𝑋𝑘superscript𝑌𝑙(X^{k},Y^{l}) is a k+l𝑘𝑙k+l dimensional vector in k+lsubscript𝑘𝑙{\cal L}_{k+l}, the conditional RID of Xksuperscript𝑋𝑘X^{k} given Ylsuperscript𝑌𝑙Y^{l} is defined as follows

d(Xk|Yl)=d(Xk,Yl)d(Yl).𝑑conditionalsuperscript𝑋𝑘superscript𝑌𝑙𝑑superscript𝑋𝑘superscript𝑌𝑙𝑑superscript𝑌𝑙\displaystyle d(X^{k}|Y^{l})=d(X^{k},Y^{l})-d(Y^{l}).

In this paper, for simplicity, we deal only with two terminals and thus two dimensional random vectors in 2subscript2{\cal L}_{2}. In this case, for the two terminal source (X,Y)2𝑋𝑌subscript2(X,Y)\in{\cal L}_{2} there are independent nonsingular random variables Znsuperscript𝑍𝑛Z^{n} and an,bnnsuperscript𝑎𝑛superscript𝑏𝑛superscript𝑛a^{n},b^{n}\in\mathbb{R}^{n} such that X=i[n]aiZi𝑋subscript𝑖delimited-[]𝑛subscript𝑎𝑖subscript𝑍𝑖X=\sum_{i\in[n]}a_{i}Z_{i} and Y=i[n]biZi𝑌subscript𝑖delimited-[]𝑛subscript𝑏𝑖subscript𝑍𝑖Y=\sum_{i\in[n]}b_{i}Z_{i} and the joint and the conditional RID’s are also well defined.

Appendix B Heuristic Derivation of the Multi-Terminal AMP

In this section, we try to heuristically obtain an approximation to the message passing algorithm given by equations (1)-(4). Our derivation is similar to the heuristic derivation of the single terminal AMP in [16]. Intuitively as the measurement matrices A𝐴A and B𝐵B are dense, any two messages emanating from the same check node are only slightly different from each other. The same is true for the messages emanating from a variable node. For example, if one considers messages from check nodes to variable nodes

raitsubscriptsuperscript𝑟𝑡𝑎𝑖\displaystyle r^{t}_{a\to i} =uaj[n]\iAajxjatabsentsubscript𝑢𝑎subscript𝑗\delimited-[]𝑛𝑖subscript𝐴𝑎𝑗subscriptsuperscript𝑥𝑡𝑗𝑎\displaystyle=u_{a}-\sum_{j\in[n]\backslash i}A_{aj}x^{t}_{j\to a}
=uaj[n]Aajxjat+Aaixiat,absentsubscript𝑢𝑎subscript𝑗delimited-[]𝑛subscript𝐴𝑎𝑗subscriptsuperscript𝑥𝑡𝑗𝑎subscript𝐴𝑎𝑖subscriptsuperscript𝑥𝑡𝑖𝑎\displaystyle=u_{a}-\sum_{j\in[n]}A_{aj}x^{t}_{j\to a}+A_{ai}x^{t}_{i\to a},

it is seen that for a fixed a[mx]𝑎delimited-[]subscript𝑚𝑥a\in[m_{x}], raitsubscriptsuperscript𝑟𝑡𝑎𝑖r^{t}_{a\to i} for different values of i[n]𝑖delimited-[]𝑛i\in[n] are different because of the appearance of the last term Aaixiatsubscript𝐴𝑎𝑖subscriptsuperscript𝑥𝑡𝑖𝑎A_{ai}x^{t}_{i\to a} which is of the order O(1mx)O(1n)𝑂1subscript𝑚𝑥𝑂1𝑛O(\frac{1}{\sqrt{m_{x}}})\approx O(\frac{1}{\sqrt{n}}) as mxsubscript𝑚𝑥m_{x} and n𝑛n are assumed to be proportional. Similarly, considering the messages from variable nodes to check nodes,

xiat+1subscriptsuperscript𝑥𝑡1𝑖𝑎\displaystyle x^{t+1}_{i\to a} =ηtx(b[mx]\aAbirbit,c[my]Aciscit)absentsubscriptsuperscript𝜂𝑥𝑡subscript𝑏\delimited-[]subscript𝑚𝑥𝑎subscript𝐴𝑏𝑖subscriptsuperscript𝑟𝑡𝑏𝑖subscript𝑐delimited-[]subscript𝑚𝑦subscript𝐴𝑐𝑖subscriptsuperscript𝑠𝑡𝑐𝑖\displaystyle=\eta^{x}_{t}(\sum_{b\in[m_{x}]\backslash a}A_{bi}r^{t}_{b\to i},\sum_{c\in[m_{y}]}A_{ci}s^{t}_{c\to i})
=ηtx(b[mx]AbirbitAairait,c[my]Aciscit),absentsubscriptsuperscript𝜂𝑥𝑡subscript𝑏delimited-[]subscript𝑚𝑥subscript𝐴𝑏𝑖subscriptsuperscript𝑟𝑡𝑏𝑖subscript𝐴𝑎𝑖subscriptsuperscript𝑟𝑡𝑎𝑖subscript𝑐delimited-[]subscript𝑚𝑦subscript𝐴𝑐𝑖subscriptsuperscript𝑠𝑡𝑐𝑖\displaystyle=\eta^{x}_{t}(\sum_{b\in[m_{x}]}A_{bi}r^{t}_{b\to i}-A_{ai}r^{t}_{a\to i},\sum_{c\in[m_{y}]}A_{ci}s^{t}_{c\to i}),

it is observed that for a fixed i[n]𝑖delimited-[]𝑛i\in[n], the difference of messages xiat+1subscriptsuperscript𝑥𝑡1𝑖𝑎x^{t+1}_{i\to a} for different values of a[mx]𝑎delimited-[]subscript𝑚𝑥a\in[m_{x}] is again of the order O(1n)𝑂1𝑛O(\frac{1}{\sqrt{n}}). Therefore, one gets

rait=rat+δrait,sckt=sct+δsckt,formulae-sequencesubscriptsuperscript𝑟𝑡𝑎𝑖subscriptsuperscript𝑟𝑡𝑎𝛿subscriptsuperscript𝑟𝑡𝑎𝑖subscriptsuperscript𝑠𝑡𝑐𝑘subscriptsuperscript𝑠𝑡𝑐𝛿subscriptsuperscript𝑠𝑡𝑐𝑘\displaystyle r^{t}_{a\to i}=r^{t}_{a}+\delta r^{t}_{a\to i}\ ,\ s^{t}_{c\to k}=s^{t}_{c}+\delta s^{t}_{c\to k},
xiat=xit+δxiat,yiat=yit+δyiat,formulae-sequencesubscriptsuperscript𝑥𝑡𝑖𝑎subscriptsuperscript𝑥𝑡𝑖𝛿subscriptsuperscript𝑥𝑡𝑖𝑎subscriptsuperscript𝑦𝑡𝑖𝑎subscriptsuperscript𝑦𝑡𝑖𝛿subscriptsuperscript𝑦𝑡𝑖𝑎\displaystyle x^{t}_{i\to a}=x^{t}_{i}+\delta x^{t}_{i\to a}\ ,\ y^{t}_{i\to a}=y^{t}_{i}+\delta y^{t}_{i\to a},

where the δ𝛿\delta terms are of the order O(1n)𝑂1𝑛O(\frac{1}{\sqrt{n}}). Replacing in Equation (1) and (2), one obtains

rat+δraitsubscriptsuperscript𝑟𝑡𝑎𝛿subscriptsuperscript𝑟𝑡𝑎𝑖\displaystyle r^{t}_{a}+\delta r^{t}_{a\to i} =uaj[n]Aaj(xjt+δxjat)+Aai(xit+δxiat),absentsubscript𝑢𝑎subscript𝑗delimited-[]𝑛subscript𝐴𝑎𝑗subscriptsuperscript𝑥𝑡𝑗𝛿subscriptsuperscript𝑥𝑡𝑗𝑎subscript𝐴𝑎𝑖subscriptsuperscript𝑥𝑡𝑖𝛿subscriptsuperscript𝑥𝑡𝑖𝑎\displaystyle=u_{a}-\sum_{j\in[n]}A_{aj}(x^{t}_{j}+\delta x^{t}_{j\to a})+A_{ai}(x^{t}_{i}+\delta x^{t}_{i\to a}),
sct+δscktsubscriptsuperscript𝑠𝑡𝑐𝛿subscriptsuperscript𝑠𝑡𝑐𝑘\displaystyle s^{t}_{c}+\delta s^{t}_{c\to k} =vcl[n]Bcl(ylt+δylct)+Bck(ykt+δkct).absentsubscript𝑣𝑐subscript𝑙delimited-[]𝑛subscript𝐵𝑐𝑙subscriptsuperscript𝑦𝑡𝑙𝛿subscriptsuperscript𝑦𝑡𝑙𝑐subscript𝐵𝑐𝑘subscriptsuperscript𝑦𝑡𝑘subscriptsuperscript𝛿𝑡𝑘𝑐\displaystyle=v_{c}-\sum_{l\in[n]}B_{cl}(y^{t}_{l}+\delta y^{t}_{l\to c})+B_{ck}(y^{t}_{k}+\delta^{t}_{k\to c}).

The terms Aaiδxiatsubscript𝐴𝑎𝑖𝛿subscriptsuperscript𝑥𝑡𝑖𝑎A_{ai}\delta x^{t}_{i\to a} and Bckδykctsubscript𝐵𝑐𝑘𝛿subscriptsuperscript𝑦𝑡𝑘𝑐B_{ck}\delta y^{t}_{k\to c} are of the order O(1n)𝑂1𝑛O(\frac{1}{n}) and negligible asymptotically. Thus, one obtains that

ratsubscriptsuperscript𝑟𝑡𝑎\displaystyle r^{t}_{a} =uaj[n]Aaj(xjt+δxjat),δriat=Aaixit,formulae-sequenceabsentsubscript𝑢𝑎subscript𝑗delimited-[]𝑛subscript𝐴𝑎𝑗subscriptsuperscript𝑥𝑡𝑗𝛿subscriptsuperscript𝑥𝑡𝑗𝑎𝛿subscriptsuperscript𝑟𝑡𝑖𝑎subscript𝐴𝑎𝑖subscriptsuperscript𝑥𝑡𝑖\displaystyle=u_{a}-\sum_{j\in[n]}A_{aj}(x^{t}_{j}+\delta x^{t}_{j\to a})\ ,\ \delta r^{t}_{i\to a}=A_{ai}\,x^{t}_{i}, (19)
sctsubscriptsuperscript𝑠𝑡𝑐\displaystyle s^{t}_{c} =vcl[n]Bcl(ylt+δylct),δskct=Bckykt.formulae-sequenceabsentsubscript𝑣𝑐subscript𝑙delimited-[]𝑛subscript𝐵𝑐𝑙subscriptsuperscript𝑦𝑡𝑙𝛿subscriptsuperscript𝑦𝑡𝑙𝑐𝛿subscriptsuperscript𝑠𝑡𝑘𝑐subscript𝐵𝑐𝑘subscriptsuperscript𝑦𝑡𝑘\displaystyle=v_{c}-\sum_{l\in[n]}B_{cl}(y^{t}_{l}+\delta y^{t}_{l\to c})\ ,\ \delta s^{t}_{k\to c}=B_{ck}\,y^{t}_{k}. (20)

Replacing in Equations (3) and (4), it results that

xit+1subscriptsuperscript𝑥𝑡1𝑖\displaystyle x^{t+1}_{i} +δxiat+1𝛿subscriptsuperscript𝑥𝑡1𝑖𝑎\displaystyle+\delta x^{t+1}_{i\to a}
=ηtx(b[mx]\aAbi(rbt+Abixit),d[my]Bdi(sdt+Bdiyit))absentsubscriptsuperscript𝜂𝑥𝑡subscript𝑏\delimited-[]subscript𝑚𝑥𝑎subscript𝐴𝑏𝑖subscriptsuperscript𝑟𝑡𝑏subscript𝐴𝑏𝑖subscriptsuperscript𝑥𝑡𝑖subscript𝑑delimited-[]subscript𝑚𝑦subscript𝐵𝑑𝑖subscriptsuperscript𝑠𝑡𝑑subscript𝐵𝑑𝑖subscriptsuperscript𝑦𝑡𝑖\displaystyle=\eta^{x}_{t}(\sum_{b\in[m_{x}]\backslash a}A_{bi}(r^{t}_{b}+A_{bi}x^{t}_{i}),\sum_{d\in[m_{y}]}B_{di}(s^{t}_{d}+B_{di}y^{t}_{i}))
=ηtx(b[mx]Abi(rbt+Abixit),d[my]Bdi(sdt+Bdiyit))absentsubscriptsuperscript𝜂𝑥𝑡subscript𝑏delimited-[]subscript𝑚𝑥subscript𝐴𝑏𝑖subscriptsuperscript𝑟𝑡𝑏subscript𝐴𝑏𝑖subscriptsuperscript𝑥𝑡𝑖subscript𝑑delimited-[]subscript𝑚𝑦subscript𝐵𝑑𝑖subscriptsuperscript𝑠𝑡𝑑subscript𝐵𝑑𝑖subscriptsuperscript𝑦𝑡𝑖\displaystyle=\eta^{x}_{t}(\sum_{b\in[m_{x}]}A_{bi}(r^{t}_{b}+A_{bi}x^{t}_{i}),\sum_{d\in[m_{y}]}B_{di}(s^{t}_{d}+B_{di}y^{t}_{i}))
+1ηtx(.,.)Aai(rat+Aaixit).\displaystyle+\partial_{1}\eta^{x}_{t}(.,.)A_{ai}(r^{t}_{a}+A_{ai}x^{t}_{i}).

This implies that

xit+1subscriptsuperscript𝑥𝑡1𝑖\displaystyle x^{t+1}_{i} =ηtx(xit+b[mx]Abirbt,yit+d[my]Bdisdt),absentsubscriptsuperscript𝜂𝑥𝑡subscriptsuperscript𝑥𝑡𝑖subscript𝑏delimited-[]subscript𝑚𝑥subscript𝐴𝑏𝑖subscriptsuperscript𝑟𝑡𝑏subscriptsuperscript𝑦𝑡𝑖subscript𝑑delimited-[]subscript𝑚𝑦subscript𝐵𝑑𝑖subscriptsuperscript𝑠𝑡𝑑\displaystyle=\eta^{x}_{t}(x^{t}_{i}+\sum_{b\in[m_{x}]}A_{bi}r^{t}_{b}\ ,\ y^{t}_{i}+\sum_{d\in[m_{y}]}B_{di}s^{t}_{d}), (21)
δxiat+1𝛿subscriptsuperscript𝑥𝑡1𝑖𝑎\displaystyle\delta x^{t+1}_{i\to a} =1ηtx(xit+b[mx]Abirbt,yit+d[my]Bdisdt)Aairat,absentsubscript1subscriptsuperscript𝜂𝑥𝑡subscriptsuperscript𝑥𝑡𝑖subscript𝑏delimited-[]subscript𝑚𝑥subscript𝐴𝑏𝑖subscriptsuperscript𝑟𝑡𝑏subscriptsuperscript𝑦𝑡𝑖subscript𝑑delimited-[]subscript𝑚𝑦subscript𝐵𝑑𝑖subscriptsuperscript𝑠𝑡𝑑subscript𝐴𝑎𝑖subscriptsuperscript𝑟𝑡𝑎\displaystyle=\partial_{1}\eta^{x}_{t}(x^{t}_{i}+\sum_{b\in[m_{x}]}A_{bi}r^{t}_{b}\ ,\ y^{t}_{i}+\sum_{d\in[m_{y}]}B_{di}s^{t}_{d})A_{ai}r^{t}_{a}, (22)

where one uses the fact that for any i[n]𝑖delimited-[]𝑛i\in[n], a[mx]Aai21subscript𝑎delimited-[]subscript𝑚𝑥superscriptsubscript𝐴𝑎𝑖21\sum_{a\in[m_{x}]}A_{ai}^{2}\approx 1, and Aaiδrait=O(1n)subscript𝐴𝑎𝑖𝛿subscriptsuperscript𝑟𝑡𝑎𝑖𝑂1𝑛A_{ai}\delta r^{t}_{a\to i}=O(\frac{1}{n}) thus negligible as n𝑛n tends to infinity. A similar argument holds for the TYsubscript𝑇𝑌T_{Y}giving

ykt+1subscriptsuperscript𝑦𝑡1𝑘\displaystyle y^{t+1}_{k} =ηty(xkt+b[mx]Abkrbt,ykt+d[my]Bdksdt),absentsubscriptsuperscript𝜂𝑦𝑡subscriptsuperscript𝑥𝑡𝑘subscript𝑏delimited-[]subscript𝑚𝑥subscript𝐴𝑏𝑘subscriptsuperscript𝑟𝑡𝑏subscriptsuperscript𝑦𝑡𝑘subscript𝑑delimited-[]subscript𝑚𝑦subscript𝐵𝑑𝑘subscriptsuperscript𝑠𝑡𝑑\displaystyle=\eta^{y}_{t}(x^{t}_{k}+\sum_{b\in[m_{x}]}A_{bk}r^{t}_{b}\ ,\ y^{t}_{k}+\sum_{d\in[m_{y}]}B_{dk}s^{t}_{d}), (23)
δykct+1𝛿subscriptsuperscript𝑦𝑡1𝑘𝑐\displaystyle\delta y^{t+1}_{k\to c} =2ηty(xkt+b[mx]Abkrbt,ykt+d[my]Bdksdt)Bckrct.absentsubscript2subscriptsuperscript𝜂𝑦𝑡subscriptsuperscript𝑥𝑡𝑘subscript𝑏delimited-[]subscript𝑚𝑥subscript𝐴𝑏𝑘subscriptsuperscript𝑟𝑡𝑏subscriptsuperscript𝑦𝑡𝑘subscript𝑑delimited-[]subscript𝑚𝑦subscript𝐵𝑑𝑘subscriptsuperscript𝑠𝑡𝑑subscript𝐵𝑐𝑘subscriptsuperscript𝑟𝑡𝑐\displaystyle=\partial_{2}\eta^{y}_{t}(x^{t}_{k}+\sum_{b\in[m_{x}]}A_{bk}r^{t}_{b}\ ,\ y^{t}_{k}+\sum_{d\in[m_{y}]}B_{dk}s^{t}_{d})B_{ck}r^{t}_{c}. (24)

Replacing (22) in (19) and (24) in (20), and using the approximation Aai21mxsuperscriptsubscript𝐴𝑎𝑖21subscript𝑚𝑥A_{ai}^{2}\approx\frac{1}{m_{x}} and Bck21mysuperscriptsubscript𝐵𝑐𝑘21subscript𝑚𝑦B_{ck}^{2}\approx\frac{1}{m_{y}}, one obtains that

rat=uaAaxt+j[n]1ηtx(xjt1+,yjt1+)mxrat1subscriptsuperscript𝑟𝑡𝑎subscript𝑢𝑎subscript𝐴𝑎superscript𝑥𝑡subscript𝑗delimited-[]𝑛subscript1subscriptsuperscript𝜂𝑥𝑡subscriptsuperscript𝑥𝑡1𝑗subscriptsuperscript𝑦𝑡1𝑗subscript𝑚𝑥subscriptsuperscript𝑟𝑡1𝑎\displaystyle r^{t}_{a}=u_{a}-A_{a}x^{t}+\frac{\sum_{j\in[n]}\partial_{1}\eta^{x}_{t}(x^{t-1}_{j}+\dots,y^{t-1}_{j}+\dots)}{m_{x}}r^{t-1}_{a}
=uaAaxt+1ηtx(xt1+Art1,yt1+Bst1)ρxrat1,absentsubscript𝑢𝑎subscript𝐴𝑎superscript𝑥𝑡delimited-⟨⟩subscript1subscriptsuperscript𝜂𝑥𝑡superscript𝑥𝑡1superscript𝐴superscript𝑟𝑡1superscript𝑦𝑡1superscript𝐵superscript𝑠𝑡1subscript𝜌𝑥subscriptsuperscript𝑟𝑡1𝑎\displaystyle=u_{a}-A_{a}x^{t}+\frac{\left\langle\partial_{1}\eta^{x}_{t}(x^{t-1}+A^{*}r^{t-1},y^{t-1}+B^{*}s^{t-1})\right\rangle}{\rho_{x}}r^{t-1}_{a}, (25)

where Aasubscript𝐴𝑎A_{a} denotes the a𝑎a-th row of the matrix A𝐴A. Similarly,

sct=vcBcyt+l[n]2ηty(xlt1+,ylt1+)mysct1subscriptsuperscript𝑠𝑡𝑐subscript𝑣𝑐subscript𝐵𝑐superscript𝑦𝑡subscript𝑙delimited-[]𝑛subscript2subscriptsuperscript𝜂𝑦𝑡subscriptsuperscript𝑥𝑡1𝑙subscriptsuperscript𝑦𝑡1𝑙subscript𝑚𝑦subscriptsuperscript𝑠𝑡1𝑐\displaystyle s^{t}_{c}=v_{c}-B_{c}y^{t}+\frac{\sum_{l\in[n]}\partial_{2}\eta^{y}_{t}(x^{t-1}_{l}+\dots,y^{t-1}_{l}+\dots)}{m_{y}}s^{t-1}_{c}
=vcBcyt+2ηty(xt1+Art1,yt1+Bst1)ρysct1.absentsubscript𝑣𝑐subscript𝐵𝑐superscript𝑦𝑡delimited-⟨⟩subscript2subscriptsuperscript𝜂𝑦𝑡superscript𝑥𝑡1superscript𝐴superscript𝑟𝑡1superscript𝑦𝑡1superscript𝐵superscript𝑠𝑡1subscript𝜌𝑦subscriptsuperscript𝑠𝑡1𝑐\displaystyle=v_{c}-B_{c}y^{t}+\frac{\left\langle\partial_{2}\eta^{y}_{t}(x^{t-1}+A^{*}r^{t-1},y^{t-1}+B^{*}s^{t-1})\right\rangle}{\rho_{y}}s^{t-1}_{c}. (26)

Equations (21), (23), (25) and (26) give the the MAMP algorithm.

Appendix C Heuristic Derivation of the State Evolution

To give an intuitive justification (as in [16]) for the validity of SE for the two terminal AMP in Equations (9) and (10), consider the following version of the AMP where at each iteration t𝑡t, the measurement matrices A𝐴A and B𝐵B are replaced with independent copies and where we drop the Onsager term in Equations (5) and (6). In other words, let 𝒖t=A(t)𝒙0+wxsuperscript𝒖𝑡𝐴𝑡subscript𝒙0subscript𝑤𝑥\boldsymbol{u}^{t}=A(t)\boldsymbol{x}_{0}+w_{x} and 𝒗t=B(t)𝒚0+wysuperscript𝒗𝑡𝐵𝑡subscript𝒚0subscript𝑤𝑦\boldsymbol{v}^{t}=B(t)\boldsymbol{y}_{0}+w_{y} be the noisy measurements at iteration t𝑡t, where wxsubscript𝑤𝑥w_{x} and wysubscript𝑤𝑦w_{y} are additive noises consisting of i.i.d. zero mean with variance σx2superscriptsubscript𝜎𝑥2\sigma_{x}^{2} and σy2superscriptsubscript𝜎𝑦2\sigma_{y}^{2} respectively. The new AMP algorithm can be written as follows

rt=𝒖tA(t)xt,xt+1=ηtx(A(t)rt+xt,B(t)st+yt),formulae-sequencesuperscript𝑟𝑡superscript𝒖𝑡𝐴𝑡superscript𝑥𝑡superscript𝑥𝑡1subscriptsuperscript𝜂𝑥𝑡𝐴superscript𝑡superscript𝑟𝑡superscript𝑥𝑡𝐵superscript𝑡superscript𝑠𝑡superscript𝑦𝑡\displaystyle r^{t}=\boldsymbol{u}^{t}-A(t)x^{t}\ ,\ x^{t+1}=\eta^{x}_{t}(A(t)^{*}r^{t}+x^{t},B(t)^{*}s^{t}+y^{t}),
st=𝒗tB(t)yt,yt+1=ηty(A(t)rt+xt,B(t)st+yt).formulae-sequencesuperscript𝑠𝑡superscript𝒗𝑡𝐵𝑡superscript𝑦𝑡superscript𝑦𝑡1subscriptsuperscript𝜂𝑦𝑡𝐴superscript𝑡superscript𝑟𝑡superscript𝑥𝑡𝐵superscript𝑡superscript𝑠𝑡superscript𝑦𝑡\displaystyle s^{t}=\boldsymbol{v}^{t}-B(t)y^{t}\ ,\ y^{t+1}=\eta^{y}_{t}(A(t)^{*}r^{t}+x^{t},B(t)^{*}s^{t}+y^{t}).

The first equation can be simplified to the following form

xt+1=ηtx(\displaystyle x^{t+1}=\eta^{x}_{t}( 𝒙0+A(t)wx+(IA(t)A(t))(xt𝒙0),subscript𝒙0𝐴superscript𝑡subscript𝑤𝑥𝐼𝐴superscript𝑡𝐴𝑡superscript𝑥𝑡subscript𝒙0\displaystyle\boldsymbol{x}_{0}+A(t)^{*}w_{x}+(I-A(t)^{*}A(t))(x^{t}-\boldsymbol{x}_{0}),
𝒚0+B(t)wy+(IB(t)B(t))(yt𝒚0)).\displaystyle\boldsymbol{y}_{0}+B(t)^{*}w_{y}+(I-B(t)^{*}B(t))(y^{t}-\boldsymbol{y}_{0})).

Conditioned on wxsubscript𝑤𝑥w_{x}, A(t)wx𝐴superscript𝑡subscript𝑤𝑥A(t)^{*}w_{x} is an n𝑛n dimensional vector with i.i.d. Gaussian components with zero mean and variance wx22nσx2superscriptsubscriptnormsubscript𝑤𝑥22𝑛superscriptsubscript𝜎𝑥2\frac{\|w_{x}\|_{2}^{2}}{n}\approx\sigma_{x}^{2}. Moreover, in the asymptotic limit as n𝑛n gets large, by central limit theorem, each row of IA(t)A(t)𝐼𝐴superscript𝑡𝐴𝑡I-A(t)^{*}A(t) consists of approximately Gaussian random variables with variance nmx=1ρx𝑛subscript𝑚𝑥1subscript𝜌𝑥\frac{n}{m_{x}}=\frac{1}{\rho_{x}}. Similarly, the components of B(t)wy𝐵superscript𝑡subscript𝑤𝑦B(t)^{*}w_{y} are i.i.d. Gaussian with zero mean and approximate variance σy2superscriptsubscript𝜎𝑦2\sigma_{y}^{2} and each row of IB(t)B(t)𝐼𝐵superscript𝑡𝐵𝑡I-B(t)^{*}B(t) converges to independent zero mean Gaussian variables with variance nmy=1ρy𝑛subscript𝑚𝑦1subscript𝜌𝑦\frac{n}{m_{y}}=\frac{1}{\rho_{y}}. Hence, the components of A(t)wx+(IA(t)A(t))(xt𝒙0)𝐴superscript𝑡subscript𝑤𝑥𝐼𝐴superscript𝑡𝐴𝑡superscript𝑥𝑡subscript𝒙0A(t)^{*}w_{x}+(I-A(t)^{*}A(t))(x^{t}-\boldsymbol{x}_{0}) are approximately Gaussian with variance

τxt=σx2+1ρxxt𝒙022n.subscriptsuperscript𝜏𝑡𝑥superscriptsubscript𝜎𝑥21subscript𝜌𝑥superscriptsubscriptnormsuperscript𝑥𝑡subscript𝒙022𝑛\displaystyle\tau^{t}_{x}=\sigma_{x}^{2}+\frac{1}{\rho_{x}}\frac{\|x^{t}-\boldsymbol{x}_{0}\|_{2}^{2}}{n}. (27)

At t=0𝑡0t=0, with the initialization x0=0superscript𝑥00x^{0}=0, one obtains that

τx0=σx2+1ρx𝒙022nσx2+1ρx𝔼(X2),subscriptsuperscript𝜏0𝑥superscriptsubscript𝜎𝑥21subscript𝜌𝑥superscriptsubscriptnormsubscript𝒙022𝑛superscriptsubscript𝜎𝑥21subscript𝜌𝑥𝔼superscript𝑋2\displaystyle\tau^{0}_{x}=\sigma_{x}^{2}+\frac{1}{\rho_{x}}\frac{\|\boldsymbol{x}_{0}\|_{2}^{2}}{n}\to\sigma_{x}^{2}+\frac{1}{\rho_{x}}\mathbb{E}(X^{2}),

which is compatible with the SE initialization. A similar derivation gives τy0=σy2+1ρy𝔼(Y2)subscriptsuperscript𝜏0𝑦superscriptsubscript𝜎𝑦21subscript𝜌𝑦𝔼superscript𝑌2\tau^{0}_{y}=\sigma_{y}^{2}+\frac{1}{\rho_{y}}\mathbb{E}(Y^{2}). Moreover, by induction on t𝑡t, one can simply check that at iteration t+1𝑡1t+1,

xt+1=ηtx(X+τxtZx,Y+τytZy).superscript𝑥𝑡1subscriptsuperscript𝜂𝑥𝑡𝑋subscriptsuperscript𝜏𝑡𝑥subscript𝑍𝑥𝑌subscriptsuperscript𝜏𝑡𝑦subscript𝑍𝑦x^{t+1}=\eta^{x}_{t}(X+\sqrt{\tau^{t}_{x}}Z_{x},Y+\sqrt{\tau^{t}_{y}}Z_{y}).

Thus, replacing in Equation (27) and using a similar argument, one obtains that for the iteration t+1𝑡1t+1,

xt+1𝒙022n𝔼(Xηtx(X+τxtZx,Y+τytZy))2,superscriptsubscriptnormsuperscript𝑥𝑡1subscript𝒙022𝑛𝔼superscript𝑋subscriptsuperscript𝜂𝑥𝑡𝑋subscriptsuperscript𝜏𝑡𝑥subscript𝑍𝑥𝑌subscriptsuperscript𝜏𝑡𝑦subscript𝑍𝑦2\displaystyle\frac{\|x^{t+1}-\boldsymbol{x}_{0}\|_{2}^{2}}{n}\to\mathbb{E}(X-\eta^{x}_{t}(X+\sqrt{\tau^{t}_{x}}Z_{x},Y+\sqrt{\tau^{t}_{y}}Z_{y}))^{2},

which implies that at iteration t+1𝑡1t+1:

τxt+1=σx2+1ρx𝔼(Xηtx(X+τxtZx,Y+τytZy))2.subscriptsuperscript𝜏𝑡1𝑥superscriptsubscript𝜎𝑥21subscript𝜌𝑥𝔼superscript𝑋subscriptsuperscript𝜂𝑥𝑡𝑋subscriptsuperscript𝜏𝑡𝑥subscript𝑍𝑥𝑌subscriptsuperscript𝜏𝑡𝑦subscript𝑍𝑦2\displaystyle\tau^{t+1}_{x}=\sigma_{x}^{2}+\frac{1}{\rho_{x}}\mathbb{E}(X-\eta^{x}_{t}(X+\sqrt{\tau^{t}_{x}}Z_{x},Y+\sqrt{\tau^{t}_{y}}Z_{y}))^{2}.

A similar argument gives the corresponding equation for τytsuperscriptsubscript𝜏𝑦𝑡\tau_{y}^{t}:

τyt+1=σy2+1ρy𝔼(Yηty(X+τxtZx,Y+τytZy))2.subscriptsuperscript𝜏𝑡1𝑦superscriptsubscript𝜎𝑦21subscript𝜌𝑦𝔼superscript𝑌subscriptsuperscript𝜂𝑦𝑡𝑋subscriptsuperscript𝜏𝑡𝑥subscript𝑍𝑥𝑌subscriptsuperscript𝜏𝑡𝑦subscript𝑍𝑦2\displaystyle\tau^{t+1}_{y}=\sigma_{y}^{2}+\frac{1}{\rho_{y}}\mathbb{E}(Y-\eta^{y}_{t}(X+\sqrt{\tau^{t}_{x}}Z_{x},Y+\sqrt{\tau^{t}_{y}}Z_{y}))^{2}.

Appendix D MMSE Estimator for a Linearly Correlated Bernoulli-Gaussian Signal

Suppose Zksuperscript𝑍𝑘Z^{k} are independent Bernoulli-Gaussian random variables with probability distribution pi(z)=(1αi)δ0(z)+αi𝖭(0,1αi,z)subscript𝑝𝑖𝑧1subscript𝛼𝑖subscript𝛿0𝑧subscript𝛼𝑖𝖭01subscript𝛼𝑖𝑧p_{i}(z)=(1-\alpha_{i})\delta_{0}(z)+\alpha_{i}\mathsf{N}(0,\frac{1}{\alpha_{i}},z). Let A𝐴A be a t×k𝑡𝑘t\times k matrix and let S=AZk𝑆𝐴superscript𝑍𝑘S=AZ^{k} be a t𝑡t dimensional linearly correlated signal. Suppose O=S+N~𝑂𝑆~𝑁O=S+\tilde{N} is the observation vector, where N~~𝑁\tilde{N} is a t×1𝑡1t\times 1 zero mean Gaussian measurement noise with a covariance matrix Σ~~Σ\tilde{\Sigma}. We denote by ηi(x)=𝔼(Si|O=x)subscript𝜂𝑖𝑥𝔼conditionalsubscript𝑆𝑖𝑂𝑥\eta_{i}(x)=\mathbb{E}(S_{i}|O=x) the MMSE estimator of Sisubscript𝑆𝑖S_{i}, the i𝑖i-th component of the signal, given a t×1𝑡1t\times 1 observation vector O=x𝑂𝑥O=x. We will compute η1(x)subscript𝜂1𝑥\eta_{1}(x). The other estimators can be computed similarly.

It is easy to check that one can represent Zisubscript𝑍𝑖Z_{i}, i[k]𝑖delimited-[]𝑘i\in[k] by ΘiNisubscriptΘ𝑖subscript𝑁𝑖\Theta_{i}N_{i}, where ΘksuperscriptΘ𝑘\Theta^{k} are independent binary random variables with (Θi=1)=αisubscriptΘ𝑖1subscript𝛼𝑖\mathbb{P}(\Theta_{i}=1)=\alpha_{i} and Nksuperscript𝑁𝑘N^{k} are independent zero mean Gaussian variables with variance 1αi1subscript𝛼𝑖\frac{1}{\alpha_{i}}. Assume that ΣΣ\Sigma is the covariance matrix of Nksuperscript𝑁𝑘N^{k} with diagonal elements Σii=1αisubscriptΣ𝑖𝑖1subscript𝛼𝑖\Sigma_{ii}=\frac{1}{\alpha_{i}} and zero elsewhere. Let a1subscript𝑎1a_{1} denote the first row of A𝐴A and assume that for a given binary sequence θksuperscript𝜃𝑘\theta^{k} and for an arbitrary n×k𝑛𝑘n\times k matrix B𝐵B, B(θk)𝐵superscript𝜃𝑘B(\theta^{k}) denotes an n×k𝑛𝑘n\times k matrix whose i𝑖i-th column is the i𝑖i-th column of B𝐵B provided θi=1subscript𝜃𝑖1\theta_{i}=1 and zero otherwise.

Using the conditioning on ΘksuperscriptΘ𝑘\Theta^{k}, we have

η1(x)subscript𝜂1𝑥\displaystyle\eta_{1}(x) =θk{0,1}k𝔼(S1|O=x,Θk=θk)(θk|O=x).absentsubscriptsuperscript𝜃𝑘superscript01𝑘𝔼formulae-sequenceconditionalsubscript𝑆1𝑂𝑥superscriptΘ𝑘superscript𝜃𝑘conditionalsuperscript𝜃𝑘𝑂𝑥\displaystyle=\sum_{\theta^{k}\in\{0,1\}^{k}}\mathbb{E}(S_{1}|O=x,\Theta^{k}=\theta^{k})\mathbb{P}(\theta^{k}|O=x).

Conditioned on θksuperscript𝜃𝑘\theta^{k}, S1=a1(θk)Nsubscript𝑆1subscript𝑎1superscript𝜃𝑘𝑁S_{1}=a_{1}(\theta^{k})N is a zero mean Gaussian with variance a1(θk)Σa1(θk)subscript𝑎1superscript𝜃𝑘Σsubscript𝑎1superscriptsuperscript𝜃𝑘a_{1}(\theta^{k})\Sigma\,a_{1}(\theta^{k})^{*}. The observation vector is also Gaussian with a zero mean and a covariance matrix A(θk)ΣA(θk)+Σ~𝐴superscript𝜃𝑘Σ𝐴superscriptsuperscript𝜃𝑘~ΣA(\theta^{k})\Sigma\,A(\theta^{k})^{*}+\tilde{\Sigma}, thus the estimation of S1subscript𝑆1S_{1} is reduced to a Gaussian estimation problem where the estimator is known to be a linear function of observation. Let S^1(θk,x)=a(θk)ΣA(θk)(A(θk)ΣA(θk)+Σ~)1xsubscript^𝑆1superscript𝜃𝑘𝑥𝑎superscript𝜃𝑘Σ𝐴superscript𝜃𝑘superscript𝐴superscript𝜃𝑘Σ𝐴superscriptsuperscript𝜃𝑘~Σ1𝑥\hat{S}_{1}(\theta^{k},x)=a(\theta^{k})\Sigma A(\theta^{k})(A(\theta^{k})\Sigma A(\theta^{k})^{*}+\tilde{\Sigma})^{-1}x. It is easy to check that 𝔼(S1|O=x,Θk=θk)=S^1(θk,x)𝔼formulae-sequenceconditionalsubscript𝑆1𝑂𝑥superscriptΘ𝑘superscript𝜃𝑘subscript^𝑆1superscript𝜃𝑘𝑥\mathbb{E}(S_{1}|O=x,\Theta^{k}=\theta^{k})=\hat{S}_{1}(\theta^{k},x). Therefore, one obtains

η1(x)subscript𝜂1𝑥\displaystyle\eta_{1}(x) =θkS^1(θk,x)(θk|O=x)absentsubscriptsuperscript𝜃𝑘subscript^𝑆1superscript𝜃𝑘𝑥conditionalsuperscript𝜃𝑘𝑂𝑥\displaystyle=\sum_{\theta^{k}}\hat{S}_{1}(\theta^{k},x)\mathbb{P}(\theta^{k}|O=x)
=1po(x)θkS^1(θk,x)(θk)po(x|θk)absent1subscript𝑝𝑜𝑥subscriptsuperscript𝜃𝑘subscript^𝑆1superscript𝜃𝑘𝑥superscript𝜃𝑘subscript𝑝𝑜conditional𝑥superscript𝜃𝑘\displaystyle=\frac{1}{p_{o}(x)}\sum_{\theta^{k}}\hat{S}_{1}(\theta^{k},x)\mathbb{P}(\theta^{k})p_{o}(x|\theta^{k})
=θkS^1(θk,x)(θk)𝖭(0,A(θk)ΣA(θk)+Σ~,x)θk(θk)𝖭(0,A(θk)ΣA(θk)+Σ~,x),absentsubscriptsuperscript𝜃𝑘subscript^𝑆1superscript𝜃𝑘𝑥superscript𝜃𝑘𝖭0𝐴superscript𝜃𝑘Σ𝐴superscriptsuperscript𝜃𝑘~Σ𝑥subscriptsuperscript𝜃𝑘superscript𝜃𝑘𝖭0𝐴superscript𝜃𝑘Σ𝐴superscriptsuperscript𝜃𝑘~Σ𝑥\displaystyle=\frac{\sum_{\theta^{k}}\hat{S}_{1}(\theta^{k},x)\mathbb{P}(\theta^{k})\mathsf{N}(0,A(\theta^{k})\Sigma A(\theta^{k})^{*}+\tilde{\Sigma},x)}{\sum_{\theta^{k}}\mathbb{P}(\theta^{k})\mathsf{N}(0,A(\theta^{k})\Sigma A(\theta^{k})^{*}+\tilde{\Sigma},x)},

where 𝖭(μ,C,x)=1(2π)ndet(C)exp(12(xμ)C1(xμ))𝖭𝜇𝐶𝑥1superscript2𝜋𝑛𝐶12superscript𝑥𝜇superscript𝐶1𝑥𝜇\mathsf{N}(\mu,C,x)=\frac{1}{\sqrt{(2\pi)^{n}\det(C)}}\exp(-\frac{1}{2}(x-\mu)^{*}C^{-1}(x-\mu)) denotes the Gaussian distribution with mean μ𝜇\mu and covariance matrix C𝐶C.