Does the Debris Disk around HD 32297 Contain Cometary Grains?***Based on observations made at the Large Binocular Telescope (LBT). The LBT is an international collaboration among institutions in the United States, Italy and Germany. LBT Corporation partners are: The University of Arizona on behalf of the Arizona university system; Istituto Nazionale di Astrosica, Italy; LBT Beteiligungsgesellschaft, Germany, representing the Max-Planck Society, the Astrophysical Institute Potsdam, and Heidelberg University; The Ohio State University, and The Research Corporation, on behalf of The University of Notre Dame, University of Minnesota and University of Virginia.+++Based on observations made using the Large Binocular Telescope Interferometer (LBTI). LBTI is funded by the National Aeronautics and Space Administration as part of its Exoplanet Exploration program.
Abstract
We present an adaptive optics imaging detection of the HD 32297 debris disk at (3.8 m) obtained with the LBTI/LMIRcam infrared instrument at the LBT. The disk is detected at signal-to-noise per resolution element (SNRE) 3-7.5 from 03-11 (30-120 AU). The disk at is bowed, as was seen at shorter wavelengths. This likely indicates the disk is not perfectly edge-on and contains highly forward scattering grains. Interior to 50 AU, the surface brightness at rises sharply on both sides of the disk, which was also previously seen at band. This evidence together points to the disk containing a second inner component located at 50 AU. Comparing the color of the outer (50 /AU ) portion of the disk at with archival HST/NICMOS images of the disk at 1-2 m allows us to test the recently proposed cometary grains model of Donaldson et al. (2013). We find that the model fails to match the disk’s surface brightness and spectrum simultaneously (reduced chi-square = 17.9). When we modify the density distribution of the model disk, we obtain a better overall fit (reduced chi-square = 2.9). The best fit to all of the data is a pure water ice model (reduced chi-square = 1.06), but additional resolved imaging at 3.1 m is necessary to constrain how much (if any) water ice exists in the disk, which can then help refine the originally proposed cometary grains model.
Subject headings:
instrumentation: adaptive optics — techniques: high angular resolution — stars: individual (HD 32297) — circumstellar matter — planetary systems1. Introduction
Debris disks, which are thought to be continually replenished by collisions between large planetesimals (Wyatt, 2008), can point to interesting planets in several ways: with warps and/or gaps (Lagrange et al., 2010), sharp edges (Schneider et al., 2009; Chiang et al., 2009), and with their specific dust grain compositions. Since many outer solar system bodies contain copious amounts of water ice and organic materials, finding other debris disk systems that contain water ice and/or organic materials (Debes et al., 2008a) would point to planetary systems that might contain the ingredients necessary for Earth-like life. Therefore constraining the dust grain compositions in debris disks is crucial.
Narrow and broadband scattered light imaging is a particularly powerful tool for constraining composition because it can substitute for spectra that would otherwise be too difficult to obtain. The wavelength range between 1-5 m, in particular, contains strong absorption features for water ice and organics like tholins (both near 3.1 m; Inoue et al. (2008); Buratti et al. (2008)). Imaging at these wavelengths from the ground using adaptive optics (AO) also offers high Strehl ratios, allowing for more precise characterization of faint extended sources close to their host stars.
Obtaining high signal-to-noise (S/N) detections of faint debris disks at these wavelengths from the ground is challenging due to the bright thermal background of Earth’s atmosphere, as well as the warm glowing surfaces in the optical path of the telescope. An AO system that suppresses unwanted thermal noise is necessary to overcome these obstacles. The Large Binocular Telescope (LBT), combined with the Large Binocular Telescope Interferometer (LBTI, Hinz et al. (2008)), is one such system. The LBT AO system (Esposito et al., 2011) consists of two secondary mirrors (one for each primary) that can each operate with up to 400 modes of correction, resulting in very high Strehl ratios ( 70-80 at band, 90 at band, and 90 at longer wavelengths). This equates to very high-contrast, high-sensitivity imaging capabilities, allowing detections of planets and debris disks that were previously too difficult.
HD 32297 is a young A star located 112 pc away (van Leeuwen, 2007) surrounded by a bright edge-on debris disk. The disk has recently been resolved at band (2.15 m) by Currie et al. (2012), Boccaletti et al. (2012), and Esposito et al. (2013). The disk has also been detected in the far-infrared (FIR) by Herschel (Donaldson et al. 2013, hereafter D13), who modeled the disk as consisting of porous cometary grains (silicates, carbonaceous material, water ice).
To further test this model, we have obtained a high S/N image of the disk at (3.8 m) with LBTI/LMIRcam. Using this new image, along with archival HST/NICMOS images of the disk at 1-2 m from Debes et al. (2009)111While resolved images of the disk have also been obtained from the ground at these wavelengths, the HST data are preferred because they do not suffer from the biases inherent in ADI/PCA data reduction., we determine how well the D13 cometary grains model matches the scattered light of the disk at 1-4 m.
In Section 2 we describe the observations and data reduction. In Section 3 we present our results on the disk’s surface brightness (SB) from 1-4 m, analysis of the disk’s morphology, and our detection limits on planets in the system. In Section 4 we present our modeling of the disk. In Section 5 we discuss the implications of our results on the disk’s structure and composition, and in Section 6 we summarize and conclude.
2. Observations and Data Reduction
2.1. Observations
We observed HD 32297 on the night of UT November 4 2012 at the LBT on Mt. Graham in Arizona. We used LBTI/LMIRcam and observed at (3.8 m). LMIRcam has a field of view (FOV) of 11 on a side and a plate scale of 00107/pixel. Skies were clear during the observations, and the seeing was 13 throughout. Observations were made in angular differential imaging mode (ADI; Marois et al. (2006)), and no coronagraphs were used. We used the single left primary mirror with its deformable secondary mirror operating at 400 modes for the AO correction. To increase nodding efficiency, we chopped an internal mirror (rather than nodding the entire telescope) by several arcseconds every few minutes to obtain images of the sky background. While this method did dramatically increase efficiency (to 85), neglecting to move the telescope resulted in a residual “patchy” background that remained even after sky subtraction. This was due to the difference in optical path through the instrument, such that the chop positions were not perfectly matched. Ultimately we removed this unwanted background by unsharp-masking all images, which results in self-subtraction of the debris disk; we account for and mitigate this effect via insertion of artificial disks, which we discuss in Section A.
We obtained 759 images of HD 32297 in correlated double sampling (CDS) mode, so that each image cube consisted of 15 coadded minimum exposure (0.029 s) images containing the unsaturated star (for photometric comparison), and 15 coadded 0.99 s science exposure images with the core of the star saturated out to 01. After filtering out images taken while the AO loop was open222Filtering out images of poor quality can be accomplished in several ways: the fits headers contain keywords relating to the status of the AO loop, which a user can check in the data reduction; the raw images themselves can be examined by the user to check the appearance of the PSF (pointy vs. blurry); or the user can check the log of the observations, which should denote when/where problems with the AO occurred. We used the first and third options to filter out open loop data on HD 32297., the final dataset consisted of 726 images, resulting in 2.99 hours of continuous integration (not including the minimum exposure photometric images). Throughout the observations, which began just after the star’s transit, the FOV rotated by 50.84∘, enabling the star itself to act as the point spread function (PSF) reference for subtraction during data reduction.
2.2. Data reduction
All data reduction discussed below was performed with custom Matlab scripts. We first divided each science exposure image by the number of coadds (15) and integration time (0.99 s) to obtain units of counts/s for each pixel. Next we corrected for bad pixels and subtracted opposite chop beam images of the star to remove detector artifacts and the sky background, resulting in flat images with 0 background counts/s, except for the “patchy” regions of higher sky noise. We determined the sub-pixel location of the star in each sky-subtracted image by calculating the center of light inside a 05 aperture centered on the approximate location of the star.333Since the PSF is only saturated out to 01, it contributes very little to the center of light calculation; we have demonstrated sub-pixel accuracy using this method in Rodigas et al. (2012). We then registered each image so that the star’s location was at the exact center of each image. We binned each image by a factor of 2 to ease the computational load required in processing 726 images, which is not a problem because the PSF is still oversampled by more than a factor of 4. To reduce the level of the patchy sky background, for each image we subtracted a 15 pixel (032) by 15 pixel box median-smoothed image from itself. The unsaturated minimum exposure images were reduced as detailed above, except for this last step of unsharp masking, since the majority of the star’s flux does not overlap with the background patches. It is also not necessary to unsharp mask the unsaturated photometric images because, as will be discussed in Section A, we compute the fully-corrected disk flux that accounts for the unsharp masking and other biases inherent in the data reduction.
During the observing run, the LMIRcam detector suffered from “S-shaped” non-linearity (which has since been corrected). This had the effect of artificially inflating raw counts per pixel at long exposures relative to short exposures, complicating photometric comparisons. Using a linearity curve constructed from images taken throughout the observing run, we multiplied each reduced image’s pixels by the corresponding linearity correction factors. We verified the effectiveness of the linearity correction by comparing the total flux within an annulus centered on the star between 01-02 for the unsaturated (linear) final image and the final (linearity-corrected) long exposure image; the median counts/s for the two images agreed to within 4, verifying the linearity correction.
As a first check on the efficacy of the steps described above, we performed classical ADI subtraction by subtracting a median-combined master PSF image from all the images, and then derotating the images by their parallactic angle at the time of the exposure. The resulting image revealed edge-on disk structure at the expected position angle (PA) of 47∘(Debes et al., 2009; Mawet et al., 2009).
To obtain the highest possible S/N detection of HD 32297’s debris disk, we reduced the images using principal component analysis (PCA, Soummer et al. (2012)). PCA has recently been shown to produce equal-to or higher S/N detections of planets and disks (Thalmann et al., 2013; Bonnefoy et al., 2013; Boccaletti et al., 2013; Soummer et al., 2012; Meshkat et al., 2013) than LOCI (Lafrenière et al., 2007), though this may be a result of LOCI’s tunable parameters not being optimized correctly (C. Marois, private communication). We did also reduce the data using conventional LOCI algorithms (Rodigas et al., 2012; Currie et al., 2012; Thalmann et al., 2011) but found that the gain in computational speed for PCA with no loss in S/N warranted the ultimate preference of PCA over LOCI for this dataset.
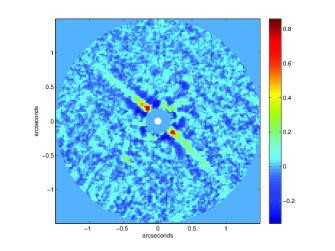
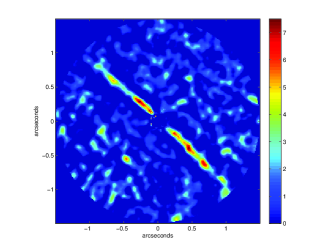
We followed the prescription outlined in Soummer et al. (2012), with the main tunable parameter being , the number of modes to use for a given reduction. Increasing reduces the noise in the final image but also suppresses the flux from the disk; therefore this parameter must be optimized. After examining the average S/N per resolution element (SNRE)444As in Rodigas et al. (2012), the SNRE map is calculated by convolving the final image by a Gaussian with full-width half-maximum = 0094, constructing a noise image by computing and storing the standard deviation in concentric annuli of width = 1 pixel around the star, then dividing the final Gaussian-smoothed image by this noise image. over the disk’s spatial extent for varying values of , we determined the optimal number of modes to be (out of a possible 726). We then fed all the images through our PCA pipeline, rotated the images by their corresponding PAs clockwise to obtain North-up East-left, and combined the images using a mean with sigma clipping. Fig. 1a shows this final image, and Fig. 1b shows the corresponding SNRE map. We detect the disk from 03-11 (30-120 AU) at SNRE 3-7.5, which is a significant improvement from our previous imaging of HD 15115 (Rodigas et al., 2012). The detection of the disk at high S/N allows us to more precisely measure its SB, which in turn results in better constraints on the composition and size of the dust grains producing the observed scattered light.
3. Results
3.1. Calculation of Uncertainties
For all the images analyzed in this study, the uncertainties are dominated by residuals left over from PSF subtraction. Specifically, both the HST and LBT data suffer from azimuthal and radial residual structures. For the LBT data, we computed the standard deviation of the equivalent SB measurements all around the star (excluding the disk). For the HST data, we calculated the errors in two ways: by computing the equivalent SB measurements 90∘away from the real disk; and by computing the standard deviation of the equivalent SB measurments all around the star (excluding the disk). We found that both methods resulted in comparable errors, therefore we chose to use the second method since this method was also used for computing the errors on the LBT data.
3.2. Surface Brightness Profiles
| 3.8 m | 2.05 m | 1.6 m | 1.1 m | |
| northeast outer () | -1.5 (-2.45, -0.55)∗ | -1.83 (-2.12, -1.53) | -1.56 (-1.99, -1.13) | -1.33 (-1.73, -0.93) |
| southwest outer () | -1.3 (-1.86, -0.72) | -1.56 (-1.88, -1.24) | -1.55 (-1.92, -1.17) | -1.32 (-1.52, -1.11) |
| northeast inner () | -2.45 (-3.36, -1.53) | – | – | – |
| southwest inner () | -2.72 (-10.74, 5.3) | – | – | – |
| ∗ These and all other parenthetical values denote 95 confidence bounds. | ||||
In addition to the image of the disk at , we also reanalyzed archival, reduced images of the disk at 1.1, 1.6, and 2.05 m from HST/NICMOS presented in Debes et al. (2009).555We refer the reader to Debes et al. (2009) for these images and descriptions of how they were reduced. For each image, we rotated the disk by 47∘counterclockwise so that its midplane was approximately horizontal in the image. We measured the SB in all the HST/NICMOS images by taking the median value in 3 pixel (02262) by 3 pixel boxes. For the F110W (1.1 m) images, these boxes were centered on the brightest pixel at each specific pixel distance from the star (045-11). For the F160W (1.6 m) and the F205W (2.05 m) images, the boxes were centered on the same pixel locations as were used in the F110W image. We converted the image counts/s to mJy/arcsecond2 using the reported photometric conversions given on the Space Telescope Science Institute website and applied the appropriate correction factors to the data (see the Appendix for a detailed description of these correction factors).
For the final image, we calculated the median counts/s in a 5 pixel (0106) by 5 pixel box centered on the brightest pixel at each horizontal distance from 045-11 from the star, and divided this number by the plate scale of the binned images (00212) squared. We used a smaller aperture for the data than for the HST/NICMOS data due to the disk appearing thinner (FWHM 01 /D) at , and to avoid the large negative residuals above and below the disk close to the star. We converted these values to mJy/arcsecond2 using the total measured flux in the unsaturated photometric image of HD 32297 and applied the appropriate correction factors to the data (see the Appendix for a detailed description of these correction factors).
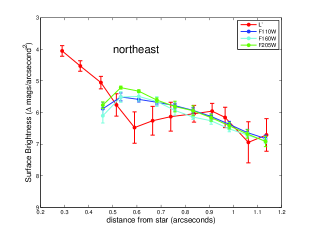
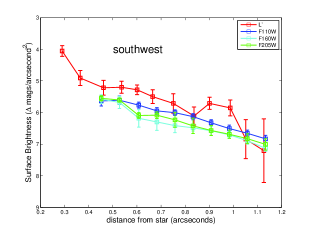
Fig. 2 shows the final, corrected SB of the disk at 1-2 m and at 3.8 m. The star’s magnitude at 1-2 m (7.7) and (7.59) has been subtracted from the disk magnitude/arcsecond2 to yield the intrinsic disk color at each wavelength. We find that the SB profile is asymmetric from 05-08 (56-90 AU) at , in agreement with the asymmetry at band reported by Currie et al. (2012) and Esposito et al. (2013). We do not find evidence for asymmetry interior to 04 (45 AU), however, with no evidence for the bright spot identified as a mm peak by Maness et al. (2008) and also seen at band by Currie et al. (2012). Exterior to 08 (90 AU), both sides of the disk are equal SB at . The HST data are generally consistent from 1-2 m, within the uncertainties, except for interior to 08 (90 AU) where the northeastern lobe appears to be brighter than the southwestern lobe.
We fit the SB profiles at each wavelength to functions with power-law form (see Table 1). We find that the indices are all within 2 of each other for the outer portion of the disk (), with most values between -1.3 and -1.5. Interior to 04, the disk is not detected at 1-2 m with HST/NICMOS but is detected at . At these close distances, the disk SB clearly falls faster, declining like . We do not compare our reported power-law indices to indices reported in other works measured farther from the star because the disk is thought to have a break in the SB distribution near 110 AU (1 ; Boccaletti et al. 2012; Currie et al. 2012).
3.3. Midplane Offset Measurements
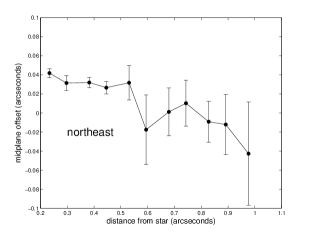

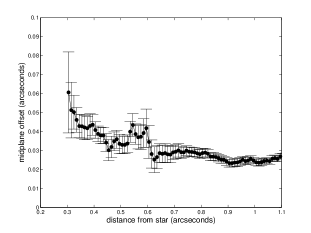
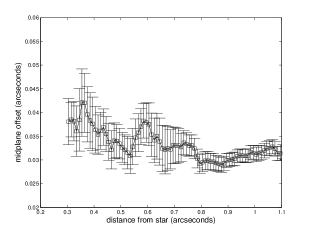
Currie et al. (2012) measured the PA of the HD 32297 debris disk as a function of separation from the star at band and found that the disk was bowed close to the star. Similar bowing was reported by Boccaletti et al. (2012) and Esposito et al. (2013). To test whether the bow shape is seen at , we measured the offset of the disk relative to the midplane as a function of distance from the star. We measure the midplane offset, as opposed to the disk’s PA, because the former is a more intuitive indicator of a bow-shaped disk. The offsets were measured in manners analogous to those described in Rodigas et al. (2012) and Currie et al. (2012). Fig. 3 shows these offsets for the northeastern and southwestern lobes, along with the midplane offsets for the band data from Currie et al. (2012) for reference. The disk is clearly bowed at , with the offsets increasing closer to the star on both sides of the disk to a peak value of 004 (4.5 AU). This is comparable to the peak midplane offset reported by Esposito et al. (2013) and agrees with the peak offsets in the band data (Fig. 3c and Fig. 3d).
3.4. Revised Spectral Classification, Luminosity, Mass, and Age of HD 32297
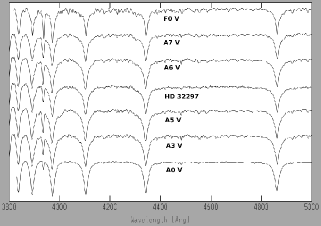

Estimating the masses of exoplanets detected via direct imaging requires atmospheric models, which depend heavily on the age of the planet and therefore on the host star. The age of HD 32297, like many stars, is poorly constrained. Estimates of the star’s spectral type, which can be used to constrain its age, have ranged from A0 (Torres et al., 2006) to A5 (Heckmann, 1975). Based on an archival optical spectrum of the star taken on 2 February 2006 with the 300 line grating of the FAST spectrograph on the Tillinghast telescope666see FAST archive at http://tdc-www.harvard.edu/cgi-bin/arc/fsearch, and comparison of the spectrum to a dense grid of MK standard stars using the python tool “sptool”777http://rumtph.org/pecaut/sptool/, we estimate the star’s spectral type to be kA3hA6mA6 V (see Fig. 4a).888Each of the lower-case prefix letters corresponds to a different spectral typing method; “k” refers to the star’s spectral type based on Ca K absorption; “h” refers to the star’s hydrogen type; “m” refers to the star’s metal-type. The oft-quoted spectral type for the star of A0 is clearly too hot. Based on the hydrogen type of A6, we adopt an effective temperature of Teff = 8000 150 K on the modern dwarf Teff vs. spectral type scale from Pecaut & Mamajek (2013). Plotting the star’s updated position on an HR diagram (Fig. 4b), along with isochrones from the evolutionary tracks of Bressan et al. (2012), we estimate that HD 32297 is older than 15 Myr and younger than 0.5 Gyr. The star’s kinematics and the debris disk’s high fractional luminosity both point to a young age for the star ( 10-20 Myr). However, we conservatively adopt a stellar age of 100 Myr for this study because no planets are detected, meriting conservative upper limits on planet mass.
We estimate HD 32297’s luminosity as log(L/L⊙) = 0.79 0.09 dex. For three sets of Bertelli et al. (2009) tracks of varying composition, allowing only for varying Teff and log(L) points that were “physical” (i.e. not below the zero age main-sequence), and assuming protosolar composition, we determine the mass of HD 32297 to be 1.65 0.1 M⊙. This is much smaller than the oft-quoted higher mass value ( 3 M⊙) that corresponds to a star of spectral type A0.
3.5. Limits on Planets
In addition to being sensitive to scattered light from debris disks at , imaging at this wavelength is also particularly sensitive to self-luminous planets, which are expected to become redder (from 1-5 m) as they age and cool (Burrows et al., 2003; Baraffe et al., 2003). Understanding the connection between massive planets and debris disks is critical to constraining planetary system architectures and consequently planet formation.
By inspection of the SNRE map in Fig. 1b, only one source stands at 5 above the noise (the typical minimum threshold for detecting imaged exoplanets). However this feature, located 1 below the star to the southeast, is not point-like in the final reduced image (Fig. 1a), is not very symmetrical, and does not persist for different reduction methods (e.g., varying the number of modes used in PCA). Therefore we do not treat this as a real astronomical source. Other than this feature, there are no point-source features outside the disk at S/N 5 in the final image.
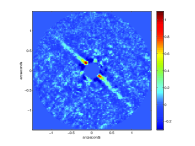
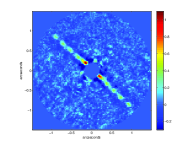
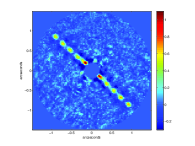
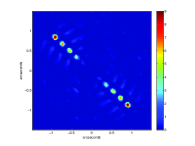
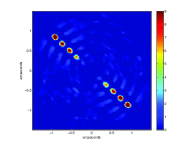
To ascertain what planets we could have detected, we assume that any planets in the HD 32297 system must currently reside within the debris disk itself and therefore insert artificial planets into the midplane of the disk. The insertion of artificial sources into the disk is a valid method because the disk is likely to be optically thin, so the signals from any real embedded planets should travel to Earth relatively unimpeded. We vary the brightnesses of the artificial planets and re-reduce the data until each is recovered at 5 confidence. The S/N is calculated as the peak pixel value in the SNRE map at a given position. Artificial planets are made by extracting the central 0094 (=FWHM at ) of the unsaturated photometric image of HD 32297. The reduction pipeline for the planets uses the same parameters as were used to detect the disk at high S/N except that we set .
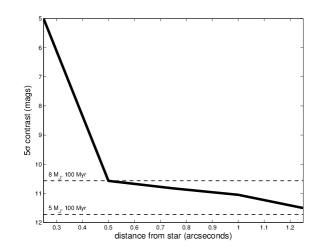
When calculating the S/Ns of the recovered planets, we have to be careful about how we interpret the values since signals from the planets lie on top of the signal from the disk. Therefore any measurement of a recovered planet’s S/N must first subtract out the S/N of the recovered disk. After doing this, only planets at a contrast level of (11.5 mags) were detected at confidence beyond 125. At a contrast level of , all planets with separations 075 were successfully detected, and at all planets at 05 were detected. Within 05, only planets 100 times fainter than the star could be detected at confidence, and even these become highly elongated due to the increased self-subtraction so close to the star. This self-subtraction could in principle be removed by reducing the data more carefully (e.g., including a minimum azimuthal field rotation before subtracting a PSF image), but such an exhaustive optimization of PCA is unnecessary since it would probably not increase contrast levels here by more than a factor of 10. Fig. 5 shows three example images, along with their S/N maps, of artificial planets inserted into the disk. Fig. 6 summarizes all the planet detection results. Adopting a stellar age of 100 Myr and using the hot-start atmospheric models of Baraffe et al. (2003), we rule out planets more massive than 8 MJ at projected separations 05 (56 AU), and planets more massive than 6 MJ beyond 1.25 (140 AU).
4. Modeling the Debris Disk’s Dust
The high S/N images of HD 32297 debris disk at multiple wavelengths provide a unique window into the dust grain properties within the disk. Under the assumption that a single population of grains can explain all the observations, we set out to test the recent models of the HD 32297 disk from D13, which are constrained by observations of the disk at band (Boccaletti et al., 2012) along with detailed FIR SED modeling. The primary structure of their modeled debris disk is that of at least one component with a sharp edge at 110 AU and a drop-off in surface density with increasing radius. An interior, warmer component is preferred to fit an additional hot component of dust (D13, Currie et al. (2012)), but this is unobservable at the current inner working angles. Any model must be able to reproduce the SB distributions in Fig. 2.
4.1. Scattered light model of an optically-thin edge-on disk
We construct a model of the disk in a similar fashion to Currie et al. (2012) (and references therein). An analytical density distribution of dust is generated in a 3 dimensional array and sampled in a Monte Carlo fashion with 2 million particles representing a model dust population. Scattering angles are calculated for the density distribution with a given PA and inclination. Inputs to the model include a cross-sectional averaged asymmetry parameter , which can be used to model the forward scattering nature of a grain model in a self-consistent fashion assuming a specific grain size distribution (Augereau & Beust, 2006; Wolf & Voshchinnikov, 2004):
| (1) |
where is the density of the dust in the disk and is the scattering cross-section. The variable can create an approximate phase function as a function of scattering angle for the dust under the assumption of a Henyey-Greenstein (HG) functional form:
| (2) |
The code can include linear combinations of parameters, which might be appropriate for debris disks and can reproduce the phase function that has been found for the zodiacal dust in the solar system (Currie et al., 2012; Hong, 1985). To convert an observed disk SB into a mass, one must solve for the combination of both the phase function of the dust and the size-averaged cross section of the dust :
| (3) |
We calculated scattering cross-sections and using the real and imaginary parts of the complex indices of refraction for the best-fitting grain model (provided kindly by J. Donaldson, private communication) from the code , which has been designed specifically for fast modeling of debris disks with a size distribution of dust (Wolf & Voshchinnikov, 2004; Ertel et al., 2011). The grain model used here (and by D13) is a 1:2:3 mixture of 90 porous silicates, carbon, and water ice grains 2.1-1000 m in size; such compositions may also be appropriate for other debris disks (e.g., Lebreton et al. 2012). Models were generated for each image (wavelength) with the appropriate pixel scale and sampled in a similar fashion to our SB profiles (Section 3.2). A scaling factor for each lobe of the disk was calculated by ratioing the models with the observed disk SB profiles as a function of wavelength. For the disk’s density distribution, we used the best-fitting distribution in Boccaletti et al. (2012), based on analysis of their band disk data, because D13 also used this model for their geometrical constraints:
| (4) |
where is the midplane number density at the reference distance of 110 AU, and and . We also kept their assumption of = 0.5, which is somewhat degenerate with the choice of an interior steep power law drop-off in density interior to 110 AU. It is also not consistent with Mie calculations of the expected , which is closer to 0.99.
4.2. Comparison to original D13 cometary grains model
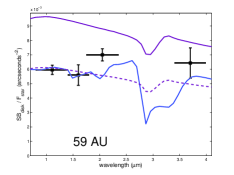
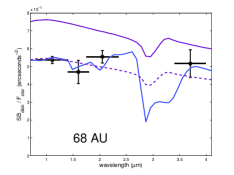
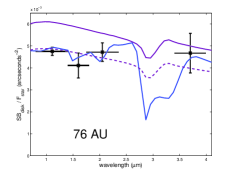
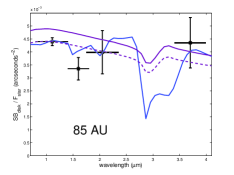
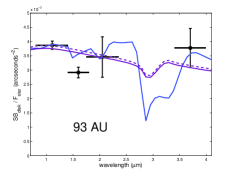
For the D13 model to be accepted as a good match to the data, it must reproduce the disk’s SB at all wavelengths and distances from the star. This can be measured by calculating the reduced chi-square. We accomplish this by summing up the squared difference between the model disk SB and the real disk SB at all wavelengths and at all disk locations, divided by the number of degrees of freedom and the uncertainties squared. We measured this value to be 17.9, indicating a poor fit. To illustrate, Fig. 7 shows the spectrum of the disk at 59-93 AU (black stars), along with the D13 cometary grains model (solid purple lines). The SB values for the northeast and southwest lobes of the disk have been averaged at each wavelength because the D13 model is axisymmetric.
In general, this model overpredicts the disk’s SB and is therefore a poor overall fit. However, at 85-93 AU (Fig. 7d and Fig. 7e), the model does a much better job of fitting the data. This makes sense since Boccaletti et al. (2012) computed the model disk from images in which the disk was only detected beyond 07 (80 AU). More importantly, the discrepancy between the model fit at small and large separations demonstrates the need for resolved imaging with small inner working angles (such as our image).
4.3. Comparison to modified D13 cometary grains model
Seeking to obtain an alternate model fit to the data, we modified the density distribution of the original D13 cometary grains model. This is necessary because the disk’s actual SB at 1-2 m is shallower (lower SB power-laws) than the model disk’s SB. Therefore we modified the model’s dust distribution to better reproduce the data. Specifically we tested different values of and , picking and based on chi-square minimization. This modification resulted in a much improved reduced chi-square value of 2.87. This model is shown in Fig. 7 as the dashed purple lines.
4.4. Comparison to pure water ice model
We also tested a pure water ice model, since the inclusion of water ice significantly improved the model fits to the FIR SED of the disk (D13). Simpler compositions like astronomical silicates are not modeled because these produced poor fits to the FIR SED data (D13), and more complex models like tholins (Debes et al., 2008a) resulted in poor fits to the data . The pure water ice model disk had the same density distribution as the modified D13 model ( and ), except the dust grains were hard spheres 3 m in size. This model is the best fit to all of the available NIR data (Fig. 7; reduced chi-square = 1.09).
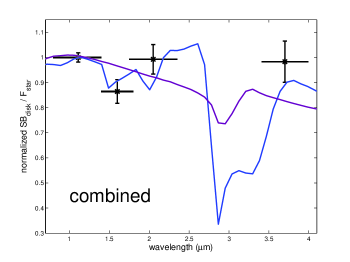
If we ignore the requirement that the models must match the disk’s SB distribution, allowing the model spectra to be arbitrarily scaled to match the disk’s spectrum, we can determine which model is the best spectral fit to the data. To increase the S/N of the data, we normalized the disk spectra from 59-93 AU at 1.1 m and computed the median value at each wavelength. These values are shown in Fig. 8 (black stars). We then scaled the original D13 model spectrum until the residuals between the data and model were minimized. This is shown as the solid purple line in Fig. 8. After optimizing the spectral fit, the D13 model is blue and underpredicts the disk’s SB at 3.8 m, while the real disk’s spectrum is gray within the uncertainties. We repeated this procedure for the pure water ice model. The chi-square value for the water ice model is 3 lower than the D13 model, indicating this model is still preferred over the cometary grains model based on the available data.
5. Discussion
5.1. Disk Structure
Fig. 2 and Fig. 3 allow us to characterize the structure of HD 32297’s debris disk. The SB asymmetry between the two sides of the disk from 05-08 (56-90 AU) at (and band from Currie et al. (2012)) suggests that the northeastern lobe of the disk has a deficit of dust grains here. Furthermore, by inspection of the SB profile power-law indices in Table 1, we can see that interior to 05 (56 AU), the disk’s SB rises very sharply, whereas outside this location the SB increases more slowly. This is exactly the behavior one would expect to see for a disk with a second interior disk component located close to the star. A single-component disk would have a SB profile that either steadily increased close to the star with the same power-law index as further from the star, or a SB profile that flattened out close to the star (e.g., HD 15115 as in Rodigas et al. 2012). The steep rise in SB close the star was also seen at band (Currie et al., 2012), corroborating this feature. The inner component could be located at 50 AU but needs to be confirmed with additional imaging that is sensitive to scattered light close to the star.
This is not the first time a second inner disk component has been suggested for the HD 32297 debris disk. D13 favored a warm inner component for their modeling, and Fitzgerald et al. (2007) used 11 m images to suggest a population of dust grains that peaks near 60 AU. Such thermally-emitting grains may also be contributing to the scattered light that has been detected at 2-4 m. Currie et al. (2012) also preferred multiple belts, including a component at 45 AU, to explain the disk’s observed SB and SED. Our data appear to support the notion of a second interior belt, but additional data with very small inner working angles would help validate this explanation.
The midplane offset profiles show that the disk is bowed close to the star, agreeing with similar findings at band (Currie et al., 2012; Boccaletti et al., 2012; Esposito et al., 2013). We do not explicitly model this phenomenon because we have already showed that it can be explained (for both HD 15115 and HD 32297) by a highly-inclined ring-like disk consisting of forward-scattering grains (Rodigas et al., 2012; Currie et al., 2012).
No high-mass (8 MJ) planets at projected separations 56 AU currently reside in the disk based on our imaging. If such planets exist in this system, their projected separations must be very small, implying either small semimajor axes or an unlucky epoch of imaging. The null detection of high-mass planets in this system, though disappointing, should not be surprising, since there is now copious evidence that such planets are rare at large separations from their stars (e.g., Wahhaj et al. 2013). While lower-mass planets may still reside in the HD 32297 system, detecting them will require more advanced imaging capabilities than are currently available. This is further complicated by the likelihood of such planets residing in the midplane of the disk, which if bright enough, can hide planets. Residuals from PSF subtraction (especially in ADI datasets) can themselves also resemble point sources, and since they can be found anywhere in an image (Fig. 1b), including in the midplane of the disk, distinguishing between real and artificial planets is difficult for systems like HD 32297. Future imaging searches for planets around this star must adequately take into account the effects of both the disk itself and the PSF residuals.
5.2. Dust Grain Composition
D13 found that comet-like porous grains consisting of silicates, carbon, and water ice were the best match to the HD 32297 disk SED at wavelengths longer than 25 m. Based on our analysis of the disk’s 1-4 m SB and spectrum, we cannot lend further evidence to support this claim, at least with respect to their original model. The overall agreement between the data and the D13 model is poor (reduced chi-square = 17.9).
This does not necessarily exclude comet-like materials from being present in the disk. We were able to achieve a much better fit simply by altering the dust density distribution in the original cometary grains model. It may be that additional tweaking of model parameters will yield an even better fit. Furthermore D13 reported only one “comet” combination; other combinations with differing ratios of carbon/silicates/water ice and perhaps the dust’s porosity might better match the disk’s spectrum at m. Because the spectral coverage is currently sparse from 1-4 m, complex cometary grain modeling is beyond the scope of this paper.
The best fit to the data is achieved by a pure water ice model, likely due to the fact that the model is gray from 1-4 m, like the disk. This model has a very deep absorption feature near 3.1 m, evident in Fig. 8. The feature is also evident in the cometary grains model, though it is much shallower. Therefore a key additional test of the disk’s dust grain composition would be obtaining very high S/N photometry of the disk using a narrowband filter centered around 3.1 m. This would help determine if the disk’s dust contains any water ice (e.g., Honda et al. 2009), which could then be used to refine the D13 cometary grains model.
Other dust grain compositions not tested in this work may also better support the available data. For example, a perfectly flat/gray model spectrum might better fit the disk’s NIR spectrum, even if such a dust composition is not easily explained. This is why obtaining a disk detection at 3.1 m is crucial; it can help distinguish between various dust models that might fit the available NIR data.
5.3. Limitations
While our pure water ice model is the best match to the scattered light data, it may not be for the FIR data (used by D13). Our model must reproduce all of the available photometry at all stellocentric distances to be accepted as valid; therefore our scattered light modeling should not be considered final. This is especially true because we currently lack data near 3.1 m, where our preferred model has a very deep absorption feature. We stress that the goal of this study was to test the originally-proposed D13 cometary grains model; if that failed to fit the data, the goal was to find a reasonable alternative. Pure water ice is one such alternative composition, and it makes predictions that are testable with future data, which can then help refine the original cometary grains model.
We also note that producing scattered light models of debris disks comes with several problems. The scattering asymmetry parameter, , is not self-consistent when computed using the Mie formalism. Additionally the commonly assumed single component HG formalism may not be appropriate for this disk (Currie et al., 2012). This would immediately make modeling the dust composition more complicated and beyond the scope of this initial effort. Finally the increasing evidence that the disk may have an inner component at 50 AU further complicates the modeling process, since we would then have to consider the possibility of two separate dust populations with two different dust compositions. At this time, it is unclear what the underlying distribution of dust is around HD 32297. Lacking this knowledge, assuming a single disk component as we have in this study is a reasonable starting point.
6. Summary
We have presented an imaging detection of the HD 32297 debris disk at . The disk is detected at high S/N from 03-11 (30-120 AU). Based on our imaging, we show that the system does not contain any planets more massive than 8 MJ beyond 05.
The disk at is bowed, as was seen at band. This likely indicates that the disk is inclined by a few degrees from edge-on and contains highly forward-scattering grains (Rodigas et al., 2012). The SB at interior to 50 AU rises sharply, as was also seen at band (Currie et al., 2012). This evidence together suggests that the disk may contain a second inner component located at 50 AU.
Comparing the disk’s color at 1-4 m over the outer portion of the disk ( AU) with the recently proposed cometary dust grain model of D13 shows that this model is a poor overall fit to the disk’s SB distribution and spectrum (reduced chi-square = 17.9). A modified version of this model produces a much better overall fit to all the data (reduced chi-square = 2.87). The best fit to the data is achieved with a pure water ice model, though this model is not the only possible dust composition. Additional imaging of the disk near 3.1 m can help constrain the fractional amount of water ice in the dust. This will then help determine how similar the HD 32297 dust grains are to comet-like grains.
Appendix A Surface Brightness Corrections
Determining the SB of the disk as a function of distance from the star at multiple wavelengths requires several steps to ensure the correct quantities are measured (Debes et al., 2008b). The true SB of an edge-on debris disk a distance away from the star is computed as follows:
| (A1) |
where the PSF convolution correction (often referred to as “aperture correction”) is employed to account for non-infinite photometric apertures, and the latter two corrections are only necessary if different aperture sizes are used at different wavelengths and if the data reduction pipeline alters the SB of the disk as a function of distance from the star.
We computed the appropriate corrections necessary for the HST/NICMOS and LBTI/LMIRcam data. The PSF convolution correction was computed as follows. We produced unconvolved and convolved model disk images (with parameters determined from the best-fitting model used in Boccaletti et al. 2012). In total, we generated one unconvolved model image for the HST/NICMOS data (since all the HST data was taken at the same plate scale), and one unconvolved model image for the higher-resolution LBTI/LMIRcam data. Four convolved images (one for each wavelength) were produced by convolving the corresponding unconvolved model image with the appropriate PSF template (either HST/NICMOS or LBTI/LMIRcam).
We measured the SB in all the HST/NICMOS model images using the same 3 pixel (02262) by 3 pixel boxes as were used on the real disk images. We first computed the SB in each box for the unconvolved images, then we computed the SB values in the convolved images and determined the appropriate correction factors needed to obtain the same SB in the unconvolved and convolved images as a function of distance from the star.
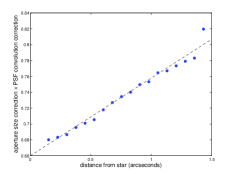
The aperture size correction was only needed for the data, since a smaller photometric aperture was used. We compared the median SB in the unconvolved model HST image (computed using the 3 pixel (02262) by 3 pixel boxes) with the equivalent quantity in the unconvolved model image (computed using the 5 pixel (0106) by 5 pixel boxes). The correction factors were computed as the ratio of these two values as a function of distance from the star. To illustrate, Fig. 9c shows the aperture size corrections the PSF convolution corrections for the data.
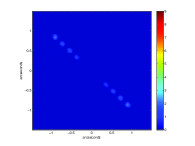
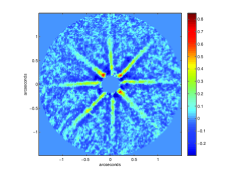
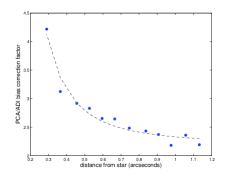
Finally, the data required a correction to account for the biases inherent in PCA + ADI data reduction (e.g., Rodigas et al. 2012; Currie et al. 2012). We measured these biases by inserting artificial disks into the raw images at differing PAs, re-reducing the data, and computing the correction factors based on how the SB of the artificial disks changed.999Esposito et al. (2013) showed that forward-modeling was a potentially more accurate method for determining the true SB of edge-on disks. However their method currently requires the use of LOCI, rather than PCA, therefore we do not employ their method in this study. We inserted three artificial disks (the best-matching model from Boccaletti et al. 2012) of varying brightness and PA into the raw images. Specifically, the first disk was slightly brighter than the real disk and located 90∘away; the second was 10 fainter than the first and located 45∘away; and the third was 25 fainter than the first and located 135∘away. We chose to insert disks of varying SB and PA to better account for the biases inherent in the PCA reduction.
After recovering both the real and artificial disks (Fig. 9a), we measured the PCA correction factors101010For two of the artifical disks, the azimuthal separation from the real disk is less than the total parallactic angle rotation (50.84∘), which can cause additional unwanted subtraction in the real disk. However, we have determined that this effect is negligible for our data. as a function of separation from the star by comparing the median counts/s in the same 5 pixel (0106) by 5 pixel boxes measured on the PCA-processed artificial disks with the equivalent measurements on the pure, unaltered, noiseless model disk images. We recorded the ratio of these two numbers as a function of distance from the star and PA, then we averaged all the values together at each separation. Fig. 9b shows these correction factors.
With all correction factors computed as a function of separation from the star for each wavelength, we used Eq. A1 to correct the measured SB to the true SB of the disk.
References
- Augereau & Beust (2006) Augereau, J.-C., & Beust, H. 2006, A&A, 455, 987
- Baraffe et al. (2003) Baraffe, I., Chabrier, G., Barman, T. S., Allard, F., & Hauschildt, P. H. 2003, A&A, 402, 701
- Bertelli et al. (2009) Bertelli, G., Nasi, E., Girardi, L., & Marigo, P. 2009, A&A, 508, 355
- Boccaletti et al. (2012) Boccaletti, A., et al. 2012, A&A, 544, A85
- Boccaletti et al. (2013) Boccaletti, A., Lagrange, A.-M., Bonnefoy, M., Galicher, R., & Chauvin, G. 2013, A&A, 551, L14
- Bonnefoy et al. (2013) Bonnefoy, M., et al. 2013, ArXiv e-prints
- Bressan et al. (2012) Bressan, A., Marigo, P., Girardi, L., Salasnich, B., Dal Cero, C., Rubele, S., & Nanni, A. 2012, MNRAS, 427, 127
- Buratti et al. (2008) Buratti, B. J., et al. 2008, Icarus, 193, 309
- Burrows et al. (2003) Burrows, A., Sudarsky, D., & Lunine, J. I. 2003, ApJ, 596, 587
- Chiang et al. (2009) Chiang, E., Kite, E., Kalas, P., Graham, J. R., & Clampin, M. 2009, ApJ, 693, 734
- Currie et al. (2012) Currie, T., et al. 2012, ApJ, 757, 28
- Debes et al. (2009) Debes, J. H., Weinberger, A. J., & Kuchner, M. J. 2009, ApJ, 702, 318
- Debes et al. (2008a) Debes, J. H., Weinberger, A. J., & Schneider, G. 2008a, ApJ, 673, L191
- Debes et al. (2008b) Debes, J. H., Weinberger, A. J., & Song, I. 2008b, ApJ, 684, L41
- Donaldson et al. (2013) Donaldson, J. K., Lebreton, J., Roberge, A., Augereau, J.-C., & Krivov, A. V. 2013, ArXiv e-prints
- Ertel et al. (2011) Ertel, S., Wolf, S., Metchev, S., Schneider, G., Carpenter, J. M., Meyer, M. R., Hillenbrand, L. A., & Silverstone, M. D. 2011, A&A, 533, A132
- Esposito et al. (2011) Esposito, S., et al. 2011, in Society of Photo-Optical Instrumentation Engineers (SPIE) Conference Series, Vol. 8149, Society of Photo-Optical Instrumentation Engineers (SPIE) Conference Series
- Esposito et al. (2013) Esposito, T. M., Fitzgerald, M. P., Graham, J. R., & Kalas, P. 2013, ArXiv e-prints
- Fitzgerald et al. (2007) Fitzgerald, M. P., Kalas, P. G., & Graham, J. R. 2007, ApJ, 670, 557
- Heckmann (1975) Heckmann, O. 1975, AGK 3. Star catalogue of positions and proper motions north of -2.5 deg. declination
- Hinz et al. (2008) Hinz, P. M., et al. 2008, in Society of Photo-Optical Instrumentation Engineers (SPIE) Conference Series, Vol. 7013, Society of Photo-Optical Instrumentation Engineers (SPIE) Conference Series
- Honda et al. (2009) Honda, M., et al. 2009, ApJ, 690, L110
- Hong (1985) Hong, S. S. 1985, A&A, 146, 67
- Inoue et al. (2008) Inoue, A. K., Honda, M., Nakamoto, T., & Oka, A. 2008, PASJ, 60, 557
- Lafrenière et al. (2007) Lafrenière, D., Marois, C., Doyon, R., Nadeau, D., & Artigau, É. 2007, ApJ, 660, 770
- Lagrange et al. (2010) Lagrange, A., et al. 2010, Science, 329, 57
- Lebreton et al. (2012) Lebreton, J., et al. 2012, A&A, 539, A17
- Maness et al. (2008) Maness, H. L., Fitzgerald, M. P., Paladini, R., Kalas, P., Duchene, G., & Graham, J. R. 2008, ApJ, 686, L25
- Marois et al. (2006) Marois, C., Lafrenière, D., Doyon, R., Macintosh, B., & Nadeau, D. 2006, ApJ, 641, 556
- Mawet et al. (2009) Mawet, D., Serabyn, E., Stapelfeldt, K., & Crepp, J. 2009, ApJ, 702, L47
- Meshkat et al. (2013) Meshkat, T., Kenworthy, M., Quanz, S. P., & Amara, A. 2013, ArXiv e-prints
- Pecaut & Mamajek (2013) Pecaut, M. J., & Mamajek, E. E. 2013, ApJS, 208, 9
- Rodigas et al. (2012) Rodigas, T. J., et al. 2012, ApJ, 752, 57
- Schneider et al. (2009) Schneider, G., Weinberger, A. J., Becklin, E. E., Debes, J. H., & Smith, B. A. 2009, AJ, 137, 53
- Soummer et al. (2012) Soummer, R., Pueyo, L., & Larkin, J. 2012, ApJ, 755, L28
- Thalmann et al. (2013) Thalmann, C., et al. 2013, ApJ, 763, L29
- Thalmann et al. (2011) —. 2011, ApJ, 743, L6
- Torres et al. (2006) Torres, C. A. O., Quast, G. R., da Silva, L., de La Reza, R., Melo, C. H. F., & Sterzik, M. 2006, A&A, 460, 695
- van Leeuwen (2007) van Leeuwen, F., ed. 2007, Astrophysics and Space Science Library, Vol. 350, Hipparcos, the New Reduction of the Raw Data
- Wahhaj et al. (2013) Wahhaj, Z., et al. 2013, ApJ, 773, 179
- Wolf & Voshchinnikov (2004) Wolf, S., & Voshchinnikov, N. V. 2004, Computer Physics Communications, 162, 113
- Wyatt (2008) Wyatt, M. C. 2008, ARA&A, 46, 339