Type Ia Supernovae with Bi-Modal Explosions Are Common – Possible Smoking Gun for Direct Collisions of White Dwarfs
Abstract
We discover clear doubly-peaked line profiles in 3 out of type Ia supernovae (SNe Ia) with high-quality nebular-phase spectra. The profiles are consistently present in three well-separated Co/Fe emission features. The two peaks are respectively blue-shifted and red-shifted relative to the host galaxies and are separated by . The doubly-peaked profiles directly reflect a bi-modal velocity distribution of the radioactive 56Ni in the ejecta that powers the emission of these SNe. Due to their random orientations, only a fraction of SNe with intrinsically bi-modal velocity distributions will appear as doubly-peaked spectra. Therefore SNe with intrinsic bi-modality are likely common, especially among the SNe in the low-luminosity part on the Philips relation of all SNe Ia). Such bi-modality is naturally expected from direct collisions of white dwarfs (WDs) due to the detonation of both WDs and is demonstrated in a 3D - WD collision simulation. In the future, with a large sample of nebular spectra and a comprehensive set of numerical simulations, the collision model can be unambiguously tested as the primary channel for type Ia SNe, and the distribution of nebular line profiles will either be a smoking gun or rule it out.
keywords:
supernovae: general1 Introduction
Type Ia supernovae (SNe Ia) are well-known cosmological “standard candles” thanks to a tight empirical correlation (the Phillips relation established by Phillips 1993) between intrinsic peak luminosities and post-peak brightness decline-rates (). SNe Ia are powered by the decay of 56Ni produced from the explosion of Carbon-Oxygen White Dwarfs (WDs), but the explosion mechanism is unknown. The two popular scenarios, single-degenerate (WD accretion exceeding the Chandrasekhar limit) and double-degenerate mergers (merger of two close WDs that spiral in due to gravitational radiation), have many theoretical and observational challenges (Hillebrandt & Niemeyer, 2000; Maoz, Mannucci, & Nelemans, 2014). For both scenarios, a serious challenge is that a successful ignition of an explosive detonation has never been convincingly demonstrated.
Direct, head-on collisions of WDs would undoubtedly lead to successful explosions due to the strong shocks formed during the high-velocity impacts (Kushnir et al., 2013; Rosswog et al., 2009; Raskin et al., 2009, 2010; Hawley, Athanassiadou, & Timmes, 2012), but they had long been thought to only occur in dense stellar environments (globular clusters) and responsible for a negligible fraction of SNe Ia. It was recently shown by Katz & Dong (2012) that the rate of direct collisions in common field triple systems may be as high as the SNe Ia rate. Previously, Thompson (2011) argued that the secular Lidov-Kozai mechanism (Lidov, 1962; Kozai, 1962) in triples might play an important role in WD-WD mergers via gravitational radiation to produce SNe Ia and speculated that collisions may sometimes occur. The high collision probability due to the non-secular corrections to the Lidov-Kozai mechanism obtained by Katz & Dong (2012) raised the possibility that the majority of SNe Ia result from collisions. Supporting evidence was provided in Kushnir et al. (2013) in which high resolution numerical simulations of WD collisions reproduced several robust observational features of SNe Ia, especially establishing that the full range of 56Ni necessary for all SNe Ia across the Phillips relation, from the faint-end of SN 1991bg-like events to luminous 1991T-like events, can be produced by collisions of typical WDs.
Here we report that nebular spectra of some SNe Ia show double-peaked line profiles that suggest bimodal distributions of radioactive 56Ni in the ejecta. We find that 3 out of a sample of 20 SNe show this structure, implying a much larger fraction when viewing angle effects are taken into account. Using simulations we show that collision models of SNe Ia can produce structures similar to those observed due to the existence of two separate detonation seeds, providing new direct evidence for collisions as a significant SNe Ia channel. The bi-modal distributions can serve as a touchstone in testing SN Ia explosion scenarios in general.
2 Discovery of Double-Peak Nebular Emission Features
2.1 The Sample
Motivated by significantly non-spherical 56Ni distributions expected from WD collisions, we search for unusual nebular emission features in archival type Ia observations. In the nebular phase, the SN spectrum is emission-line dominated, and the line profiles directly probe the underlying velocity distribution of the emitting materials along the line of sight (LOS) due to the Doppler effect. By this time, 56Ni has completely decayed into 56Co and 56Fe, and the Co/Fe lines retain the velocity distribution of the original 56Ni.
We systematically collect spectra of SNe Ia from the archival data. The main sources are the Berkeley Supernova Ia Program (BSNIP) (Silverman, Ganeshalingam, & Filippenko, 2013), the Center for Astrophysics Supernova Program (Blondin et al., 2012), Carnegie Supernova Project (Folatelli et al., 2013) and the compilation from various sources by the Online Supernova Spectrum Database (SUSPECT). 111SUSPECT: http://www.nhn.ou.edu/suspect/; a public repository to download the spectra: WISeREP (Yaron & Gal-Yam, 2012). We have also included the spectra of SN 2011fe taken by Shappee et al. (2013). In the collection, there are 55 SNe with 155 spectra covering the wavelength range of interest (5000 - 7000 Å in the rest frame) and with phase greater than 170 days, which we define in this work as nebular phase. We focus on SNe with the highest Signal-to-Noise-Ratio (SNR) nebular spectra. Note that we exclude from the sample two SNe (SN 1986G and SN 2004bv) with a strong Na I D absorption feature at Å identified at earlier epochs since such a feature hinders clear identification of doubly-peak profile at Å. It is also important to be cautious about spectra with over-subtraction H- emission line at Å from the host-galaxy, which may confuse the analysis of the feature at Å.
2.2 SN 2007on: a SNe Ia with Double-Peak Nebular Emission Features
We identify three SNe with clear evidence of doubly-peaked velocity profiles. Figure 1 shows one example, SN 2007on, which exhibits clear doubly-peaked profiles for three well-spaced Fe and Co emission-line features.
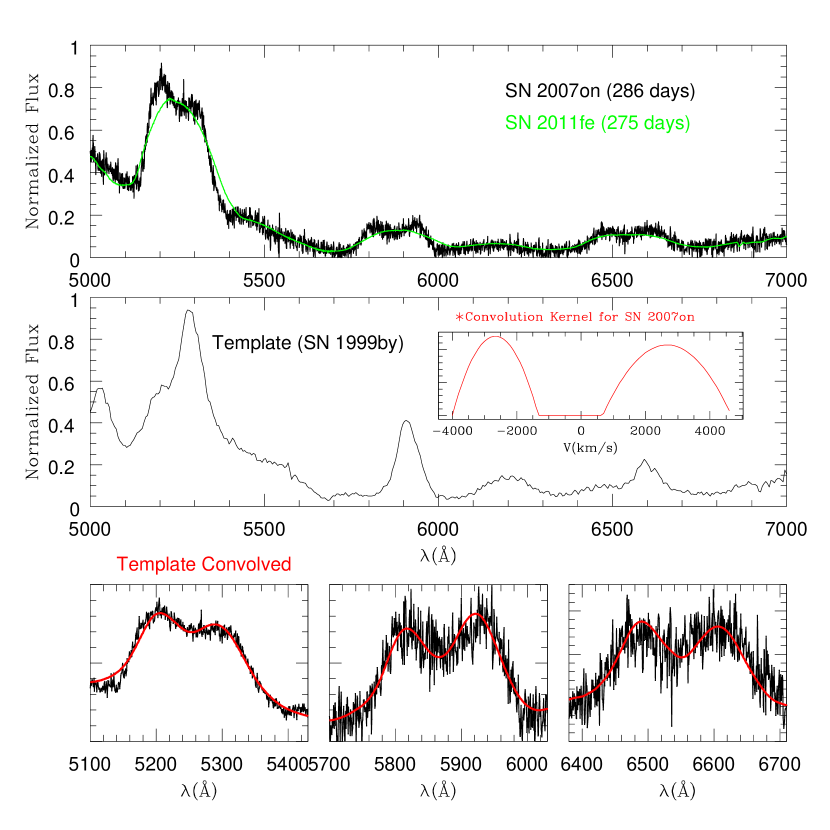
A general challenge in interpreting SNe line profiles is that many spectral features are due to blending from more than one line. A reasonable concern is that an observed doubly-peaked line profile could be due to two (or more) adjacent lines within an underlying single-peak velocity distribution. Several lines of evidence show that this is not the case for SN 2007on, so that the profile requires a bi-modal velocity distribution:
First, the doubly-peaked profiles occur for three widely-separated features emitted by two elements (Co and Fe) with the same peak-to-peak spacing . Furthermore, their shapes are all consistent with the same underlying velocity distribution. Figure 1 (bottom panel) shows that the spectra in three regions are well fitted by the convolution of a template spectrum with the same double-component velocity kernel (red line in the sub-panel of the middle panel). We choose the SN 1999by spectrum as the template (black line in the middle panel) due to its exceptionally narrow line width (similar to the famous SN 1991bg with SN 1999by having a higher SNR). A remarkable coincidence would be required in order that three additional lines conspire to produce such consistent profiles.
Next, other supernovae at a similar phase (thus a similar ratio between decaying Co and stable Fe) have similar line ratios among the three features but do not show the doubly-peaked profile. This is illustrated in the top panel of Figure 1 from comparison with SN 2011fe. While the line ratios of the two SNe are practically identical, the profiles of SN 2011fe are clearly single-peaked. The features from the same SN also show stable shapes in the nebular phase when multiple-epoch spectra have been taken.
Finally, the profile at Å is overwhelmingly dominated by one [CoIII] feature. The line profile is thus “clean” and reliably reflects the underlying velocity distribution without the need of modelling. This is supported by nebular spectrum modeling (Axelrod, 1980; Bowers et al., 1997) and re-affirmed by examining the spectra of SNe 1991bg and 1999by where the line widths are sufficiently narrow to allow for clear line identifications (Turatto et al., 1996). The Co origin of the line has been firmly established for several SNe by examining the multiple-epoch spectra taken in the intervals 170-400 days, during which the Co decays significantly, and the lines maintain the same shape while the relative strengths with respect to Fe lines weaken according to the Co nuclear decay rate (Kuchner et al., 1994). The other two features at Å and Å are less reliable due to possible contributions from nearby lines. The frequently studied Fe feature at Å shows significant blending from neighboring lines and is unsuitable (i.e., not clean enough) to be used for directly deriving the 56Ni velocity distribution from its profile. We examine the choice of templates and spectral features in Appendix B.
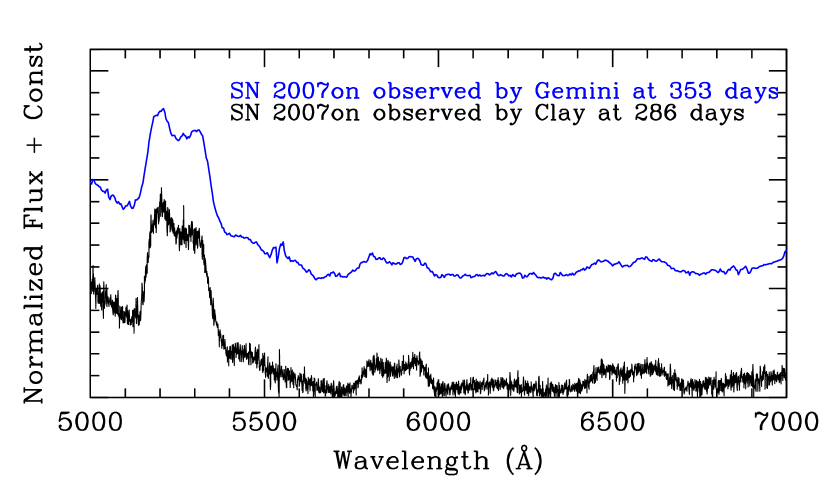
Maeda et al. (2010) reported another nebular-phase spectrum of SN 2007on taken at a different phase () and telescope (Gemini South) from that in our sample ( at Clay). We retrieved archival late-time spectra of SN 2007on from the Gemini Science Archive (program GS-2008B-Q-8). The spectra were obtained with Gemini South + GMOS on UT 2008-11-03 with the R150 grating and 1.0” longslit. We reduced the data using standard routines in the IRAF gemini.gmos package, including bias subtraction, flat-fielding, wavelength calibration using a CuAr lamp, 1D spectral extraction, and flux calibration. We combined sec exposures to obtain the final spectrum with wavelength coverage Å and FWHM resolution of 22 Å. The reduced spectrum is plotted in Figure 2. As can be seen, the double-peak features are clearly visible at this epoch, and they are consistent with those in the 286d spectrum.
2.3 Bi-modal Velocity Distributions Are Common, Especially Among Low-Luminosity SNe
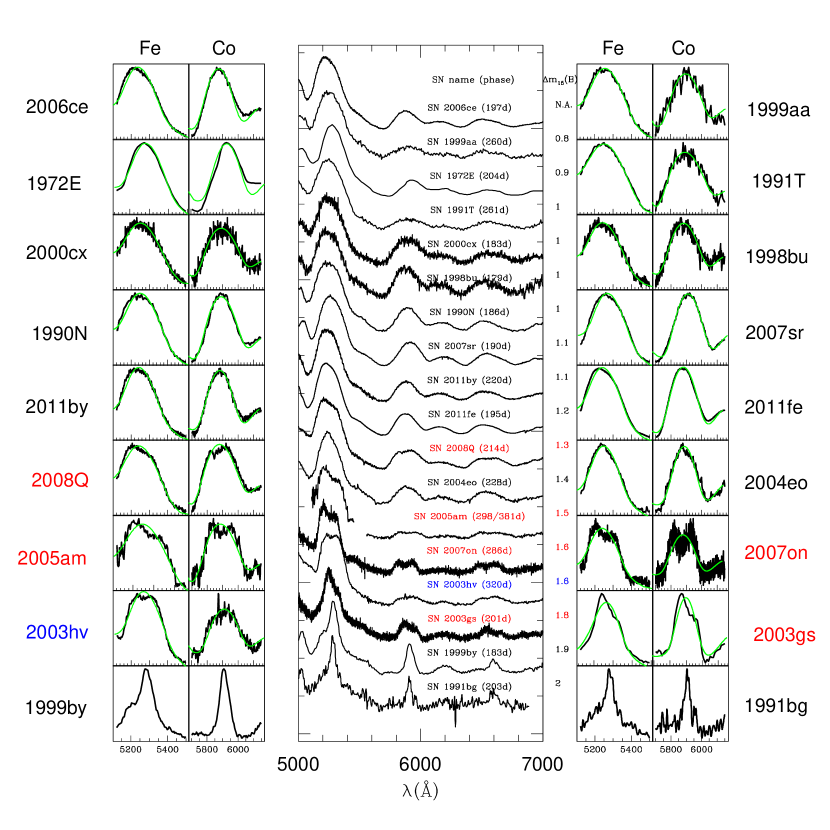
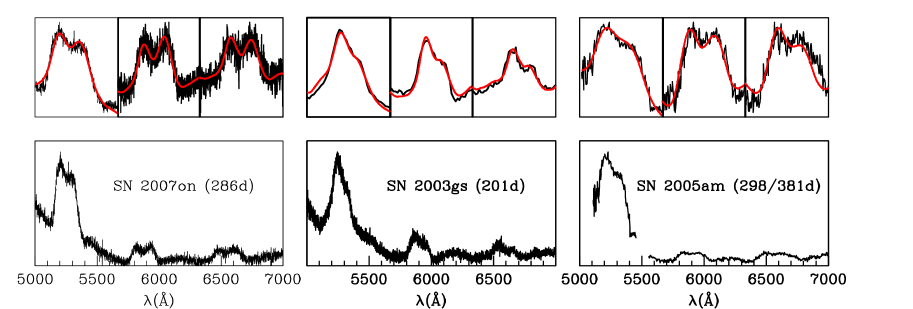
The sample of 20 SNe with high-SNR nebular spectra are shown in Figure 3 in ascending order of (if available). To identify doubly-peaked lines, we fit each spectrum using a simple, single-peak velocity convolution kernel with . The Fe and Co features of many SNe can be well fitted by single-peaks as shown in Figure 3. The use of SN 1999by(/1991bg) as template(s) is justified mainly on an empirical ground, and it could be problematic if they result in different explosion physics from other SNe Ia, as argued in some works (e.g., Mazzali & Hachinger 2012). Nevertheless, as discussed in Sec 2.2, we primarily use the clean [CoIII] 5900Å feature for double-peak identification, which does not depend on the convolution method. We identify 3 SNe, SN 2007on, SN 2005am and SN 2003gs, with clearly doubly-peaked spectra that consistently appear in the three features (marked in red). Figure 4 shows that all three spectra can be well fitted by convolving a two-component velocity profile with the template.
SN 2008Q shows a “flat-top” profile that appears in all three Fe/Co features (with low-level of NaI D absorption at ). SN 2003hv shows hints of a doubly-peaked or a flat-top profile, but the data do not allow unambiguous identification. A clear flat-top profile was reported for SN 2003hv for [Fe II] at 1.644 micron, and it was regarded as evidence for a “hole” in the 56Ni distribution (see, e.g., Motohara et al. 2006; Höflich et al. 2004). SN 2003hv was also reported to have nebular line blue-shifted by (Maeda et al., 2010). The flat-top profile and the line shift could be the result of an underlying bi-model velocity distribution, but unlike a double-peak profile, flat-top profile does not allow unambiguous identification of bi-modality.
Unquantified selection effects exist in this sample, so the numbers above are not suitable for statistics. Nevertheless, the SNe Ia with underlying bi-modal velocity distributions are definitely not rare. It is interesting to note that, all the SNe with evidences for bi-modal velocity distributions have relatively large : (SN 2003gs), (SN 2007on), (SN 2005am) and (SN 2008Q). The bi-modal velocity distribution must be quite common among these fast declining, low-luminosity SNe with , which comprise of all SNe Ia in a volume-limited sample (Li et al., 2011).
3 Theoretical Implications and Discussion
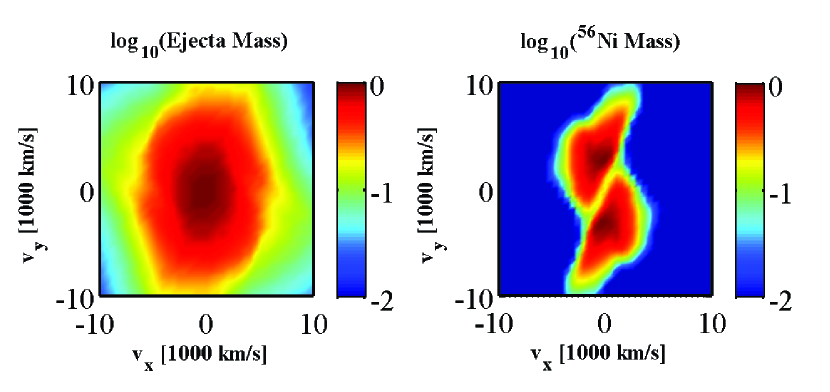
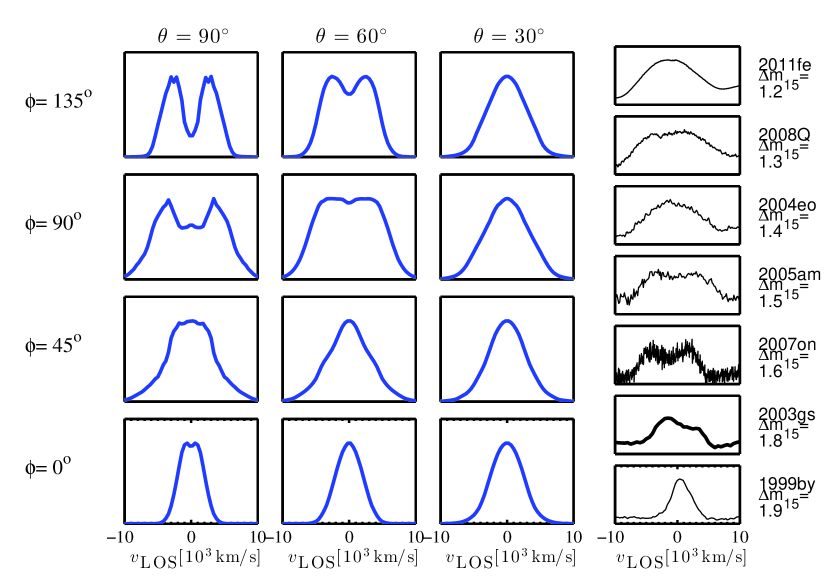
A bi-modal velocity distribution is naturally expected from direct WD-WD collisions due to the detonations of both WDs, which occur for all cases in the high-resolution 2D simulations for zero impact-parameter WD-WD collisions (Kushnir et al., 2013). However, bi-modal 56Ni velocity distributions are rare in these 2D simulations. Figure 5 shows the results of a 3D simulation of the collision of two WDs with a non-zero impact parameter of 0.2. The impact parameter is defined as the ratio between , the minimal separation between the WDs along their trajectory that would have been obtained if they were point masses, and the sum of the two WD radii. The simulation is performed using FLASH 4.0 (Dubey et al., 2009; Fryxell et al., 2000) with a 13 isotope alpha-chain reaction network (Timmes, 1999) and a resolution, comparable to the converged 2D resolutions in Kushnir et al. (2013). The upper panel of Figure 5 shows the projected velocity distribution of the total ejecta mass and the 56Ni mass in the WD-WD orbital plane. The 56Ni mass consists of two components separated by several thousand km/s. The bottom panel shows the LOS 56Ni distributions for numerous viewing angles. The chance of seeing doubly-peaked line profiles with similar velocity separations as the observed ones is significant. It is worth noting that a narrow velocity distribution similar to SN 1999by/1991bg is observed from directions perpendicular to the line connecting the centers of the two 56Ni components.
It is important to note that, even though the 56Ni bi-modality are commonly expected from WD-WD collision models, not all WD-WD collisions result in bi-modality. As suggested by the results of 2D simulations, collisions with zero impact-parameter rarely produce bi-modality. Besides the impact parameter, the masses of the WDs, and in particular their mass ratio, can conceivably play an important role in determining bi-modality. 3D simulations with the full range of impact parameters and WD masses are required to derive statistics of the expected velocity distributions (Kushnir et al., in prep).
Our results imply that any proposed scenario to explain the majority of SNe Ia must have a considerable fraction of the explosions producing bi-modal velocity distributions of 56Ni. Direct collisions of WDs is a promising channel to explain the bi-modality, and the 56Ni distribution can be definitively calculated with no free parameters from the collision model. High-quality nebular-phase spectra, emphasizing SNe with fast post-peak decline , are needed to quantify the occurrence rate of the doubly-peaked profiles. Bi-model velocity distributions can sometimes masquerade as single-peak line profiles, and for some of them, their bi-modal nature may be revealed by detecting the shifts of line peaks with respect to the rest frame. The continuum polarization measurements of SNe Ia at early epochs were found to be and the inferred maximum departure from spherical symmetry was suggested to be (see e.g., Wang & Wheeler 2008; Patat et al. 2012). Whether the bi-modality of 56Ni suggested in the nebular-phase spectra and expected from the collision models are consistent with the polarization measurements is an open issue, and resolving it will require radiation transfer calculations. By comparison of accurate computations and comprehensive observations in the near future, the collision models can be unambiguously tested as the primary channel for type Ia SNe. The rich and detailed structure of the nebular line profiles will either be a smoking gun of the collision model or rule it out.
Acknowledgements
We thank Avishay Gal-Yam, Andy Gould and the reviewer Mark Phillips for helpful comments. We are grateful to Ben Shappee for providing the spectral files for SN 2011fe and Jeffrey Silverman for help with BSNIP. We thank the Carnegie Supernova Project, Berkeley Supernova Ia Program, CfA Supernova Group for making their data public and the Online Supernova Spectrum Database (SUSPECT) for collecting a comprehensive set of archival SNe spectra – without these efforts, this work would have not been possible. S.D. is supported by “the Strategic Priority Research Program-The Emergence of Cosmological Structures” of the Chinese Academy of Sciences (Grant No. XDB09000000). D. K. gratefully acknowledges support from Martin A. and Helen Chooljian Founders’ Circle. Support for J.L.P. is in part provided by FONDECYT through the grant 1151445 and by the Ministry of Economy, Development, and Tourism’s Millennium Science Initiative through grant IC120009, awarded to The Millennium Institute of Astrophysics, MAS. FLASH was in part developed by the DOE NNSA-ASC OASCR Flash Center at the University of Chicago. Computations were partly performed at PICSciE and IAS clusters. This work used the Extreme Science and Engineering Discovery Environment (XSEDE), which is supported by NFS grant ACI-1053575.
References
- Axelrod (1980) Axelrod T. S., 1980, PhDT
- Blondin et al. (2012) Blondin S., et al., 2012, AJ, 143, 126
- Bowers et al. (1997) Bowers E. J. C., et al., 1997, MNRAS, 290, 663
- Dubey et al. (2009) Dubey A., et al., 2009, Parallel Comput., 35, 512
- Folatelli et al. (2013) Folatelli G., et al., 2013, ApJ, 773, 53
- Fryxell et al. (2000) Fryxell, B., et al. 2000, ApJS, 131, 273
- Hawley, Athanassiadou, & Timmes (2012) Hawley W. P., et al., 2012, ApJ, 759, 39
- Hillebrandt & Niemeyer (2000) Hillebrandt W., Niemeyer J. C., 2000, ARA&A, 38, 191
- Höflich et al. (2004) Höflich P., et al., 2004, ApJ, 617, 1258
- Katz & Dong (2012) Katz B., Dong S., 2012, arXiv, arXiv:1211.4584
- Kozai (1962) Kozai Y., 1962, AJ, 67, 591
- Kuchner et al. (1994) Kuchner M. J., et al., 1994, ApJ, 426, L89
- Kushnir et al. (2013) Kushnir D., Katz B., Dong S., et al., 2013, ApJ, 778, L37
- Li et al. (2011) Li W., et al., 2011, MNRAS, 412, 1441
- Lidov (1962) Lidov M. L., 1962, P&SS, 9, 719
- Maeda et al. (2010) Maeda K., et al., 2010, Natur, 466, 82
- Maoz, Mannucci, & Nelemans (2014) Maoz D., et al., 2014, ARA&A, 52, 107
- Mazzali & Hachinger (2012) Mazzali P. A., Hachinger S., 2012, MNRAS, 424, 2926
- Motohara et al. (2006) Motohara K., et al., 2006, ApJ, 652, L101
- Raskin et al. (2009) Raskin C., et al., 2009, MNRAS, 399, L156
- Raskin et al. (2010) Raskin C. et al., 2010, ApJ, 724, 111
- Rosswog et al. (2009) Rosswog S. et al., 2009, ApJ, 705, L128
- Patat et al. (2012) Patat F., et al., 2012, A&A, 545, A7
- Phillips (1993) Phillips M. M., 1993, ApJ, 413, L105
- Shappee et al. (2013) Shappee B. J. et al., 2013, ApJ, 762, L5
- Silverman, Ganeshalingam, & Filippenko (2013) Silverman J. M., et al., 2013, MNRAS, 430, 1030
- Thompson (2011) Thompson T. A., 2011, ApJ, 741, 82
- Timmes (1999) Timmes F. X., 1999, ApJS, 124, 241
- Turatto et al. (1996) Turatto M. et al., 1996, MNRAS, 283, 1
- Wang & Wheeler (2008) Wang L., Wheeler J. C., 2008, ARA&A, 46, 433
- Yaron & Gal-Yam (2012) Yaron O., Gal-Yam A., 2012, PASP, 124, 668
Appendix A The Convolution Kernel for the Bi-modal Velocity Distribution
In Figure 4, the velocity convolution kernel to fit doubly-peaked profiles is given by
| (1) |
There are 5 free parameters: two shifts , the two widths and the peak ratio of the components, . The shifts can be alternatively described as a velocity shift and velocity separation . The best-fit parameters are , and for SN 2007on, 2003gs and 2005am, respectively.
Appendix B On the choice of the template and spectral features for convolution
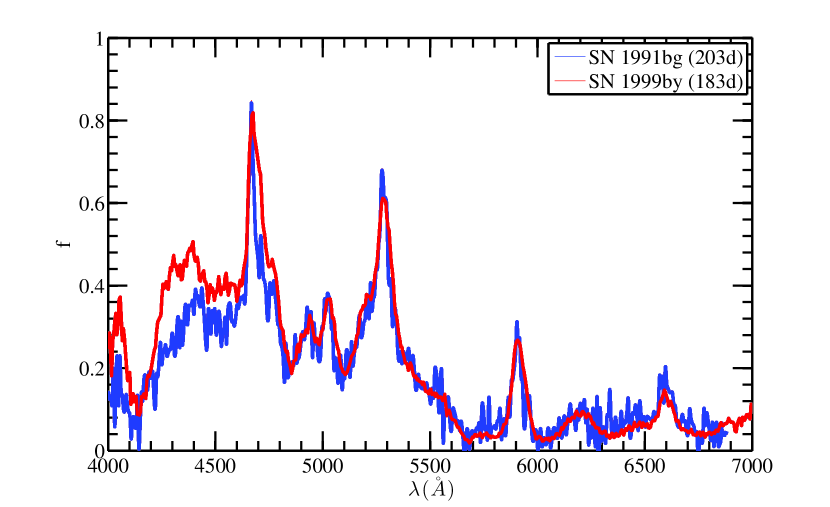
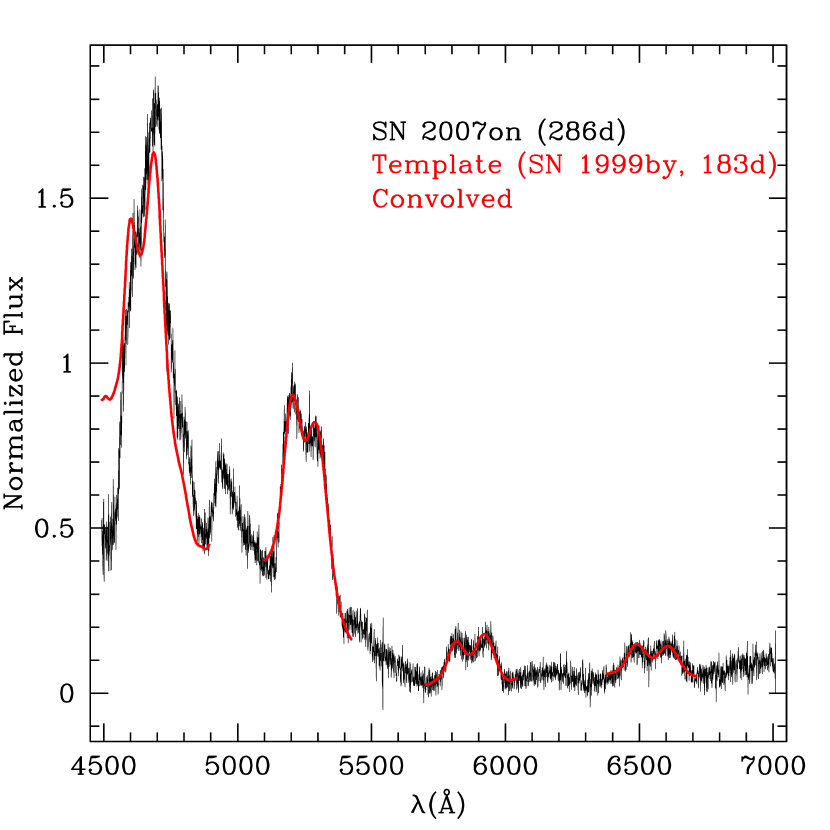
The direct convolution method applied in this work makes use of multiple nebular-phase Co and Fe spectral features to study the underlying velocity profile of 56Ni in the ejecta. Among all nebular-phase spectra in our collection, the spectra of SN 1999by and SN 1991bg have the narrowest line widths, which make them suitable as the templates for convolution. The spectra of SN 1999by (183 d) and SN 1991bg (203 d) are plotted in Fig. B1. For the work presented in the main text, we used the spectrum of SN 1999by as the template due to relatively high SNR compared to that of SN 1991bg.
The ideal nebular spectral features to use shall have little blending from nearby spectral lines and exhibit good consistency in line shapes for different SNe. The shapes of spectral features in the range of Å and Å are essentially identical between the two SNe. The [CoIII] feature at Å is especially clean with its wings falling close to zero at both blue and red ends. Moreover, theoretical study of nebular-phase spectrum by Axelrod (1980) shows that the Å [CoIII] feature is devoid of blending from any other lines. The Fe feature at Å (due to the blend of [FeIII] and [FeII]) and the [CoIII] feature at Å (blended with [FeII]) are less clean, and they are used in the study only to aid the line profile analysis mainly based on the Å feature.
In contrast, the spectra features in the range of Å show significant difference in shape between SN 1999by and SN 1991bg, in particular for the prominent Fe feature at Å which is frequently used in many studies of SNe Ia nebular spectra. The Å feature seems to be significantly affected by complicated blends of neighbouring lines. This makes this feature unsuitable for direct template convolution.
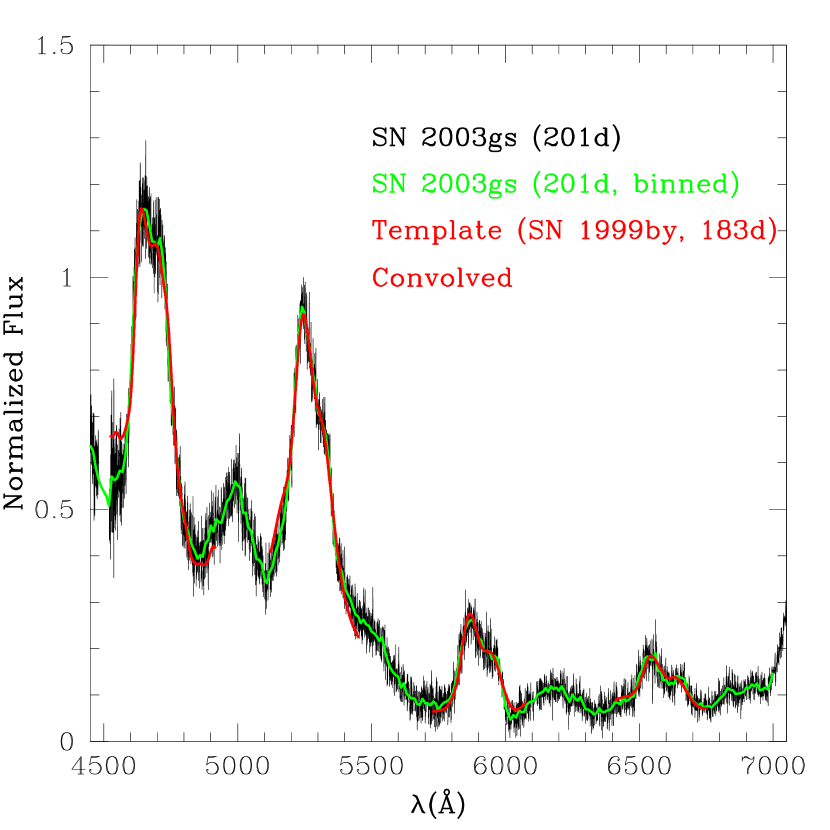
Nevertheless, it is instructive to examine the Å features for the supernovae with bi-model velocity distribution deduced from the Å features. In our sample, the nebular-phase spectra for SN 2005am do not possess the region near Å. The spectrum of SN 2003gs is the more promising case to be modelled by convolution as it is taken at 201 d, similar to the phase of the template SN 1999by spectrum (183 d). The upper panel of Fig. B2 shows the convolution of the SN 1999by template spectrum with the bi-modal velocity convolution kernel given in Appendix A (i.e., extending the convolutions shown in Figure. 4 in the main text to the Å feature). There is a remarkable agreement in the line shape at Å between the convolved spectra and that of SN 2003gs. The nebular-phase spectrum of SN 2007on is taken at 286 d, much later than the template spectrum at d. In the lower panel of Fig. B2, we compare the spectra between SN 2007on taken at 286 d and the convolved SN 1999by spectra (183 d), and in this case the agreement is not good for the Å feature. This is probably due to differences in the complex blend in this region between the two supernovae (SN 1999by and 2007on) and/or at the different phases.
Despite the complexity of the Å feature demonstrated above, the case of SN 2003gs suggests that there is some regularity within this spectral region that can be explored. For SN 2003gs, we also convolve the whole SN 1999by template spectrum with the bi-modal velocity kernel (rather than fitting individual spectral regions), and the convolved spectrum agrees remarkably well with that of SN 1999by across the entire spectrum. Observationally, a larger sample of high quality nebular spectra spanning a larger range of epochs beyond 200 d, in particular for the 1991bg-like events, would help greatly to elucidate the situation empirically. Further theoretical works would be needed explain the difference in line profiles for the Å feature between SNe (such as SN 1991bg and 1999by). The velocity profile deduced from the Å can be helpful in the modeling endeavours to interpret the more complex nebular lines such as the Å feature.