Habitable Zone Dependence on Stellar Parameter Uncertainties
Abstract
An important property of exoplanetary systems is the extent of the Habitable Zone (HZ), defined as that region where water can exist in a liquid state on the surface of a planet with sufficient atmospheric pressure. Both ground and space-based observations have revealed a plethora of confirmed exoplanets and exoplanetary candidates, most notably from the Kepler mission using the transit detection technique. Many of these detected planets lie within the predicted HZ of their host star. However, as is the case with the derived properties of the planets themselves, the HZ boundaries depend on how well we understand the host star. Here we quantify the uncertainties of HZ boundaries on the parameter uncertainties of the host star. We examine the distribution of stellar parameter uncertainties from confirmed exoplanet hosts and Kepler candidate hosts and translate these into HZ boundary uncertainties. We apply this to several known systems with a HZ planet to determine the uncertainty in their HZ status.
Subject headings:
astrobiology – planetary systems1. Introduction
The discovery of exoplanets has proceeded through a period of technique refinement over the past 20 years in order to improve sensitivity to planets of smaller size and larger semi-major axis. As such, the relevance of the Habitable Zone (HZ) boundaries for exoplanet host stars has moved from the realm of a theoretical exercise to one of enormous practical application. A rigorous calculation of the HZ boundaries for main sequence stars have previously been provided by Kasting et al. (1993). These calculations have since been generalized in terms of stellar luminosity () and effective temperature () by a variety of authors (Underwood et al., 2003; Selsis et al., 2007; Jones & Sleep, 2010). The relation of the HZ boundaries to fundamental stellar properties have been recently recalculated and extended to lower mass stars by Kopparapu et al. (2013).
The radial velocity (RV) technique has revealed several possible HZ terrestrial planets, such as those in the GJ 667 system (Anglada-Escudé et al., 2013; Feroz & Hobson, 2014). Most of the RV planets in their stars HZ are of Jovian mass however (Kane & Gelino, 2012), although this opens up the prospect of habitable moons in such cases (Hinkel & Kane, 2013). A significant source of planets which potentially orbit within the HZ of their host stars has been from the Kepler mission. A recent example of this includes the Kepler-62 system which contains two planets of Earth radii within the HZ (Borucki et al., 2013). A point of caution though lies within the uncertainty on the stellar parameters on which the HZ boundaries sensitively depend. In some cases, this can lead to a radical reevaluation of the HZ which can change the HZ status of planets within the system (Kaltenegger & Sasselov, 2011; Mann et al., 2013). Thus it is important to study in detail how the current HZ estimates are impacted by the uncertainty in the host star properties.
Here we describe the fundamental stellar properties which are used to determine the HZ boundaries and quantify the effect of stellar parameters uncertainties on HZ calculations. Section 2 includes a summary of the methodology used to determine the HZ boundaries throughout the rest of this work. In Section 3, we examine each of the primary contributing stellar parameters in detail with respect to how the uncertainties translate to our understanding the extent of the HZ. These results are applied to two populations of exoplanet host stars in Section 4, broadly defined as the “confirmed exoplanet host stars” and the “Kepler candidate host stars”. In Section 5, we examine several specific cases of claimed HZ exoplanets to determine the validity of those claims and provide concluding remarks in Section 6.
2. The Habitable Zone Boundaries
 |
 |
The HZ for a particular star is broadly defined as the region around the star where water can exist in the liquid state on the surface of a planet given adequate atmospheric pressure. These boundaries were calculated by Kasting et al. (1993) based upon one-dimensional, cloud-free climate models. The most recent revision of these calculations by Kopparapu et al. (2013) uses updated models for H2O and CO2 in the thermal-IR and expands the range of stellar effective temperatures for which the calculations are valid. A generalization of the incident stellar flux at the HZ boundaries is as follows:
| (1) |
where K and is the stellar effective temperature. Kopparapu et al. (2013) provide values for the coefficients , , , , and depending on assumptions on when water-loss may have occurred in the Venusian and Martian history. Here we will refer to “conservative” and “optimistic” models of the HZ, as used by Kane et al. (2013). The conservative model treats the “Runaway Greenhouse” and “Maximum Greenhouse” criteria as the inner and outer HZ boundaries respectively. The optimistic model adopts the “Recent Venus” and “Early Mars” criteria for these inner and outer boundaries, allowing for an expanded HZ under the assumption that Venus and Mars may have had a longer period of retaining surface water. These criteria are described in more detail by Kopparapu et al. (2013). The distance, , of the boundaries for a particular HZ model may be determined from the stellar flux in Equation 1 using the following relation:
| (2) |
where is the stellar luminosity and the distance is in units of AU.
The above calculations depend sensitively on and . The luminosity of the nearest stars may be determined through the use of stellar parallax and subsequent distance estimates. We discuss the uncertainties associated with such luminosity determinations in Section 3. Distance estimates of reasonable accuracy are in limited supply for many exoplanet host stars and the luminosity is often calculated based on assumptions regarding the stellar radius, , via the equation . The stellar radius is often calculated based on stellar models and the relatively accessible quantities of and surface gravity, , since these influence the stellar photosphere. The radius may also be estimated from the stellar mass, , and surface gravity. Below is an example relationship (Smalley, 2005) which allows the radius to be determined from other fundamental stellar properties:
| (3) |
where . The determination of the HZ boundaries can thus be fraught with uncertainty depending on how well the stellar properties are known.
3. Stellar Parameter Uncertainties
The two main quantities used to determine the various HZ boundaries are and . As seen in Equation 2, the boundaries have a power law dependence on . However, since is a calculated rather than measured quantity, it depends upon other variables (, , and ), each with their own uncertainties. Here we quantify the HZ boundary dependencies on these parameters.
The first parameter we consider is that of effective temperature. As seen in Equation 1, this parameter is fundamental to calculating the stellar flux received at the HZ boundaries. Fortunately, it is also usually one of the better known stellar parameters with direct measurements from stellar spectra. As such, it has little dependency upon the knowledge of other stellar parameters. The uncertainty in also filters through to the determination of luminosity since that is often calculated from and . Thus, the uncertainty plays a major role in determining the robustness of the HZ boundaries.
The left panel of Figure 1 shows the dependency of the “Runaway Greenhouse” boundary (inner conservative HZ boundary) on percentage uncertainties in . This shows that uncertainties in of % can result in % uncertainties in the location of the HZ boundary. There is a variation of this dependency on spectral type but the variation is relatively minor in nature.
The dependency of HZ boundary determinations on is independent of the stellar radius, which is usually a calculated rather than measured quantity. However, the uncertainty in contributes significantly to the HZ error budget and is often relatively large. There is a linear dependence of the HZ distances on since and (see Equation 2). Thus the uncertainty in the location of the HZ depends linearly on the uncertainties.
 |
 |
We also consider the contribution of the surface gravity () and stellar mass () uncertainties to the error budget since these can be used to determine . According to Equation 3, the dependency of on and are and respectively. Thus the HZ boundaries have the same dependencies: and . The right panel of Figure 1 plots the effect of varying on the HZ boundaries which shows the inverse dependence. Note that the dependencies may be more complicated than described since a change in mass for a main sequence star will result in a change in radius, thus an associated change in .
Finally, we consider luminosity determinations from stellar distances derived from their parallax measurements. The parallax measurements are typically those provided by the Hipparcos mission (Perryman et al., 1997) and the revised reduction of those data (van Leeuwen, 2007). This is a common method for luminosity determination for the confirmed exoplanets whose discovery resulted from the RV technique. In these cases the stars tend to be preferentially bright and thus close enough for reasonable parallax measurements. Figure 2 shows histograms of distance measurements and their associated uncertainties for the confirmed exoplanet host stars. These data were extracted from the Exoplanet Data Explorer (see Section 4). The vast majority of RV host stars are closer than 100 pcs where distances are determined to 1–10%. The luminosity is proportional to the square of the distance and also depends on the quality of the photometry and bolometric corrections. As such, luminosity determinations using this technique also have the potential for relatively large uncertainties for all but the closest stars. This situation will undoubtedly be greatly improved by new astrometric measurements provided by the GAIA mission111http://sci.esa.int/gaia/. In the following sections, we restrict ourselves to using the stellar parameters noted above in order to provide a direct comparison between different types of exoplanet host stars. The caveat to note is that some of the confirmed exoplanet host stars may have overestimated HZ boundary uncertainties where their distances are suffiently well known.
4. Application to Known Exoplanet Host Stars
 |
 |
 |
 |
 |
 |


Here we apply the above described stellar parameter uncertainty effects to the HZ calculations for the known exoplanet host stars. We divide these into two broad groups: the host stars of confirmed exoplanets and the host stars of Kepler candidates. We extracted the stellar parameters stored in the Exoplanet Data Explorer222http://exoplanets.org/ (Wright et al., 2011). The data are current as of 26th November 2013. The data are also available from the NASA Exoplanet Database333http://exoplanetarchive.ipac.caltech.edu/ (Akeson et al., 2013). The data utilized here includes all of the host stars with the necessary stellar parameter information to perform this analysis. This main criteria are that the host stars have available values for the effective temperatures, radii, and surface gravities.
An inherent assumption in the following analysis is that the uncertainties associated with stellar parameters are gaussian in nature and can mapped to 1 uncertainties in HZ boundary locations. There are numerous individual cases where this will not be true due to non-gaussian posteriors and correlated errors which are inherent in the analysis of spectra (for example). This does not have a significant effect on the result since we draw upon a large distribution to show the impact of these stellar uncertainties.
4.1. Confirmed Exoplanet Host Stars
The number of host stars in the confirmed exoplanets group of host stars which meet the criteria of available stellar parameters is 507. This group includes host stars for which their planets have been detected by either the RV or transit techniques. Many of the stellar properties have been compiled by such sources as Butler et al. (2006) and Takeda et al. (2007). Figure 3 summarizes the stellar properties of , , and . The histograms show the distribution of the parameters and their associated uncertainties. Each of the histograms are divided into 30 bins and have the same y-axis scale for ease of comparison.
The distribution of lies mostly between 4000–6500 K; a reflection of the F–G–K target selection which dominates RV exoplanet host stars. The distribution of the uncertainties peaks at K which is % of the typical value.
As described in Section 3, the stellar radius plays a key role in determining the uncertainty in the HZ boundaries. The stellar radii histogram shows that dwarf stars dominate as hosts of the confirmed exoplanets with a distribution peaking at . The uncertainty distribution peaks at and thus the typical radius uncertainty for this group of host stars is %.
The distribution of values shown in Figure 3 is also indicative of the dominance of dwarf host stars in the sample since it peaks between 4–5. The uncertainty in peaks at . The range of uncertainty values is sufficient to determine a luminosity class, but can result in substantial ambiguity in derived stellar radius when Equation 3 is employed.
From the values of and described above, we calculated the HZ boundaries for the conservative model (see Section 2). The width of the conservative HZ was then determined for each of the stars. The distribution of the HZ widths is represented by the histogram shown in the top panel of Figure 4. This distribution appears to be symmetric but is shown on a logarithmic scale and peaks at a width of AU. To examine the effects of the stellar parameter uncertainties, we calculated the HZ boundaries of the conservative HZ model (see Equations 1 and 2) by subtracting and adding the 1 parameter uncertainties for the inner and outer boundaries respectively. This results in an uncertainty region which is larger than the calculated width of the HZ. The distribution of this HZ uncertainty region is shown in the bottom panel of Figure 4 as a percentage of the HZ width. Thus, an uncertainty region close to 100% means that the stellar parameter uncertainties are relatively small and the location of the HZ is well constrained. An uncertainty region of 200% means that any planet in the HZ of such a system may not be in the HZ at the level. The distribution shown in Figure 4 shows that typical HZ uncertainty regions are only 20% larger than the calculated HZ width for the confirmed exoplanet group.
4.2. Kepler Candidate Host Stars
There have been several releases of Kepler candidates which is an ever-growing list of likely transiting exoplanets detected by the Kepler mission (Borucki et al., 2011a, b; Batalha et al., 2013). With the number of Kepler candidate host stars numbering in their thousands, determining accurate stellar parameters is a daunting task. Stellar parameters for these stars have been measured and estimated using a combination of photometric calibration, spectroscopy, and astroseismology (Brown et al., 2011; Silva Aguirre et al., 2012; Everett et al., 2013; Huber et al., 2013). There are numerous difficulties in determining these stellar properties which can result in systematic offsets in parameters such as temperature, matallicity, radius, etc. These are described in detail by Huber et al. (2014) and references therein. This highlights the need for accurate stellar parameters in order to decrease the HZ boundary uncertainties discussed here.
 |
 |
 |
 |
 |
 |


The number of Kepler candidate host stars which meet our criteria of available stellar parameters is 1852. The distributions of the , , and and their associated uncertainties are shown in the histograms of Figure 5. As with the confirmed exoplanets group (see Figure 3) each of the histograms are divided into 30 bins. However, the y-axes of the surface gravities have a different scale to the other histograms due to their substantially different distributions. A general difference that can be seen between the confirmed exoplanet and Kepler candidate host stars is that the uncertainty distributions for the Kepler candidate host stars are skewed towards higher uncertainties. This is not unexpected since the Kepler stars are systematically fainter than those monitored by most ground-based RV and transit programs. This does however have a significant effect on HZ calculations as we will soon show.
The distribution of for the Kepler candidate host stars is similar to that for the confirmed exoplanet host stars but with a strong emphasis on solar (G-type) stars. The uncertainty distribution peaks at K, almost twice that of the confirmed exoplanet host stars.
The stellar radii distribution shown in Figure 5 is likewise similar to that shown in Figure 3 with relatively few giant stars in the sample. However, the uncertainty distribution is significantly worse with a major peak in the bimodal distribution of , an order of magnitude higher than that of the confirmed exoplanet host stars. As stated earlier, large efforts have been made to better characterize the Kepler stars, particularly the exoplanet candidate host stars, resulting in a minor distribution with radius uncertainties less than .
Determining values for the relatively faint Kepler stars is a difficult task, and several efforts have been made to do so from photometric calibrations (Claret & Bloemen, 2011; Creevey et al., 2013). The histogram of values shown in Figure 5 is consistent with most of the Kepler candidate host stars being selected because of their dwarf classification and thus consistent with the and distributions. The uncertainties for are particularly unreliable with most having been assigned a default value of 0.3 dex (Brown et al., 2011). This does not affect the HZ calculations presented here since we use the values and uncertainties due to their availability.
The widths of the conservative HZ for all of the Kepler candidate host stars are shown in the top panel of Figure 6. These were calculated in the same way as for the confirmed exoplanet host stars. An important difference between the two is that the distribution of HZ widths for the Kepler candidate host stars peaks at AU, compared with AU for the confirmed exoplanet host stars. This indicates that the HZ boundaries are also closer to the Kepler host stars than for the confirmed exoplanet host stars. The distribution is similar between the two groups so it is the slightly smaller radii distribution of the Kepler candidate host stars that results in the overall reduction in HZ widths. The main difference between the two groups can be seen in the bottom panel of Figure 6. The slight bimodal distribution in the stellar radii results in a similar bimodal distribution in the width of the HZ uncertainty region. However, the majority of the Kepler stars have a HZ uncertainty region which is between 200–400% larger than the width of the HZ; significantly worse than for the confirmed exoplanet host stars. The repercussion of this is that Kepler candidate exoplanets whose orbits are supposed to lie within the HZ of their host star are unlikely to fall within the HZ at all. Thus statistics of Kepler HZ candidates must be individually examined to determine if they reasonably qualify to retain their HZ status.
5. Specific Habitable Zone Systems
Here we consider some specific systems to study the extent of the HZ both with and without stellar parameter uncertainties accounted for.
The GJ 581 system has been of particular interest with regards to the HZ boundaries as there have been claims that planets within the system have HZ status (Vogt et al., 2010). The host star is especially well characterized due in no small part to the long-baseline interferometric observations carried out by von Braun et al. (2011). These measurements resulted in determining the fundamental stellar parameters of K and .
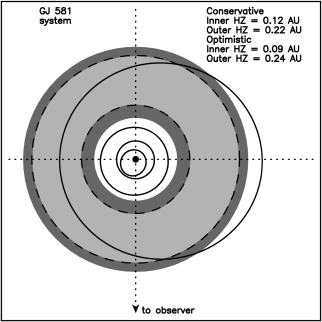
Figure 7 shows a top-down view of the GJ 581 system with the calculated HZ regions. The light gray represents the conservative HZ model and the dark gray regions represent the extensions to the HZ from the optimistic model. The orbits of the GJ 581 planets are overlaid on the plot (solid lines) where we have adopted the four-planet model described by Forveille et al. (2011). The dashed lines indicate the 1 extensions of the conservative model boundaries due to the stellar parameter uncertainties. In this case, these 1 uncertainties are almost negligible in size and the HZ uncertainty region (see Figures 4 and 6) is 102% of the HZ width of 0.104 AU. Thus, the location of the HZ is well-defined for this system.
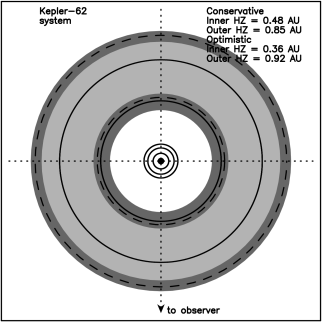
A prominent confirmed multi-planet system detected by the Kepler mission is that of Kepler-62 Borucki et al. (2013). This five-planet system includes two which early estimates showed are in the HZ of the host star. The published stellar parameters are K and . The HZ conservative and optimistic regions are shown in Figure 8. As noted by Borucki et al. (2013), the Kepler-62 system is unstable with the Keplerian orbital parameters presented in their paper due to overlapping orbits. We therefore adopt circular orbits for the planets which are overlaid on the plot. The width of the conservative HZ region is 0.37 AU. The dashed lines for the 1 uncertainty boundaries show that the HZ location is less well-known in this case than it is for GJ 581. The HZ uncertainty region for Kepler-62 is 120% of the HZ width. Even so, the uncertainties are small enough such that the e and f planets are likely to be in the optimistic and conservative HZ regions as shown. To quantify this, we assume a normal distribution of the HZ boundary uncertainties. The e planet is 1.92 away from the conservative HZ boundary and thus 94.5% likely to be outside of this region. The f planet is 2.77 away from the conservative HZ boundary and thus 99.4% likely to be inside of the conservative HZ region.
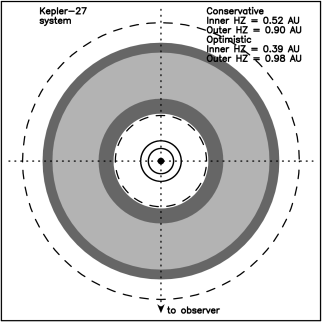
The two planets of the Kepler-27 system were confirmed using the Transit Timing Variation (TTV) technique by Steffen et al. (2012). Although neither of these planets are purported to lie within the HZ, this is an interesting system to study as an example of one with relatively large stellar parameter uncertainties. For Kepler-27, these are K and . The HZ and planets for this system are shown in Figure 9. The width of the conservative HZ is 0.38 AU and the HZ uncertainty region is 201% of this width. As described in Section 4, an uncertainty region of this size results in considerable doubt as to the HZ status of any planet described to be in HZ in such cases. We have shown that the vast majority of the Kepler exoplanet candidate fall into this category with the currently known stellar parameters.
6. Conclusions
The HZ is an increasingly important property of exoplanet host stars with the ever-increasing sensitivity to exoplanets of smaller size/mass and at longer orbital periods. The greatest hindrance to understanding the properties of exoplanets is the difficulty in fully characterizing the host star properties. This also results in limitations in defining the extent of the HZ in exoplanetary systems.
Here we have shown these limitations as imposed by the specific stellar properties of , , and . The importance of is in deriving the stellar luminosity and the value of is utilized only when the radius is not determined through other means. The stellar parameters for the confirmed exoplanet host stars are sufficiently well determined such that the size of the HZ uncertainty region lies below 150% for most of the stars. However, the HZ uncertainty region distribution for the Kepler candidate host stars is dominated by those in the 200-400% range where the HZ status of exoplanets is highly dubious. Analysis of the stellar properties between the two groups shows that the uncertainty in stellar radius is the primary cause of this HZ uncertainty difference.
With the continuous rate of new discoveries from both ground and space-based surveys, the search for terrestrial-size planets in the HZ of their host stars is a difficult but achievable goal. When such discoveries are made, it will always be critical to quantify the extent to which we can correctly classify these discoveries as HZ planets. Without such analysis, the understanding of the frequency of Earth-size planets in the HZ (sometimes referred to as ) will be less secure than we suppose.
Acknowledgements
The author would like to thank Daniel Huber for suggesting this investigation and providing feedback on the manuscript. The author would also like to thank Ravi Kopparapu and the anonymous referee for productive feedback. This research has made use of the following archives: the Exoplanet Orbit Database and the Exoplanet Data Explorer at exoplanets.org, the Habitable Zone Gallery at hzgallery.org, and the NASA Exoplanet Archive, which is operated by the California Institute of Technology, under contract with the National Aeronautics and Space Administration under the Exoplanet Exploration Program.
References
- Akeson et al. (2013) Akeson, R.A., et al. 2013, PASP, 125, 989
- Anglada-Escudé et al. (2013) Anglada-Escudé, G., et al. 2013, A&A, 556, 126
- Batalha et al. (2013) Batalha, N.M., et al., 2013, ApJS, 204, 24
- Borucki et al. (2011a) Borucki, W.J., et al., 2011a, ApJ, 728, 117
- Borucki et al. (2011b) Borucki, W.J., et al., 2011b, ApJ, 736, 19
- Borucki et al. (2013) Borucki, W.J., et al., 2013, Science, 340, 587
- Brown et al. (2011) Brown, T.M., Latham, D.W., Everett, M.E., Esquerdo, G.A. 2011, AJ, 142, 112
- Butler et al. (2006) Bulter, R.P., et al. 2006, ApJ, 646, 505
- Claret & Bloemen (2011) Claret, A., Bloemen, S. 2011, A&A, 529, 75
- Creevey et al. (2013) Creevey, O.L., et al. 2013, MNRAS, 431, 2419
- Everett et al. (2013) Everett, M.E., Howell, S.B., Silva, D.R., Szkody, P. 2013, ApJ, 771, 107
- Feroz & Hobson (2014) Feroz, F., Hobson, M.P. 2014, MNRAS, 437, 3540
- Forveille et al. (2011) Forveille, T., et al. 2013, A&A, submitted (arXiv:1109.2505)
- Hinkel & Kane (2013) Hinkel, N.R., Kane, S.R. 2013, ApJ, 774, 27
- Huber et al. (2013) Huber, D., et al. 2013, ApJ, 767, 127
- Huber et al. (2014) Huber, D., et al. 2014, ApJS, submitted (arXiv:1312.0662)
- Jones & Sleep (2010) Jones, B.W., Sleep, P.N., 2010, MNRAS, 407, 1259
- Kaltenegger & Sasselov (2011) Kaltenegger, L., Sasselov, D. 2011, ApJ, 736, L25
- Kane & Gelino (2012) Kane, S.R., Gelino, D.M. 2012, PASP, 124, 323
- Kane et al. (2013) Kane, S.R., Barclay, T., Gelino, D.M. 2013, ApJ, 770, L20
- Kasting et al. (1993) Kasting, J.F., Whitmire, D.P., Reynolds, R.T. 1993, Icarus, 101, 108
- Kopparapu et al. (2013) Kopparapu, R.K., et al. 2013, ApJ, 765, 131
- Mann et al. (2013) Mann, A.W., Gaidos, E., Ansdell, M. 2013, ApJ, submitted (arXiv:1311.0003)
- Perryman et al. (1997) Perryman, M.A.C., et al. 1997, A&A, 323, L49
- Selsis et al. (2007) Selsis, F., Kasting, J.F., Levrard, B., Paillet, J., Ribas, I., Delfosse, X., 2007, A&A, 476, 1373
- Silva Aguirre et al. (2012) Silva Aguirre, V., et al. 2012, ApJ, 757, 99
- Smalley (2005) Smalley, B., 2005, Mem. Soc. Astron. Ital. Suppl., 8, 130
- Steffen et al. (2012) Steffen, J.H., et al. 2012, MNRAS, 421, 2342
- Takeda et al. (2007) Takeda, G., Ford, E.B., Sills, A., Rasio, F.A., Fischer, D.A., Valenti, J.A. 2007, ApJS, 168, 297
- Underwood et al. (2003) Underwood, D.R., Jones, B.W., Sleep, P.N., 2003, Int. J. Astrobiology, 2, 289
- van Leeuwen (2007) van Leeuwen, F. 2007, A&A, 474, 653
- Vogt et al. (2010) Vogt, S.S., Butler, R.P., Rivera, E.J., Haghighipour, N., Henry, G.W., Williamson, M.H. 2010, ApJ, 723, 954
- von Braun et al. (2011) von Braun, K., et al. 2011, ApJ, 729, L26
- Wright et al. (2011) Wright, J.T., et al. 2011, PASP, 123, 412