Far-field super-resolution imaging with a planar hyperbolic metamaterial lens beyond the Fabry-Perot resonance condition
Abstract
We demonstrate achieving the far-field super-resolution imaging can be realized by using a planar hyperbolic metamaterial lens (PHML), beyond the Fabry-Perot resonance condition. Although the thickness of the PHML is much larger than wavelength, the PHML not only can transmit radiative waves and evanescent waves with high transmission, but also can collect all the waves in the image region with the amplitudes of them being the same order of magnitude. We present a design for a PHML to realize the far-field super-resolution imaging, with the distance between the sources and the images 10 times larger than wavelength. We show the superresolution of our PHML is robust against losses, and the PHML can be fabricated by periodic stacking of metal and dielectric layers.
I Introduction
Remarkable progress has been made over the past decade in achieving optical super-resolution imaging2012NatMaterials that breaks the traditional resolution limit, offering substantial advances for the imaging and lithography systems that are the corner stones of modern biology and electronics. Metamaterial-based superlenses have shown the super-resolution imaging in the near field2000PRL85Pendry ; 2005Science308NicholasFang , but magnification of subwavelength features into the far field has not been possible. Recently, super-oscillatory lenses2009NANOLETTERS9Nikolay and hyperlenses2007Science315ZhaoweiLiu ; 2007Science315Smolyaninov have demonstrated to the far-field super-resolution imaging. However, both the super-oscillatory lenses and hyperlenses suffer from some limitations: that super-oscillatory lenses come at a price of losing most of the optical energy into diffuse sidebands; and hyperlenses need complex co-centrically curved-layer structures, which not only bring more challenges in fabrication, but also fundamentally lack the Fourier transform function due to their inability to focus plane waves2012NatureCommunications3DylanLu . To avoid these limitations, planar hyperbolic metamaterial lenses (PHMLs) were reported2006PRB73PavelABelov ; 2008OE16ChangtaoWang and have demonstrated capable of providing not only Fourier transform function by introducing a phase compensation mechanism2012NatureCommunications3DylanLu , but also advantages of super-resolving capabilities. However, so far most of the studies for the super-resolution imaging of PHMLs are done in the near field 2006PRB73PavelABelov ; 2008OE16ChangtaoWang (with the distances between source and image are much smaller than unit wavelength). Recently, P. Belov and co-authors proposed an alternative regime based on the Fabry-Perot resonance effect, and thus it is capable of transmitting images to far-field 2008PRB77BelovParini . Nevertheless, the regime itself assumes that the thickness of the PHML should be equal to an integer number of half-wavelengths 2008PRB77BelovParini . In this paper, we demonstrate that the far-field super-resolution imaging also arises in well-designed PHMLs when the Fabry-Perot resonance condition does not hold.
Generally, achieving the far-field super-resolution imaging through a planar lens is very challenging. For the subwavelength imaging, both evanescent waves and radiative waves are required, and their amplitudes should be comparable with each other in the image. If the amplitude of radiative waves is much larger than that of evanescent waves, the subwavelength information taken by evanescent waves would be concealed by radiative waves, as thus the imaging system loses the super-resolution capabilityInContrast . Therefore, the amplitude of radiative waves and evanescent waves should be the same order of magnitude in the image region for superresolution. But satisfying this condition is generally very difficult for the far-field imaging, because of the inherent nature of evanescent waves with amplitudes exponential decaying in the air1986Electromagneticwavetheory ; 2011APL100WeiLi . One of the most striking properties of hyperbolic metamaterials is their strong ability to carry evanescent waves to far field 2007Science315ZhaoweiLiu , which enables PHMLs to be good candidates for far-field super-resolution imaging. To realize the far-field superresolution, however, a PHML should overcome at least four difficulties: First, beyond the Fabry-Perot condition, the PHML should be able to transmit radiative waves and evanescent waves from a source with high transmission and low loss. Second, it should be able to collect the radiative waves and evanescent waves in the image, with the amplitudes of them being the same order of magnitude. Third, the distance between the source and image should be much larger than unit wavelength. Fourth, the resolution of the PHML must be robust against losses to a certain degree, including radiative losses and material losses.
In this work, we present our design for a PHML that can be used to realize the far-field super-resolution imaging beyond the Fabry-Perot condition, with the resolution less than wavelength and simultaneously the distance between the image and the source as far as 10 wavelength or even farther. We show our PHML can be made from subwavelength layered structure, which is robust against losses. For simplicity, we constrain ourselves to only study the PHML’s far-field resolution properties in this paper.
II Model
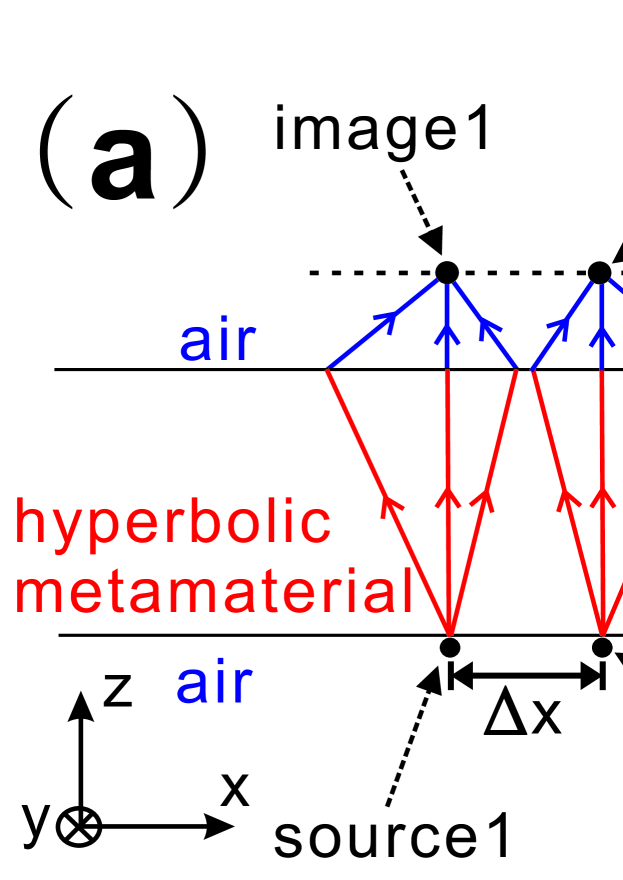
Our model is shown in Fig.1(a), in which a slab-like planar hyperbolic metamaterial with thickness ( is much larger than the wavelength, but doesn’t hold the Fabry-Perot condition) is positioned at for imaging, two monochromatic line sources with infinity length along direction are set very close to the lower interface and their images are formed above the upper interface at a distance of . The distance between the two sources is . The hyperbolic metamaterial has a matrix form permittivity with , and , and so its dispersion relation is hyperbolic 2008OE16ChangtaoWang ; 2012APL100WeiLi , where is the wavevector, with the wavelength in air. The equi-frequency contours (EFCs) of hyperbolic metamaterials are hyperbolic. In the case of and , two typical examples are shown in Fig.1(b). In this work, only the transverse electric (TE) mode (i.e., ) is considered.
III Choice of hyperbolic metamaterials
For a PHML, there are many choices of the transverse axis’ direction of the hyperbolic EFC. In this work we choose the one that is parallel to the axis (corresponding to and as shown in Fig.1(b)), we find it is much suitable for the far-field imaging. If the transverse axis is perpendicular to the axis (in this case we have and ), the radiative waves in air with wavevector would exponentially decay in the lens, so this case is unsuitable for far-field imaging. If the transverse axis is tilted of an angle with axis2012PRB86GiuseppeCastaldi , this kind of PHML can be directly used as a Fourier transform lens, but it’s also unsuitable for far-field superresolution because of its large lateral deviation of the image through a long distance.
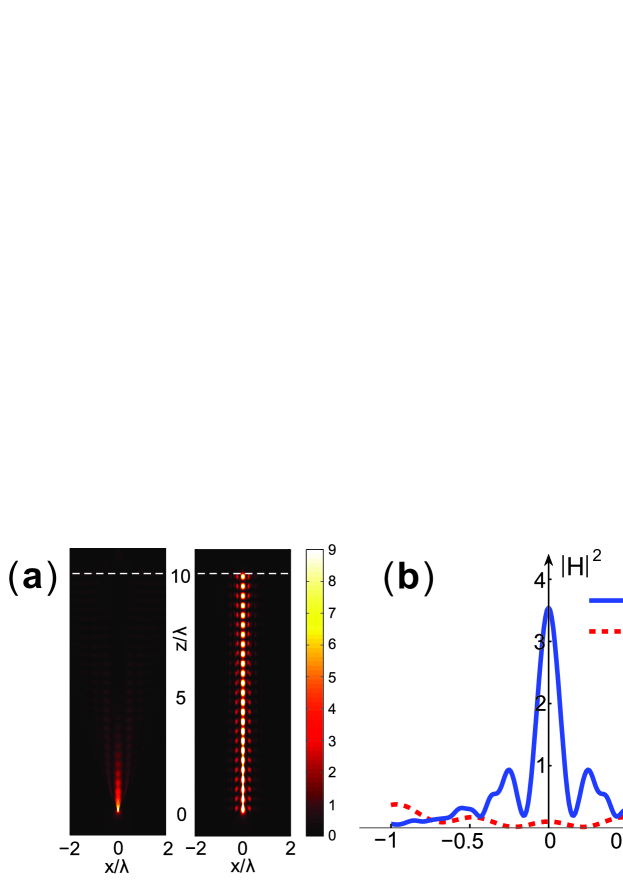
After fixing the transverse axis, i.e., and , the value determining the eccentricity of the hyperbola is the core parameter of our system. We choose large for our PHML. There are two reasons for our choice. First, if is not large enough, the image will be formed at a long distance from the interface of the lens2009PRB79AFang . In this case the evanescent waves would be too small to carry subwavelength information for the long-distance imaging. Second, for a PHML, larger corresponds to better self-collimation of light, which is very significant for the super-resolution imaging. Hyperbolic metamaterials with larger have flatter EFCs, and so the light diffraction can be lower when lights propagate in the hyperbolic metamaterials with larger . To show this, we present two typical examples, i.e., one case is (with ), and another case is (with ), whose EFCs are shown in Fig.1(b). From this figure, we can see the latter one has much flatter EFC than that of the former one. As a comparison, the two hyperbolic metamaterials are used for imaging, according to the model shown in Fig.1(a), with , . Their magnetic field intensity distributions calculated by Green’s function method1986Electromagneticwavetheory ; 2012JKPS60WLi ; 2013PRA87ZLiu are shown in Fig.2, in which Fig.2(a) shows the distributions in the - plane, and Fig.2(b) shows the distributions in an imaging region along the upper interface of the hyperbolic metamaterials. Comparing the left panel with the right panel in Fig.2(a), we can see the right one (corresponding to the latter one with ) has much better capable of self-collimation. Also, from Fig.2(b), we can see the intensity of the latter one’s image is more than 35 times larger than that of the former one, which indicates the latter one can focus more waves in the image. Therefore, hyperbolic metamaterials with larger are more suitable for super-resolution imaging.
IV Far-field superresolution
In Fig.2(b), the full width half maximum (FWHM) of the intensity distribution for the case of (blue solid line) is about that is much smaller than half of wavelength. In addition, the distance between the source and the image are that is much larger than unit wavelength, suggesting our system has the ability for the far-field subwavelength imaging.
To show it more clearly, we use such a PHML for imaging. As shown in Fig.1(a), the two sources are spaced at a distance of , the thickness of the PHML is . For the hyperbolic metamaterial, the real part of the relative permittivity is and (i.e., ), and the imaginary part is much smaller than the real part, which is phenomenologically introduced by
| (1) |
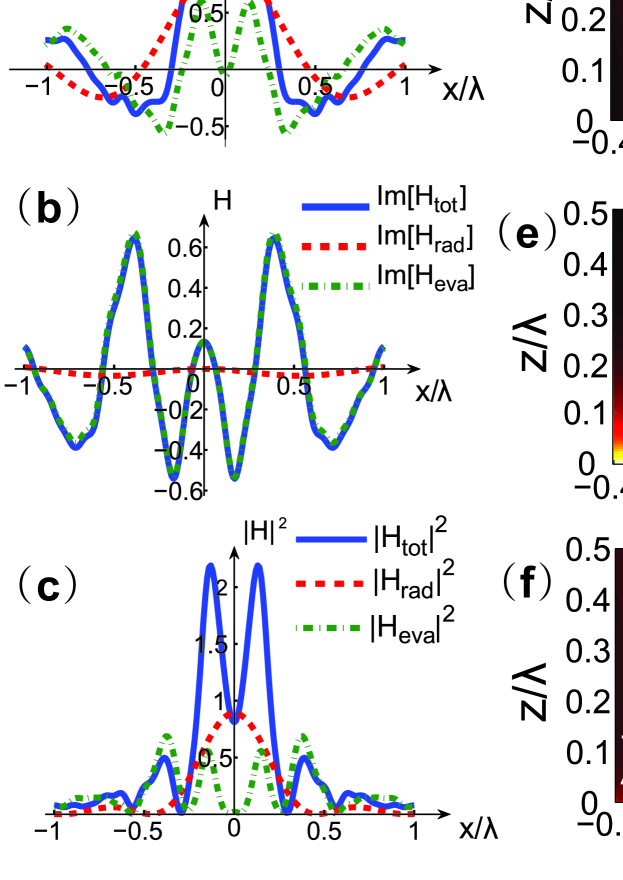
where is the loss coefficient. Based on the Green’s function method, we calculated the field (, and ) distributions and the intensity distributions in the image region, as shown in Fig.3(a)-(e). Here , and represent the radiative waves, the evanescent waves, and the total field, respectively. Note that , and are all complex. Figure 3(c) shows our PHML’s ability for the far-field super-resolution imaging. In this figure, we show the intensity distributions of , , and in the image region that is very close to the upper interface of the PHML (). In Fig.3(c), for the intensity distribution of the total field (corresponding to the blue solid line), it’s very clear to see that the two images (corresponding to the two main peaks) can be well resolved, although their distance is smaller than . Furthermore, we stress that the distance between the sources and the images is , which is much larger than . So our PHML does have the ability for the far-field super-resolution imaging.
Physically, the reason that our PHML exhibits the far-field super-resolution capability can be explained as follows. First, as shown in Fig.3(a) and Fig.3(b), both radiative waves and evanescent waves from sources can be transmitted through our PHML with high transmission (although the thickness of the PHML is very large), and they can be collected at the image region. Second, also from Fig.3(a)-(c), we can see the amplitudes of the radiative waves and the evanescent waves are comparable with each other, and they are constructive at the image peaks but simultaneously destructive at the side peaks.
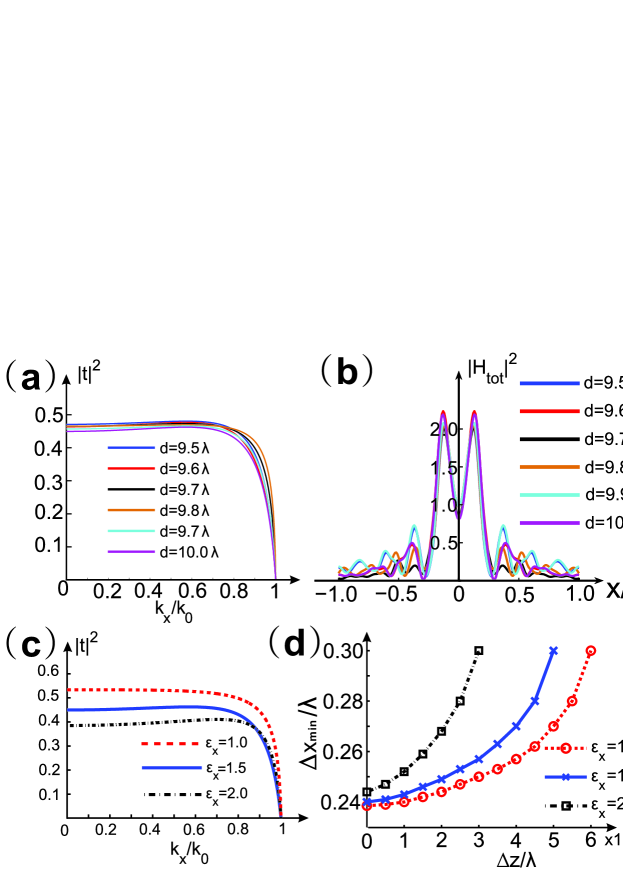
Evanescent waves play a very important role on the super-resolution. Without evanescent waves, our PHML would lose its super-resolution capability. In Fig.3(c), the images formed only by the radiative waves become a large spot without any subwavelength information that totally cannot be resolved. This fact can also be found in Fig.3(d)-(f). In Fig.3(d), the images formed only by the radiative waves cannot be resolved at all in the image region; while in Fig.3(f), the two images can be resolved well in the image region within a certain range of with the help of the evanescent waves. As increasing, the amplitudes of evanescent waves would exponentially decay that lessens the resolution of the PHML. As shown in Fig.3(f), when , the two images cannot be resolved at all. To show the increase of can impair the resolution of the PHML (i.e., the minimal distinguishable distance would become larger as increases), versus are plotted in Fig.4(d) (blue line). When , our PHML can achieve its highest resolution, with the minimal distinguishable distance . In Fig.4(d), whether the images can be resolved or not is following the Rayleigh criterion1964PrinciplesofOptics . In this work, we choose the criterion of distinguishable two images should be smaller than the critical contrast , where and represent the saddle point intensity and maximum intensity, respectively. Our criterion is a little bit stricter than that used in ref2009NANOLETTERS9Nikolay .
V Far-field superresolution beyond the Fabry-Perot resonance condition
Our PHML can be capable of far-field superresolution beyond the Fabry-Perot resonance condition. To see it, here we would like to show the far-field superresolution ability of several our PHMLs with different thicknesses (i.e., , , , ) as shown in Fig.4, in which the Fabry-Perot resonance condition is satisfied only when , while other thickness values correspond to the nonresonant case. From Fig.4(b), by comparing with the distributions in the resonant case and those in the nonresonant case, we can see their distributions are very similar and all the PHMLs are able to superresolution. Also, from Fig.4(a), we can see that the transmissions (here we only plot the radiative waves) of the PHMLs with different thicknesses are similar, too. These similarities of superresolution and transmission between the PHMLs with different thicknesses indicate that the far-field super-resolution ability of our PHMLs is not linked to the Fabry-Perot resonance effect, but related to the nonresonant impedance matching.
We find in our case, better (nonresonant) impedance matching corresponds to better superresolution, as shown in Fig.4(c) and (d). For the PHMLs in Fig.4(c) and (d), the eccentricity is fixed, but the values of are different, i.e., with , , and , respectively. Other parameters are the same as Fig.3. Clearly, when becomes closer to unit, the nonresonant impedance matching will become better. From Fig.4(d) we can find when the impedance is matching better, the minimal distinguishable distance becomes smaller, and the largest becomes larger, which corresponds to better superresolution. In the following, we will show that to realize a PHML with quasi-perfect nonresonant impedance matching is not very difficult.
VI Robust against losses
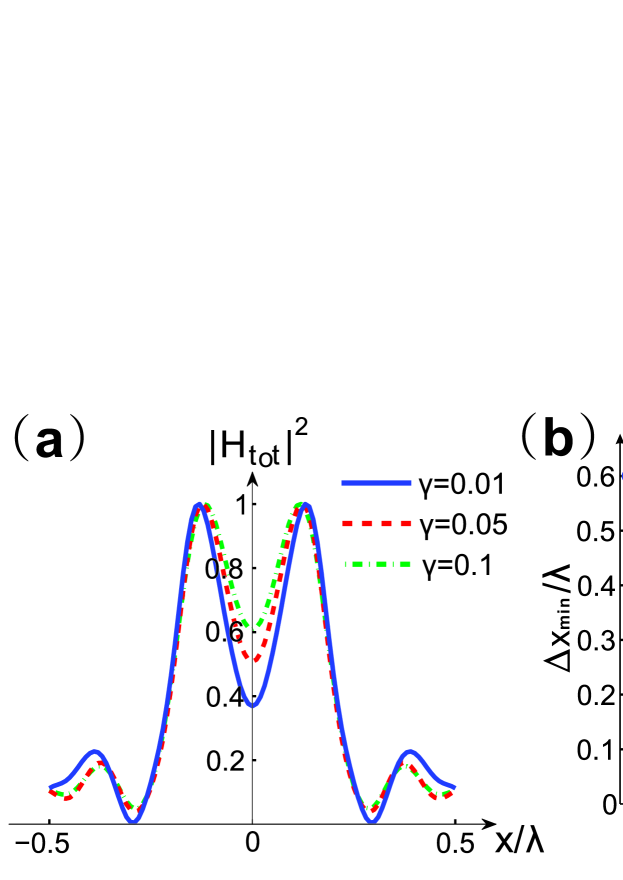
The superresolution of our PHML has robustness against losses, which is also important for imaging system. To see it, three PHMLs with three different losses are respectively used for imaging. The losses are phenomenologically introduced by Eq.(1), with the loss coefficient , and , respectively. The intensity distributions of the three PHMLs’ image region at are shown in Fig.5(a). In Fig.5(a), the parameters are the same as Fig.3, except the loss coefficient . In this figure, the maximum intensity value of each intensity distribution has been normalized to unit. From Fig.5(a), we can see even for a big loss (), our PHML also has the far-field super-resolution capability. For our PHMLs with different , the robustness against losses are also valid, as shown in Fig.5(b). From Fig.5(b), we can also see that the larger , the higher resolution of our PHML, which agrees with our previous discussion.
The fact that the superresolution ability of the PHML is robust against losses doesn’t mean the losses has nothing to do with the transmitted light waves. Actually, the losses play a very important role in the amplitude of the transmitted light waves. For such a thick PHML (e.g. ), the intensities of the transmitted light waves with different losses can differ by orders of magnitude. For instance, in Fig.5(a), the light’s intensity magnitude in the case with can be times larger than that with . Here we would like to emphasize that, although the losses can lead to large attenuation of signal strength, the losses don’t impair the superresolution. This result is meaningful. According to it, when using some techniques such as loss-compensation to overcome the losses, we can predict that the PHML will retain its superresolution ability.
VII Anisotropic layered structure for PHMLs
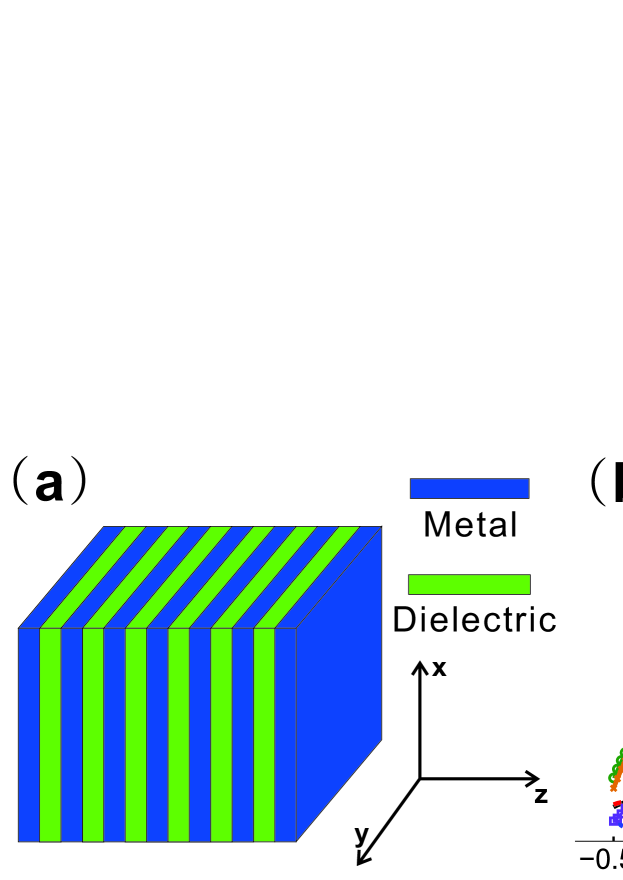
Our PHMLs can be realized by anisotropic structure comprising alternately layered metal and dielectric films, as shows in Fig.6(a). The thickness of the cell (a cell means a combination of one metal layer and one dielectric layer) is much smaller than the wavelength. Using the transfer-matrix method and imposing the Bloch theorem2012APL100WeiLi , the effective permittivity of such a layered structure can be obtained as2006PRB73PavelABelov and . Here and are the permittivities of the metal and dielectric, respectively. and are the filling factors for metal and dielectric layer, respectively. In realization, the number of cells of the layered structure is finite. For a practical PHML, the number of cells has much influence on the super-resolution imaging. To see it, here we present a comparison of the distributions at the upper interface of an ideal PHML with , and the practical PHMLs with different cell number in Fig.6(b). All the PHMLs in Fig.6(b) have a fixed thicknesses . For the practical PHMLs with different cell number , the thicknesses of each cell are different, but in each cell the filling factors , and the permittivities , are fixed. In order to show the resolution ability of each PHML, the maximum intensity value of each intensity distribution in Fig.6(b) is also normalized to unit. From Fig.6(b), we can see that the superresolution can be reached with the cell number , and when N increases, the distribution of of the layered structure becomes more similar to that of the ideal one, which is expected.
Next, we will discuss the feasibility of the practical PHML achieves higher resolution. According to Fig.5(b), we can see that the resolution can be or even smaller when . This can be realized by choosing the suitable parameters () for the multilayered structure as shown in Fig.6(a). For example, for the 1000-cell multilayered structure shown in Fig.6(b), with the parameters remaining unchanged except the filling factors, i.e., they become and , then the effective permittivities and of the 1000-cell multilayered structure become about 0.037 and -60.31, respectively, and the eccentricity is about 1638. Using such 1000-cell multilayered structure as the PHML, we find the resolution is about .
VIII Conclusion
In conclusion, we present an approach to achieve superresolution at a long-distance () through a PHML beyond the Fabry-Perot resonance condition, which can distinguish two sources with distance . The resolution of our imaging system is robust against losses. The PHMLs can be structured by periodic stacking of metal and dielectric layers.
Acknowledgments This work was supported by the National Natural Science Foundation of China (Grant Nos. 11204340, 61131006, 61021064, and 11174309), and the Shanghai Municipal Commission of Science and Technology (Project Nos. 11ZR1443800, and 10JC1417000).
References
- (1) E. Rogers, J. Lindberg, T. Roy, S. Savo, J. Chad, M. Dennis, and N. Zheludev, “A super-oscillatory lens optical microscope for subwavelength imaging,” Nat. Mater. 11, 432 (2012).
- (2) J. Pendry, “Negative refraction makes a perfect lens,” Phys. Rev. Lett. 85, 3966 (2000).
- (3) N. Fang, H. Lee, C. Sun, and X. Zhang, “Sub-Diffraction-Limited Optical Imaging with a Silver Superlens,” Science 308, 534 (2005).
- (4) F. Huang, and N. Zheludev, “Super-Resolution without Evanescent Waves,” Nano Lett. 9, 1249 (2009).
- (5) Z. Liu, H. Lee, Y. Xiong, C. Sun, and X. Zhang, “Far-Field Optical Hyperlens Magnifying Sub-Diffraction-Limited Objects,” Science 315, 1686 (2007).
- (6) I. Smolyaninov, Y. Hung, and C. Davis, “Magnifying Superlens in the Visible Frequency Range,” Science 315, 1699 (2007).
- (7) D. Lu, and Z. Liu, “Hyperlenses and metalenses for far-field super-resolution imaging,” Nat. Commun. 3, 1205 (2012).
- (8) P. Belov, and Y. Hao, “Subwavelength imaging at optical frequencies using a transmission device formed by a periodic layered metal-dielectric structure operating in the canalization regime,” Phys. Rev. B 73, 113110 (2006).
- (9) C. Wang, Y. Zhao, D. Gan, C. Du, and X. Luo, “Subwavelength imaging with anisotropic structure comprising alternately layered metal and dielectric films,” Opt. Express 16, 4217 (2008).
- (10) P. Belov, Y. Zhao, S. Tse, et al.,“Transmission of images with subwavelength resolution to distances of several wavelengths in the microwave range,” Phys. Rev. B 77, 193108 (2008).
- (11) In contrast, if the amplitude of evanescent waves is much larger than that of radiative waves, due to the large evanescent waves, the image region can have obvious subwavelength feature, but simultaneously the corresponding intensity distribution have many side peaks in the image region, whose amplitudes are as large as the main peak, severely impairing the imaging.
- (12) J. Kong, Electromagnetic wave theory, Wiley-Interscience (1986).
- (13) W. Li, J. Chen, G. Nouet, L. Chen, and X. Jiang, “The methods to detect vacuum polarization by evanescent modes,” Appl. Phys. Lett. 99, 051112 (2011).
- (14) W. Li, Z. Liu, X. Zhang, and X. Jiang, “Switchable hyperbolic metamaterials with magnetic control,” Appl. Phys. Lett. 100, 161108 (2012).
- (15) G. Castaldi, S. Savoia, V. Galdi, A. Alu, and N. Engheta, “Analytical study of subwavelength imaging by uniaxial epsilon-near-zero metamaterial slabs,” Phys. Rev. B 86, 115123 (2012).
- (16) W. Li, X. Jiang, “Green’s Function for a Metamaterial Superlens: Evanescent Wave in the Image,” J. Korean Phys. Soc. 60, 1282 (2012).
- (17) Z. Liu, W. Li, X. Jiang, and J. Cao, “Spontaneous emission from a medium with elliptic and hyperbolic dispersion,” Phys. Rev. A 87, 053836 (2013).
- (18) M. Born, and E. Wolf, Principles of Optics, 2nd ed, Cambridge University Press (1964).
- (19) A. Fang, T. Koschny, and C. Soukoulis, “Optical anisotropic metamaterials: Negative refraction and focusing,” Phys. Rev. B 79, 245127 (2009).