Phase-resolved X-ray spectra of magnetars
and the coronal outflow model
Abstract
We test a model recently proposed for the persistent hard X-ray emission from magnetars. In the model, hard X-rays are produced by a decelerating electron-positron flow in the closed magnetosphere. The flow decelerates as it radiates its energy away via resonant scattering of soft X-rays, then it reaches the top of the magnetic loop and annihilates there. We test the model against observations of three magnetars: 4U 0142+61, 1RXS J1708–4009, and 1E 1841–045. We find that the model successfully fits the observed phase-resolved spectra. We derive constraints on the angle between the rotational and magnetic axes of the neutron star, the object inclination to the line of sight, and the size of the active twisted region filled with the plasma flow. Using the fit of the hard X-ray component of the magnetar spectrum, we revisit the remaining soft X-ray component. We find that it can be explained by a modified two-temperature blackbody model. The hotter blackbody is consistent with a hot spot covering 1-10% of the neutron star surface. Such a hot spot is expected at the base of the magnetospheric outflow, as some particles created in the discharge flow back and bombard the stellar surface.
1 Introduction
Magnetars are isolated neutron stars whose emission is thought to be powered by the decay of intense magnetic fields (Duncan & Thompson 1992; Thompson & Duncan 1996). Their persistent X-ray spectrum shows two peaks, near 1 keV and above 100 keV (e.g. Kuiper et al. 2006; Enoto et al. 2010). The soft X-ray component likely comes from the neutron star surface. Its spectrum is modified from a simple Planck shape by the radiative transfer in the atmosphere and magnetosphere of the star, and it has a soft tail extending to keV where the hard component takes over. The hard X-rays must be produced in the magnetosphere of the neutron star.
For a few magnetars, phase-resolved spectra were measured in the hard X-ray band (den Hartog et al. 2008a,b). They showed bizarre variations with rotational phase. Recently, Beloborodov (2013b) proposed a model of decelerating outflow that makes specific predictions for the hard X-ray spectrum and its variation with rotational phase. In the present paper, we test the model against observations of three magnetars, 1E 1841–045, 4U 0142+61 and 1RXS J1708–4009 (all discovered as anomalous X-ray pulsars). The model is briefly described in Section 2, and the results of data analysis are presented in Section 3. We find that the model successfully fits the data and discuss implications of our results in Section 4.
2 Coronal outflow model
In the model, the hard X-ray emission is powered by the discharge near the star. The discharge voltage exceeds V and the initial Lorentz factor of created exceeds (Beloborodov & Thompson 2007). As the pairs flow out along the magnetic field lines and fill the extended magnetic loop, they decelerate via resonant scattering of thermal X-rays. Beloborodov (2013b) showed that the outflow has two zones, adiabatic and radiative. The adiabatic zone is near the star where magnetic field G; in this zone the resonantly scattered photons quickly convert to pairs, increasing the multiplicity of the flow to . The radiative zone is at higher altitudes where G; here the resonantly scattered photons escape and the outflow enters the radiative regime, losing its kinetic energy.
The interaction of radiation and outflow was studied in detail in Beloborodov (2013a). It was shown that the outflow Lorentz factor decreases proportionally to the local magnetic field,
| (1) |
The average energy of resonantly scattered photons is given by
| (2) |
Equations (1) and (2) imply that the spectrum of escaping hard X-rays has an average photon index and its luminosity peaks at the high-energy end (Beloborodov 2013b). The spectrum cuts off in the MeV band, because the multi-MeV photons are emitted in the adiabatic zone and cannot escape. The predicted spectral shape, however, strongly depends on the viewing angle, and may significantly differ from the average spectrum.
For a given position of the observer and location of the active magnetic loop the model predicts a well-defined phase-dependent radiation spectrum that can be quantitatively compared with observations. The spectrum can be calculated using the Monte-Carlo technique as described in (Beloborodov 2013b). We have developed a different, independent code that performs a similar calculation using direct integration of the angle-dependent emissivity over the j-bundle. This method does not include photon splitting, which is important at high energies. We have tested the code against the Monte-Carlo results presented in Beloborodov (2013b) and found excellent agreement at photon energies below 400 keV.
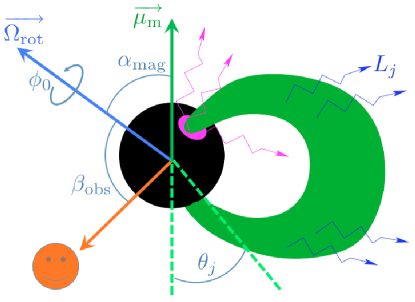
In this paper, we assume that the magnetosphere is axisymmetric and close to the dipole configuration in the region of interest (where G). The dipole moment of the neutron star is provided by measurements of its spindown rate; it is taken from Dib et al. (2007) for 4U 0142+61, and from Dib et al. (2008) for 1RXS J1708–4009 and 1E 1841–045. We also assume that the active, current-carrying region of the magnetosphere (“j-bundle”), which is filled with the flow, is axisymmetric. Then the model is completely defined by four remaining parameters:
-
•
, the half opening angle (from the magnetic axis) of the j-bundle footprint on the star.
-
•
, the bolometric luminosity radiated by the j-bundle.
-
•
, the angle between the rotation axis and magnetic axis of the neutron star.
-
•
, the angle between the rotation axis and the observer line of sight.
In addition, the point of zero rotational phase must be kept as a free parameter to fit phase-resolved data. The parameter is related to two theoretical quantities — the discharge voltage and the twist angle of the magnetic field lines (Beloborodov 2009),
| (3) |
where is the radius of the neutron star, which we fix at 10 km. A twist angle is expected for a strongly twisted magnetosphere; measured values of and can provide an order-of-magnitude for the discharge voltage .
 |
The j-bundle footprint can form a hot spot on the neutron star, as some of the relativistic particles created in the discharge flow back to the stellar surface and bombard it. This motivates us to consider a two-temperature model for the soft X-ray emission from the stellar surface, with the hotter blackbody associated with the j-bundle footprint. The expected area of the hot spot is related to by
| (4) |
where is the surface area of the neutron star. The model is illustrated in 1.
3 Spectral fits
For 4U 0142+61 and 1RXS J1708–4009, we used the multi-year data collected by INTEGRAL-ISGRI ( keV), INTEGRAL-SPI ( keV), XMM-Newton ( keV), ASCA-GIS ( keV, only for 4U 0142+61), RXTE-PCA ( keV) and CGRO-Comptel (upper-limits in the range MeV, see Kuiper et al. 2006, den Hartog et al. 2006). The data set for the two magnetars is the same as in den Hartog et al. (2008b, a); it is described in detail there. The data and fit by the outflow model for 1E 1841–045 are presented in An et al. (2013); below we show the results of An et al. (2013) for comparison with 4U 0142+61 and 1RXS J1708–4009.
3.1 Hard component
We first focus on the data above 10 keV, where the relativistic outflow dominates the observed emission. In this energy range, we search for a combined fit of the phase-averaged spectrum of the total (pulsed + unpulsed) emission and three phase-resolved spectra of the pulsed emission. The three phase bins are the same as in den Hartog et al. (2008b, a).
The entire parameter space of the model (Section 2) was discretized on a grid, and we calculated and the corresponding -value for the model at each grid point. The obtained map of provided a reliable way to find the best fit, avoiding the risk of converging to a local minimum with an optimization algorithm. We found that is a rather complex function of the model parameters and standard optimization software such as XSPEC would fail to identify the best fit. Remarkably, we found that has a sharp minimum in a well localized region of the parameter space. The best fit parameters for each magnetar are summarized in Table 1.
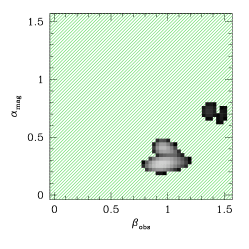
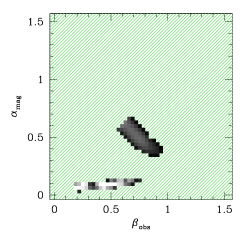
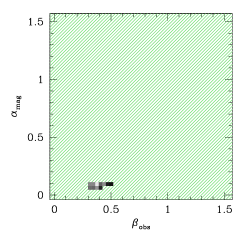
2 shows the -value maps on the plane of after maximizing the -value (minimizing ) over the parameters and for each . One can see that the model completely fails () almost everywhere; this reflects the fact the model is quite “rigid,” lacking flexibility in adjusting to a desired value. Nevertheless, a good fit with is obtained in a small region of the parameter space. We conclude that the model (a) successfully fits the data and (b) the fit imposes strong constraints on the parameters.
We note, however, that there is one significant source of degeneracy in the axisymmetric model. One can show that interchanging the values of and does not change the predicted spectrum. Thus, Figure 2 must be complemented with a similar map obtained by mirror reflection about the line of . The fact that one of the two angles is found to be small for 4U 0142+61 and 1RXS J1708–4009 may help to break this degeneracy. Since the line of sight is random, there is no reason for to be small. It is more likely that it is that is small, as this may be a result of the magnetic field evolution in the neutron star at its birth or later times.
| -value scale | 1E 1841–045 | 4U 0142+61 | 1RXS J1708–4009 |
|---|---|---|---|
 |
 |
 |
| aafootnotemark: bbfootnotemark: | ccfootnotemark: | /dof | ||||
|---|---|---|---|---|---|---|
| (rad) | (rad) | (rad) | ||||
| 4U 0142+61 | 0.5(3) | 3.9(24) @ 3.6 | 1.3 | 46/41 | ||
| 1RXS J1708–4009 | 0.4(2) | 3.5(18) @ 3.8 | 4.6 | 49/37 | ||
| 1E 1841–045 – sol. 1 | 0.3(2) | 0.9(2) | 48(16) @ 8.5 | 6.9 | 302/267 | |
| 1E 1841–045 – sol. 2 | 0.7(2) | 1.4(1) | 48(16) @ 8.5 | 6.9 | 326/267 |
Note.
Uncertainties are given at the 3 level.
There are two solutions within 3 for 1E 1841–045.
aIn units of .
bDistance to the object (in kpc) estimated from reddening and X-ray extinction
along the line of sight
(for 4U 0142+61 and 1RXS J1708–4009, Durant & van Kerkwijk 2006) or from the Galactic rotation of the associated supernova remnant (for 1E 1841–045, Tian & Leahy 2008).
cMagnetic dipole moment of the neutron star inferred from its spindown rate (see Dib et al. 2007 for 4U 0142+61, Dib et al. 2008 for 1RXS J1708–4009 and 1E 1841–045).
We also explored the model with unfrozen parameter and investigated if fitting by this more flexible model allows one to obtain constraints on , which would be independent from the spindown measurements. We found that such constraints are weak — only a lower limit on the magnetic moment can be derived this way, which is about one order of magnitude below the value inferred from the spindown rate.
3.2 Soft component
Once the hard X-ray component is fitted by the outflow model, we turn to the remaining soft component below 10 keV. Note that the outflow makes a non-negligible contribution below 10 keV (the two components overlap in this region). Thus, understanding the origin of the hard X-ray component and its low-energy extension is important for the correct interpretation of soft X-ray emission. Previous models for the 1-10 keV spectrum involved radiative transfer in the the neutron star atmosphere (e.g. Ho & Lai 2001; Özel 2001) or resonant scattering by mildly relativistic electrons flowing in the magnetosphere (Thompson et al. 2002). Alternatively, the soft X-ray tail was proposed to be the signature of a hot spot on the star (e.g. Gotthelf & Halpern 2007).
Motivated by the j-bundle picture described in Section 2, we investigated models that include the possible presence of a hot spot. Two-temperature blackbody (2BB) is a simplest model of this type. The lower temperature is typically associated with a large area (comparable to the area of the neutron star surface) and the higher temperature is associated with the footprint of the j-bundle. This simple model was sufficient to provide a good fit for the spectrum of 1E 1841–045 (An et al. 2013). We found that the 2BB model is insufficient for the soft component of 4U 0142+61 and 1RXS J1708–4009. This may be expected, as the soft X-ray spectrum should be modified by resonant scattering in the magnetosphere (e.g. Thompson et al. 2002; Rea et al. 2008), although a consistent model for this effect is yet to be developed (see Beloborodov 2013b for discussion). We chose a phenomenological modification of the 2BB model: we replaced the Wien tail of the hotter blackbody by a power law that is smoothly connected to the Planck spectrum at some energy . Smooth connection here means the continuity of the photon spectrum and its first derivative; then is the only required additional parameter. The temperatures and of the cold and hot blackbodies, their luminosities and , and uniquely define our modified 2BB model.
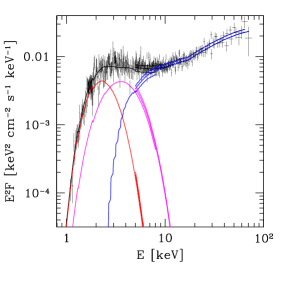
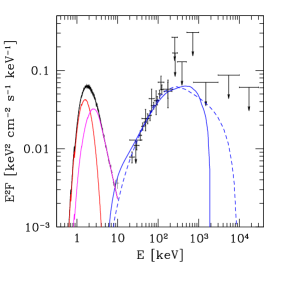
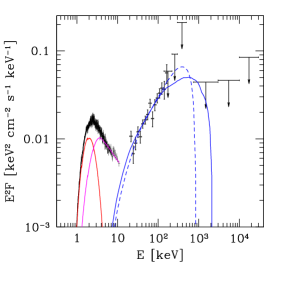
We found that the spectra of 4U 0142+61 and 1RXS J1708–4009 are reasonably well fitted by the modified 2BB model; the results are summarized in Table 2. The formal is unsatisfying, because of the high spectral resolution of XMM and the inability of simple phenomenological models to describe spectral lines. However the continuum of observed spectra is well reproduced. The residuals are largest below 3 keV and suggest the presence of line-like features; this issue was already pointed by den Hartog et al. (2008a). The best fits of the soft and hard components are shown together in 3.
For comparison, we also tried to fit the soft component with the sum of one (modified) blackbody and a power law. This model provided acceptable fits for 1RXS J1708–4009 and 1E 1841–045, but not for 4U 0142+61 (dof). An additional, well known drawback of this model is the large contribution of the power-law below keV, which results in an unrealistically large best-fit value of the hydrogen column density toward the object.
| aafootnotemark: | aafootnotemark: | /dof | |||||
|---|---|---|---|---|---|---|---|
| () | (keV) | (keV) | (keV) | ||||
| 4U 0142+61 | 0.577(5) | 0.307(4) | 0.602(9) | 3.82(6) | 2.63(3) | 1.36(9) | 559/448 |
| 1RXS J1708–4009 | 0.99(1) | 0.39(1) | 0.87(5) | 4.0(2) | 0.69(3) | 0.56(12) | 297/228 |
| 1E 1841–045 | 2.03(4) | 0.45(1) | 0.90(4) | 2.15(7) | 0.65(9) | 2298/2272 |
Note.
a In units of . See Table 1 for the values of .
| 1E 1841–045 | 4U 0142+61 | 1RXS J1708–4009 |
|---|---|---|
 |
 |
 |
4 Discussion
Remarkably, the coronal outflow model fits the data in a small region of the parameter space, which allowed us to derive significant constraints on the active bundle of magnetic field lines (j-bundle). In particular, for 4U 0142+61 and 1RXS J1708–4009 the opening angle of the j-bundle , and its total luminosity (most of which is emitted in the MeV band, outside the observed spectral range) is erg s-1. Both parameters are in line with theoretical expectations (Beloborodov 2009). Using Equation (3) one can estimate the product of the twist angle and the discharge voltage in the j-bundle. We found V, consistent with V.111 The twist angle is expected for an active magnetar. The growth of beyond a critical value is prohibited by a global instability — the over-twisted magnetopshere inflates, forms an unstable current sheet, and ejects magnetic plasmoids, reducing the twist energy (Parfrey et al. 2013). This voltage is higher (at least by a factor of a few) compared with theoretical estimates of Beloborodov & Thompson (2007) or the voltage inferred from the outburst decay in XTE J1810197 (Beloborodov 2009).
The j-bundle parameters obtained for 4U 0142+61 and 1RXS J1708–4009 are comparable, which may be expected, as their spectra are similar. The spectrum of 1E 1841–045 is significantly different: the spectral index of its hard X-ray component is larger and the dip between the soft and hard components is smaller. We find that this difference is mainly explained by different angles and ; the parameters of the j-bundle itself ( and ) are comparable for all three objects. The fact that two out of three magnetars appear to have a small angle between the magnetic and rotation axes suggests that rotation plays a role in shaping the magnetic moment of the neutron star. Future measurements of phase-resolved spectra for other magnetars will allow one to better study the statistics of . Independent constraints on and can be provided by measurements of X-ray polarization by future missions (such as Astro-H, Takahashi et al. 2012).
The analysis of the hard X-ray component gives the magnetic flux in the j-bundle from which one can estimate its footprint area . The exact area and location of the footprint depend on details of the magnetic field near the star; a rough estimate for may be obtained assuming a dipole field. A hot spot with area may be expected on the star. The obtained fits of the soft X-ray component are indeed consistent with the presence of a hot spot and give an independent estimate for its area . In 1RXS J1708–4009 and 1E 1841–045, is consistent with , providing further support to our model. For 4U 0142+61 we found , suggesting a hot spot extending around the j-bundle footprint or indicating that the centered dipole configuration is a poor approximation to the magnetosphere near the star.
Instead of studying the phase-resolved spectra in three phase bins, one could use coarse spectral binning and analyze more detailed pulse profiles. We did not attempt to fit the detailed pulse profiles, because they are significantly affected by moderate deviations from axisymmetry.222 The j-bundle emission is relativistically beamed along the magnetic field lines, especially in the hard X-ray band. Breaking the axial symmetry (concentration of electric currents in a range of magnetic longitude) affects the observed pulse profiles. Relaxing the axisymmetric assumption would make the model more flexible and difficult to describe using a small number of parameters. This would require a different, more complicated fitting procedure. Note also that the pulsed fractions of the three magnetars are moderate even at high energies, in the range of 30-40% at keV (W. Hermsen, private communication). This is consistent with approximate axisymmetry of the j-bundle, explaining why our simple model gives reasonable fits to the phase-resolved spectra in wide phase bins.
The coronal outflow model predicts that most of the luminosity is emitted in the MeV band. Future detectors with sensitivity better than that of Comptel would help to better constrain the location of the j-bundle and the angle between the magnetic and rotation axes.
References
- An et al. (2013) An, H., Hascoët, R., Kaspi, V. M., et al. 2013, ApJ, 779, 163
- Beloborodov (2009) Beloborodov, A. M. 2009, ApJ, 703, 1044
- Beloborodov (2013a) —. 2013a, ApJ, 777, 114
- Beloborodov (2013b) —. 2013b, ApJ, 762, 13
- Beloborodov & Thompson (2007) Beloborodov, A. M., & Thompson, C. 2007, ApJ, 657, 967
- den Hartog et al. (2006) den Hartog, P. R., Hermsen, W., Kuiper, L., et al. 2006, A&A, 451, 587
- den Hartog et al. (2008a) den Hartog, P. R., Kuiper, L., & Hermsen, W. 2008a, A&A, 489, 263
- den Hartog et al. (2008b) den Hartog, P. R., Kuiper, L., Hermsen, W., et al. 2008b, A&A, 489, 245
- Dib et al. (2007) Dib, R., Kaspi, V. M., & Gavriil, F. P. 2007, ApJ, 666, 1152
- Dib et al. (2008) —. 2008, ApJ, 673, 1044
- Duncan & Thompson (1992) Duncan, R. C., & Thompson, C. 1992, ApJ, 392, L9
- Durant & van Kerkwijk (2006) Durant, M., & van Kerkwijk, M. H. 2006, ApJ, 650, 1070
- Enoto et al. (2010) Enoto, T., Nakazawa, K., Makishima, K., et al. 2010, ApJ, 722, L162
- Gotthelf & Halpern (2007) Gotthelf, E. V., & Halpern, J. P. 2007, Ap&SS, 308, 79
- Ho & Lai (2001) Ho, W. C. G., & Lai, D. 2001, MNRAS, 327, 1081
- Kuiper et al. (2006) Kuiper, L., Hermsen, W., den Hartog, P. R., & Collmar, W. 2006, ApJ, 645, 556
- Özel (2001) Özel, F. 2001, ApJ, 563, 276
- Parfrey et al. (2013) Parfrey, K., Beloborodov, A. M., & Hui, L. 2013, ApJ, 774, 92
- Rea et al. (2008) Rea, N., Zane, S., Turolla, R., Lyutikov, M., & Götz, D. 2008, ApJ, 686, 1245
- Takahashi et al. (2012) Takahashi, T., Mitsuda, K., Kelley, R., et al. 2012, in Society of Photo-Optical Instrumentation Engineers (SPIE) Conference Series, Vol. 8443
- Thompson & Duncan (1996) Thompson, C., & Duncan, R. C. 1996, ApJ, 473, 322
- Thompson et al. (2002) Thompson, C., Lyutikov, M., & Kulkarni, S. R. 2002, ApJ, 574, 332
- Tian & Leahy (2008) Tian, W. W., & Leahy, D. A. 2008, ApJ, 677, 292