From Molecular Dynamics to Brownian Dynamics
Abstract
Three coarse-grained molecular dynamics (MD) models are investigated with the aim of developing and analyzing multiscale methods which use MD simulations in parts of the computational domain and (less detailed) Brownian dynamics (BD) simulations in the remainder of the domain. The first MD model is formulated in one spatial dimension. It is based on elastic collisions of heavy molecules (e.g. proteins) with light point particles (e.g. water molecules). Two three-dimensional MD models are then investigated. The obtained results are applied to a simplified model of protein binding to receptors on the cellular membrane. It is shown that modern BD simulators of intracellular processes can be used in the bulk and accurately coupled with a (more detailed) MD model of protein binding which is used close to the membrane.
keywords:
multiscale modelling, molecular dynamics, Brownian dynamics1 Introduction
Brownian dynamics (BD) simulations have been used for the modelling of a number of spatio-temporal processes in cellular and molecular biology in recent years, including models of intracellular calcium dynamics (Flegg et al., 2013), signal trasduction in E. coli chemotaxis (Lipkow et al., 2005) and MAPK pathway (Takahashi et al., 2010). In these applications, trajectories and interactions between key biomolecules (e.g. proteins) are calculated using BD methods, while other components of the system (e.g. solvent molecules), which are of no special interest to a modeller, are not explicitly included in the simulation, but contribute to the dynamics of Brownian particles collectively as a random force. This reduces the dimensionality of the problem, making BD less computationally intensive than the corresponding molecular dynamics (MD) simulations.
Denoting the position of a Brownian particle by and its diffusion constant by , a simple model of Brownian motion is given by the (overdamped) Langevin equation
| (1) |
where , , are three independent Wiener processes (Erban et al., 2007). BD approaches which are based on (1) have been implemented in a number of software packages designed for spatio-temporal modelling in systems biology, including Smoldyn (Andrews & Bray, 2004), MCell (Stiles & Bartol, 2001), Green’s Function Reaction Dynamics (van Zon & ten Wolde, 2005) and First-passage kinetic Monte Carlo method (Opplestrup et al., 2009). The software package Smoldyn discretizes (1) using a fixed time step , i.e. it computes the time evolution of the position of each molecule by
| (2) |
where is a vector of normally distributed random numbers with zero mean and unit variance. A different BD approach is implemented in the Green’s Function Reaction Dynamics (Takahashi et al., 2010) which evolves time using a variable time step. It approximately computes the time when the next reactive event happens. This means that trajectories of molecules which are not surrounded by other reactants can be simulated over longer time steps.
Altough the BD models are becoming a popular choice for stochastic modelling of intracellular spatio-temporal processes, several difficulties prevent the use of BD for some systems. First of all, detailed BD models are often more computationally intensive than coarser spatio-temporal models which are written for concentrations of biochemical species. In some applications (e.g. intracellular calcium dynamics (Flegg et al., 2013) or actin dynamics in filopodia (Erban et al., 2013)) individual trajectories (computed by BD) are important only in certain parts of the computational domain, whilst in the remainder of the domain a coarser, less detailed, method can be used. In these applications, the computational intensity of BD simulations can be decreased by using multiscale methods which efficiently and accurately combine models with a different level of detail in different parts of the computational domain (Flegg et al., 2012; Franz et al., 2013).
Another difficulty of BD simulations in cell and molecular biology is that detailed BD models require more parameters than coarser (macroscopic) models. In some studies, macroscopic parameters are used to infer BD parameters (Lipkova et al., 2011; Andrews & Bray, 2004). For example, knowing the macroscopic reaction rate of a bimolecular reaction and diffusion constants of reactants, one can calculate a (microscopic) reaction radius of BD simulations which gives the corresponding macroscopic parameters in the limit of many particles. In the classical Smoluchovski limit (Smoluchowski, 1917), a bimolecular reaction occurs whenever the distance of reactants is less than the reaction radius
| (3) |
where (resp. ) is the diffusion constant of reactant (resp. ). Although this approach is commonly applied in stochastic reaction-diffusion models, it is not the most satisfactory, because different microscopic models can lead to the same macroscopic process and parameters (Erban & Chapman, 2009; Lipkova et al., 2011). For example, the simplest Smoluchowski model (3) assumes that all collisions are reactive but, in reality, many non-reactive collisions of molecules happen before a reactive collision occurs. Therefore, some algorithms postulate that molecules only react with a certain rate (probability) when the distance between reactants is less than a modified reaction radius (which is larger than ). Other methods discretize the Langevin equation with time step and substitute the Smoluchowski formula (3) (which is valid for an infinitely small time step) by a tabulated function computed numerically (Andrews & Bray, 2004). However, all of these approaches are verified by considering the macroscopic limit (of many reactants) and showing that the reaction occurs with the given rate in this limit.
A different approach to parameterize BD models is to use a more detailed description written in terms of MD. In this paper, we investigate connections between BD and MD models with the aim of developing and analyzing of multiscale methods which couple BD and MD simulations. We consider a (computationally intensive) MD simulation in domain which is either one-dimensional or three-dimensional, i.e. or . Our main goal is to design and analyse multiscale methods which can compute spatio-temporal statistics with MD-level of detail in the subdomain . We define
| (4) |
where and are open sets, the (open) set is the complement of and is the shared interface (boundary) between and . In the multiscale set up (4), we use a detailed MD model in and a coarser BD model in .
In this paper, we focus on a simple MD approach which is introduced in Sections 2 and 3. A few (heavy) particles with mass and radius are coupled with a large number of light point particles with masses . The collisions of particles are without friction, which means that post-collision velocities can be computed using the conservation of momentum and energy (Holley, 1971; Dürr et al., 1981). We will introduce and study three MD models which make use of elastic collisions. They will be denoted as MD models [A], [B] and [C] in what follows. More complicated MD approaches are discussed in Section 7.
The first MD model [A] is introduced in Section 2. It is a one-dimensional MD model where all particles move along the real line. In particular, the radius do not have to be considered, because it has no influence on the dynamics of large particles. In one dimension, heat bath particles cannot pass each other, which makes the MD model [A] different from three-dimensional models in Section 3 where heat bath particles (points) do not interact with each other.
In Section 3, we introduce two three-dimensional models, denoted [B] and [C], where the nonzero radius is one of the key parameters. To make one-dimensional and three-dimensional models comparable, we keep fixed in the three-dimensional model and we study the behaviour of all MD models in the limit This limit can be achieved in many different ways. For example, we can keep fixed and pass , or we can keep fixed and pass . In what follows we define the parameter
| (5) |
This parameter is dimensionless, even if we assume that and have physical units of mass. However, in this paper, all parameters are considered dimensionless for simplicity. We are interested in the limit .
All three models [A], [B] and [C] converge in apropriate limits to the Brownian motion of large particles given by (1). One can also show that these models converge to the Langevin description (Holley, 1971; Dürr et al., 1981; Dunkel & Hänggi, 2006)
| (6) | |||||
| (7) |
where is the position of a diffusing molecule, is its velocity, is the diffusion coefficient and is the friction coefficient. This description can be further reduced to (1) in the overdamped limit . We overview the results which relate MD models [A], [B] and [C] with Brownian motion in Sections 2 and 3.
Both (1) or (6)–(7) reduce the dimensionality of the problem, making BD less computationally intensive than the corresponding MD simulations. In Sections 4 and 5, we study how MD models [A], [B] and [C] can be used in one part of the computational domain and the BD models (1) or (6)–(7) in the remainder , making use of the notation (4). We apply our findings to a simplified model of protein binding to receptors in Section 6. We conclude with discussing our results in Section 7.
2 One-dimensional MD model [A]
The MD model [A] is described in terms of positions and velocities , , of heat bath particles, and positions and velocities , , of heavy particles of mass , where is the mass of a heat bath particle. In our computer implementations, we will consider a finite number of heat bath particles. However, we formulate the MD model in terms of (countably) infinitely many of heat bath particles which are initially distributed along the real line according to the Poisson distribution with density
| (8) |
where is given by (5), and and are positive constants. This means that the probability that there are particles in a subinterval , , is equal to
where is the lentgth of the interval . Initial velocities of heat bath particles are given by the normal distribution
| (9) |
Let us consider a model with a single heavy particle, i.e. . Then its location and velocity will be denoted as and to simplify our notation. Whenever the heavy particle collides with the light particle with velocity , their velocities are updated using the conservation of mass and momentum:
| (10) | |||||
| (11) |
where tildes denote post-collision velocities. Using (5), the equations (10)–(11) can be rewritten as
| (12) |
The following result can be shown for the above MD model [A]:
Lemma 2.1.
Let and . Let us consider the heavy particle of mass with initial position and initial velocity which is subject to elastic collisions with heat bath particles of mass whose initial positions and velocities are distributed according to –. Then the and converges (as ) in distribution to the solution and of equations
| (13) |
where and . That is, and solve the one-dimensional version of equations –.
Proof 2.2.
This lemma can be proven using the main theorem in Holley (1971) where it is shown that a similar process converges to the Ornstein-Uhlenbeck process for velocities. Although our funcion does not satisfy all assumptions of the main theorem of Holley (1971), a simple rescaling of our parameters leads to a process which is covered by Holley’s theorem. In Section 4 of this paper, we also rederive this result as one of the consequences of multiscale analysis, see (41).
Since the goal of this paper is to study the behaviour of computational algorithms, we formulate the MD model [A] in a finite domain , i.e. we consider a finite number of heat bath particles which are at positions with velocities , . We want to formulate boundary conditions of our problem so that the spatio-temporal statistics in are equivalent to spatio-temporal statistics of the original unbounded process. The following lemma will be useful for designing appropriate boundary conditions.
Lemma 2.3.
Let and . Let us assume that heat bath particles are distributed according to the Poisson distribution with density in the interval . Their initial velocities are given according to and there are no particles in the interval at time . Then the average number of particles in the interval at time is
| (14) |
The positions and velocities of these particles are distributed according to
| (15) |
where is the Heaviside step function. In particular, the positions of the particles at point are distributed at time according to
| (16) |
where is the complementary error function.
Proof 2.4.
Particles which are at point at time were previously at point at time . In particular, there will be nonzero heat bath particles with velocity at point at time provided that which implies (15). Consequently, the density of particles which are at point at time is
Thus we proved (16). Integrating this formula over in interval , we obtain the average number of particles which are in the interval at time :
We use Lemma 2.1 and Lemma 2.3 to design a computational test for multiscale methods. Since the number of heat bath particles in is much larger than the number of large particles, we will focus on models of a single large particle, i.e. , which is described by its position and velocity . We choose a small time step . One iteration of the MD algorithm is presented in Table 1.
[A1] Compute “free-flight positions” of heat bath particles and the large particle at time by: and [A2] Compute post-collision velocities by (12) for every pair of particles which collided. Compute their post-collision positions and by updating their “free-flight positions” and [A3] Terminate trajectories of heat bath particles which left the domain . Update accordingly. [A4] Generate a random number uniformly distributed in . If , then increase by 1, and introduce a new heat bath particle at a position sampled according to the probability distribution proportional to . Its velocity is sampled according to the probability distribution proportional to . [A5] Generate a random number uniformly distributed in . If , then increase by 1, and introduce a new heat bath particle at position with velocity which are sampled according to probability distributions (18) and (19). [A6] Continue with the step [A1] using time .
We first compute the positions of all particles at time in the step [A1] by assuming that particles do not interact. Then we use (12) to incorporate collisions in the step [A2]. Since all heat bath particles have the same mass, the collisions between them result in exchange of colliding particles’ positions and velocities. In particular the step [A2] can be implemented by sorting the heat bath particles during every iteration. All particles which left the domain are removed in the step [A3].
New heat bath particles are introduced in the steps [A4] and [A5]. We assume that is chosen so small that (14) is much smaller than 1. Then (14) can be interpretted as a probability of introducing one particle from the left (resp. right) during one timestep. Using Lemma 2.3, the new particle will be introduced at the (left boundary) position which is sampled according to the probability distribution proportional to in the step [A4]. To sample from this probability distribution, we scale and shift a random number sampled from the complementary error function distribution where . An acceptance-rejection algorithm for sampling random numbers from is given in Table 2. We use it with the constants and given by
| (17) |
The values of constants and were computed to maximize the total acceptance probability of the acceptance-rejection algorithm in Table 2. Using (17), we accept 86% of proposed numbers .
Generate a random number uniformly distributed in (0,1). Compute exponentially distributed random number by Generate a random number uniformly distributed in (0,1). If , then choose as a sample from the probability distribution . Otherwise, repeat the algorithm.
A particle introduced close to the right boundary in the step [A5] will have its position sampled according to the probability distribution
| (18) |
where is a normalization constant. The probability distribution (18) is proportional to and can be justified using the same argument as Lemma 2.3. To sample from the probability distribution (18), we again use the acceptance-rejection algorithm in Table 2 with parameters and given by (17). In the step [A5], we also sample the velocity of the new particle using the truncated Gaussian distribution
| (19) |
where is a normalization constant. To sample random numbers according to the truncated normal distributions in the steps [A4] and [A5], we use an acceptance-rejection algorithm which is derived as Proposition 2.3 in Robert (1995).
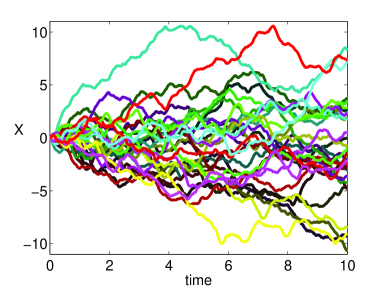
In Figure 1, we present illustrative results computed by the algorithm [A1]–[A6]. We use and . We initialize the position and velocity of the heavy particle as and and we use the algorithm [A1]–[A6] with time step in the interval where .
(a)
 (b)
(b)
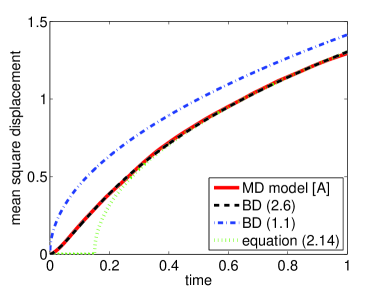
In Figure 1(a), we present 30 illustrative trajectories of the heavy particle computed for . The mean square displacement given by the MD model [A] is plotted in Figure 1(b) as the red solid line. To illustrate the limiting result in Lemma 2.1, we also plot the mean square displacement corresponding to the limiting solution of (13). It can be analytically computed as
| (20) |
where denotes the expected value. It is plotted as the black dashed line in Figure 1(b). We also plot the mean square displacement corresponding to the overdamped limit (1), i.e. , as the blue dot-dashed line in Figure 1(b). If we neglect the exponential terms in (20), we obtain
| (21) |
This approximation is plotted in Figure 1(b) as the green dotted line. We will use (21) later in Section 6 to couple the overdamped BD model (1) with MD simulations.
3 Three-dimensional MD models [B] and [C]
MD models [B] and [C] are three-dimensional generalizations of the MD model [A]. They are described in terms of positions and velocities , , of heat bath particles, and positions and velocities , , of heavy particles of mass , where is the mass of a heat bath particle. We again define by (5). We will denote by the radius of a heavy particle.
MD models [B] and [C] are both based on elastic collisions of heavy molecules (balls with mass and radius ) with point bath particles with masses . Since the collisions are without friction, conservation of momentum and energy then yields the following generalization of formulae (12) for post-collision velocities (Dürr et al., 1981)
| (22) | |||||
| (23) |
where is the velocity of the heat bath molecule which collided with the -th heavy molecule, tildes denote post-collision velocities, superscripts denote projections of velocities on the line through the centre of the molecule and the collision point on its surface, and superscripts denote tangential components.
3.1 MD model [B]
MD model [B] will use the normal distribution for velocities of heat bath particles. The following lemma generalizes Lemma 2.1 to the three-dimensional MD model [B].
Lemma 3.1.
Let , and . Let us consider the MD model [B] where heat bath particles are distributed according to the Poisson distribution with density
| (24) |
Let the velocities of heat bath particles are distributed according to
| (25) |
and We will consider one heavy molecule in such a heat bath, i.e. . Then the position and velocity of the heavy molecule, and , converge (in the sense of distribution) to the solution of – in the limit
Proof 3.2.
The MD model [B] and heat bath distributions (24) and (25) satisfy the assumptions of Theorem 2.1 in Dürr et al. (1981). Their theorem expresses the limiting equation of a process with given and in terms of moments of . These moments can be analytically evaluated to verify the statement of Lemma 3.1. We will also rederive this result in Section 5 as a consequence of the analysis of multiscale methods.
Lemma 3.1 can be viewed as a different formulation of Theorem 2.1 in Dürr et al. (1981). They were interested in the limit which is equivalent to . Considering the scaling of the velocity distribution of heat bath particles (with density scaled as ), they derived formulae for and in terms of moments of and . To formulate Lemma 3.1, we inverted their results by deriving the appropriate distributions (24) and (25) which lead to the limiting BD model with a given and .
3.2 MD model [C]
In Lemma 3.1 we used the normal distribution for velocities (25). Another option is to use heat bath particles with fixed speed as it is done in the following Lemma 3.3. We denote the resulting MD model as the MD model [C].
Lemma 3.3.
Let , and . Let us consider the MD model [C] where heat bath particles are distributed according to the Poisson distribution with density
| (26) |
Let the velocities of heat bath particles are distributed according to
| (27) |
and is a Dirac distribution. Let us consider one heavy molecule in this heat bath at position with velocity . Then and converge (in the sense of distribution) to the solution of – in the limit
3.3 Boundary conditions for MD models [B] and [C]
Next, we generalize Lemma 2.3 to the three-dimensional case. This will help us to specify boundary conditions for simulations which use the MD models [B] and [C] in finite domains.
Lemma 3.4.
Let and . Let us assume that heat bath particles are distributed according to the Poisson distribution with density in the half space ; their initial velocities are distributed according to and there are no particles in the half space at time . Let us assume that and are either given by – (MD model [B]), or by – (MD model [C]).
Then the positions and velocities of heat bath particles in the half space are distributed at time according to
| (28) |
and the average number of particles in the semi-infinite cuboid at time is
| (29) |
Proof 3.5.
Formula (28) is a generalization of formula (15) in Lemma 2.3 and can be justified using the same arguments. To prove (29), we will distinguish two cases.
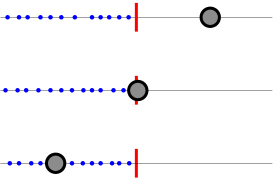
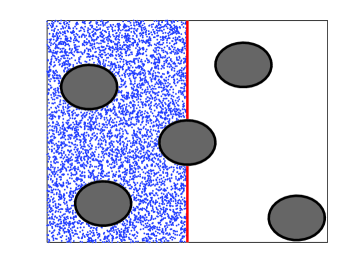
Lemma 3.4 can be used to specify boundary conditions for simulations of the MD models [B] and [C] in finite domains as we did for the one-dimensional case in Lemma 2.3. In Section 5, we will use Lemma 3.4 to develop and analyse multiscale approaches which can efficiently and accurately compute results with an MD-level of detail in a (relatively small) subdomain by using coarser BD simulations in the remainder. The geometry of the desired multiscale method is formulated using (4) where an MD model is used in , a coarser BD model is used in and these models are coupled across the interface . The situation is schematically shown in Figure 2(d) which presents a two-dimensional version of our multiscale set up. Here, blue point particles describe heat bath molecules which are used in . Large biomolecules of interest are denoted as grey circles. They are simulated using BD in . The red line denotes interface .
(a) (d)
(b)
(c)
The schematic in Figure 2(d) is presented in two spatial dimensions to better visualize the problem geometry. MD models [B] and [C] are formulated in a three-dimensional physical space. In the three-dimensional version of Figure 2(d), the cloud of blue particles would cover grey ball. To get some insights into this multiscale problem, we start with the one-dimensional MD model [A].
4 From one-dimensional MD model [A] to Brownian dynamics
In the case of one-dimensional MD model [A], the situation is schematically shown in Figures 2(a)-(c) where we only consider one large (heavy) particle, i.e. . The large particle can either be in (see Figure 2(a)), or in (see Figure 2(c)) or crossing the boundary as it is shown in Figure 2(b). Our geometry is given by (4) where
The large particle covers the interval . Let us consider that the large particle intersects the interface as it is shown in Figure 2(b). Then which is equivalent to . The heat bath particles are simulated in using the MD model [A]. Let us choose so small that the probability of two collisions happening in the time interval is negligible. Since we do not explicitly simulate heat bath particles in , we will consider an additional correction of the velocity of the heavy particle in the form
| (31) |
where is the post-collision velocity of the heavy particle at time which only takes into account collisions with the heat bath particles from the left. It is either equal to or computed by (12) if a collision with a heat bath particle occurred in . Equation (31) is adding both drift term and noise term where is a normally distributed random number with zero mean and unit variance. The drift and noise terms implicitly take into account collisions at the right boundary of the heavy particle. Passing , we observe that the contributions of the collisions at the right boundary are given by the Itō stochastic differential equation
| (32) |
If we explicitly modelled heat bath particles in , then they would be distributed according to the Poisson distribution with density in the interval . Their initial velocities would be given according to . Thus, using Lemma 2.3 and (12), we can estimate the drift coefficent of the stochastic differential equation (32) to get
where is the Heaviside step function. Using (9), we obtain
| (33) | |||||
where and are given by (8) and (9). In the limit , we have . Thus we use the Taylor expansion in (33) to get
| (34) |
The noise term in (32) can be computed by
Using (9), we obtain
Using (8), (9) and the Taylor expansion, we obtain
| (35) |
Equations (34) and (35) are used in the multiscale algorithm in Table 3.
[M1] Compute “free-flight positions” of heat bath particles and the heavy particle at time using the step [A1]. [M2] Compute post-collision velocities by (12) for every pair of particles which collided using the step [A2]. [M3] Terminate trajectories of heat bath particles which left the subdomain . Update accordingly. [M4] Implement the influx of heat bath particles through the boundary using the step [A4]. [M5] If , then generate a random number uniformly distributed in . If , then increase by 1, and introduce a new heat bath particle at position with velocity which are sampled according to probability distributions (36) and (37). [M6] If , then update the heavy particle velocity using (31). [M7] If , then update the velocity of the heavy particle using (38). [M8] Continue with the step [M1] using time .
The first two steps [M1] and [M2] are the same as [A1] and [A2]. Since heat bath particles are only simulated in the subdomain , we remove all particles which left during the time interval in the step [M3]. The step [M4] is the same as [A4] which introduces heat bath particles which have entered through its left boundary during the time interval . The boundary at is treated in the step [M5] if the heavy particle does not intersect with this boundary. We assume that is chosen so small that (14) is much smaller than 1. Then (14) can be interpretted as a probability of introducing one particle from the left (resp. right) during one timestep. A particle introduced close to the right boundary of in the step [M5] will have its position sampled according to the probability distribution
| (36) |
where is a normalization constant. The probability distribution (36) can be justified using the same argument as Lemma 2.3 and equation (18). To sample from the probability distribution (36), we again use the acceptance-rejection algorithm in Table 2 with parameters and given by (17). In the step [M5], we also sample the velocity of the new particle using the truncated Gaussian distribution
| (37) |
where is a normalization constant. To sample random numbers according to the truncated normal distributions in the steps [M4] and [M5], we again use the acceptance-rejection algorithm which is derived as Proposition 2.3 in Robert (1995). If the heavy particle does intersect with the boundary , then the step [M6] is executed. It uses (31) to incorporate collisions of heat bath particles from the right. If the particle does not intersect with , then we simulate it in the step [M7] using the discretized version of (7) given by
| (38) |
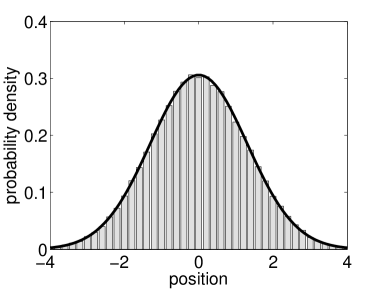
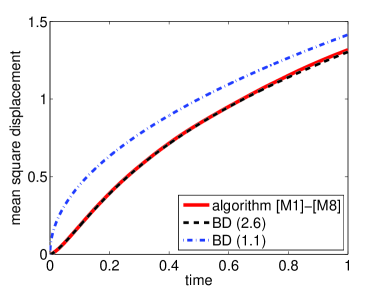
In Figure 3, we present illustrative results
(a)
 (b)
(b)
computed by the algorithm [M1]-[M8]. We consider one heavy particle which starts at position with velocity as we did in Figure 1. The distribution of its position at time , computed using realizations of the algorithm [M1]-[M8], is plotted in Figure 3(a). It is compared with the distribution obtained by the limiting BD model (13) which is, for , given by (Hagan et al., 1989)
| (39) |
In Figure 3(b), we plot the time evolution of the mean square displacement. This figure can be directly compared with Figure 1(b), because we use the same parameter values. The results computed by the multiscale algorithm [M1]-[M8] compare well with the results given by the BD model (13). We have already shown in Figure 1(b) that the limiting BD model (13) also compares well with the MD simulations. In particular, the algorithm [M1]-[M8] is able to compute results with the MD-level precision by using coarser BD models in a part of the computational domain.
The stochastic differential equation (32) was derived for collisions from the right. Using the same argument, we can also derive a stochastic differential equation which is approximating the effect of collisions from the left. We obtain
| (40) |
Adding (32) and (40) and using the independence of noise terms in (32) and (40), we can approximate collisions from both sides by the following SDE for the velocity of the heavy particle:
| (41) |
Substituting (34) and (35), we derive (7). In particular, we have verified the limiting result in Lemma 2.1.
5 From three-dimensional MD models [B] and [C] to Brownian dynamics
We use a simple multiscale geometry where domain is divided into two half spaces. Heavy molecules are simulated in both half spaces. In , we use the MD model [B] or [C]. It is coupled with the BD model given by (6)–(7) in This set up is a three-dimensional version of multiscale problems which are schematically drawn in Figure 2. Boundary conditions for heat bath particles at the interface can be specified using Lemma 3.4.
As in Section 4, we need to analyse the behaviour of a heavy molecule when it intersects with the interface . Such molecule is subject to the collisions with heat bath particles on the part of its surface which lies in . This has to be compensated by using a suitable random force from , so that the overall model is equivalent to (6)–(7) in the BD limit. To simplify the presentation of the algorithm, we use the same time step in and . In Section 6 we present coupling of three-dimensional MD models with the BD model (1) which will make use of different time steps in different parts of the computational domain.
The heavy particle is the ball with centre with velocity and radius . It intersects the interface if . Let us consider that heat bath particles are simulated in using the MD model [B] or the MD model [C]. Let us choose so small that the probability of two collisions happening in the time interval is negligible. Since we do not explicitly simulate the heat bath particles in , we will consider an additional correction of the velocity of the heavy particle in the form
| (42) |
where is the post-collision velocity of the heavy particle at time which only takes into account collisions with the heat bath particles from . It is either equal to or computed by (22)–(23) if a collision with a heat bath particle occurred in . Note that we dropped the subscript in (22)–(23) to simplify our notation. Equation (42) is a generalization of (31) to three-dimensional simulations where is the drift vector and is the noise term and is the vector of three normally distributed random numbers with zero mean and unit variances. Passing , we observe that the contributions of the collisions from are given by the Itō stochastic differential equation
| (43) |
To estimate drift and diffusion coefficient , we separately consider MD models [B] and [C] in the following two subsections.
5.1 MD model [B]
The following lemma will be useful to estimate the drift coefficient .
Lemma 5.1.
Let , , and . Let us consider the MD model [B] where the positions and velocities of heat bath particles are distributed according to and . Let us consider one heavy molecule in such a heat bath, i.e. , with the position of its centre to be at and with velocity . Let be a given point on the surface of the heavy molecule at time , i.e.
| (44) |
Then the average change of the -th component of the velocity of the heavy molecule caused by collisions with heat bath particles in the time interval at the surface area is where
| (45) | |||||
Proof 5.2.
Let us consider that a heat bath particle which was at point at time collided with the heavy molecule at time at the surface point which had coordinate at time . Then the coordinate of the surface point at the collision time was and the pre-collision velocity of the heat bath molecule was . Using equation (22), we can write the change of the velocity of the heavy molecule during the collision as
| (46) |
The position of the heat bath particle must be in the half space which lies above the plane tangent to the heavy molecule at the collision point . It can be parametrized by
where , and , , is the orthornormal basis in Then (46) reads as follows
Thus we have
| (47) | |||||
Substituting (25) for and integrating over , and , we have
Integrating over , we deduce (45).
Using Lemma 5.1, we can compute the drift coefficient in equation (43) as follows
| (48) |
where is the part of the surface of the heavy molecule which intersects the BD subdomain , i.e.
Substituting (45) into (48), we have
Using (24) and (25) and evaluating the surface integrals, we obtain
| (49) |
and
| (50) |
where we dropped the dependence on time to shorten the resulting formulae. The noise matrix will be estimated using , i.e. we will only use the first term in the Taylor expansion in . Using similar arguments as in the proof of (47) and (48), we have
| (51) | |||||
for . Substituting (25) for , (24) for and using , we obtain
| (52) | |||||
where the last equation can be verified using the same argument as equation (51). Notice that by substituting into (49), (50) and (52) we verify the limiting result in Lemma 3.1.
5.2 MD model [C]
Equations (47), (48) and (51) which are derived in the previous section are applicable to both MD models [B] and [C]. To estimate the drift coefficient for the MD model [C], we substitute (26) for and (27) for in (47) and (48). We obtain
| (53) |
and and are again given by (50). Substituting (26) and (27) in (51) and integrating, we obtain that noise matrix satisfies (52). We again notice that the special choice in (53) can be used to verify the limiting result in Lemma 3.3.
5.3 Illustrative numerical results
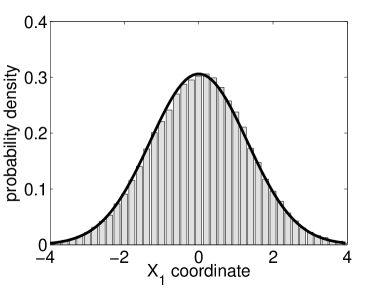
In the previous two subsections we have observed that the only difference between MD models [B] and [C] is a different formula for the coefficient in (43), given by (49) and (53), respectively. The remaining terms in (43) are the same, given by (50) and (52). In this section, we present an illustrative computation with the MD model [C], but the same results can also be obtained with the MD model [B] (results not shown). An illustrative computation with the MD model [B] is presented later in Section 6.
We consider a three-dimensional generalization of the illustrative problem from Figure 3 from Section 4. One heavy particle which starts at position with velocity is simulated using a three-dimensional generalization of the algorithm [M1]-[M8]. We use the MD model [C] in and the BD model (6)–(7) in In the step [M6], we replace (31) with its three-dimensional analogue (42) where drift and diffusion coefficient are given by (53), (50) and (52). The distribution of positions of the heavy particle at time , computed using realizations of the multiscale algorithm, is plotted in Figure 4(a). The limiting BD result is again given by
(a)
 (b)
(b)
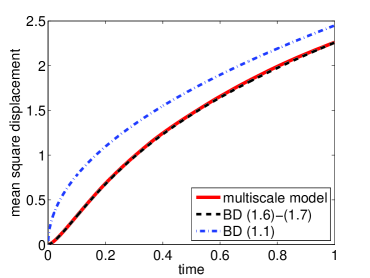
(39). In Figure 4(b), we plot the time evolution of the mean square displacement. The mean square displacement corresponding to the limiting BD model (6)–(7) is given by multiplied by because we have three spatial dimensions (black dashed line). As expected, the models compare well. The mean square displacement obtained for the BD model (1) is plotted as the blue dot-dashed line.
6 Application to protein binding to receptors
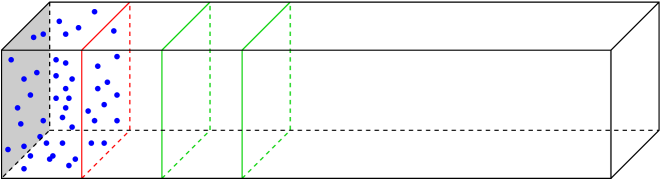
In this section, we apply our results to a simplified model of protein binding to receptors on the cell membrane. We consider simple geometry which is schematically shown in Figure 5. Our computational domain is a part of the intracellular space next to the cell membrane given as the cuboid where and . The cell membrane is modelled by one side of the cuboid, namely
which is shaded gray in Figure 5. Our goal is to model the binding of diffusing proteins to receptors on the cell membrane with an MD-level of detail. Therefore we define as a part of the intracellular space which is close to the cell membrane , i.e.
where and the interface is at . Diffusing proteins are modelled as spheres of radius . We consider that a protein which hits the boundary will bind to a receptor with probability , and otherwise it is reflected. This type of a reactive boundary condition is common for BD simulations (Erban & Chapman, 2007). In the case of MD, more detailed models of protein binding could be introduced in (Dror et al., 2011; Vilaseca et al., 2013). However, the main goal of this section is to show how an MD model in can be coupled with BD simulators which have been developed for simulations of intracellular processes. Therefore we keep the MD model in as simple as possible.
If we used BD model (6)–(7) in , then the situation would be more or less the same as in Section 5. However, modern BD simulators of intracellular processes work with the high-friction limit (1) rather than (6)–(7). For example, the software package Smoldyn discretizes (1) with a fixed time step and uses (2) to update positions of diffusing proteins. In particular, it uses larger values of time step than we used in Section 5. Then the problem can be formulated as follows: we would like to use the MD model with time step in and couple it with the BD model (2) with larger time step , namely
| (54) |
if the diffusing molecule is far away from . We couple these models using the intermediate BD model (6)–(7). We introduce two additional interfaces
where , as shown in Figure 5. We denote
i.e. and are two overlapping subdomains of . We simulate the time evolution of the position of one protein molecule. If , then the BD model (54) will be used in until the molecule leaves . Then we switch to the shorter time step and use the BD model (6)–(7) in . The protein molecule can leave in two possible ways:
(i) The protein molecule crosses the interface
Then we revert to the BD model (54) which
is used in .
(ii) The protein molecule crosses the interface
Then we use the method from Section 5
for coupling the MD model in with
the BD model (6)–(7) in .
Since the subdomains and overlap, we can use the limiting result (39) which implies that, for times , the BD model (6)–(7) is given by the BD model (54) shifted by time . In particular, we will also add or subtract from the time variable whenever we switch between BD models.
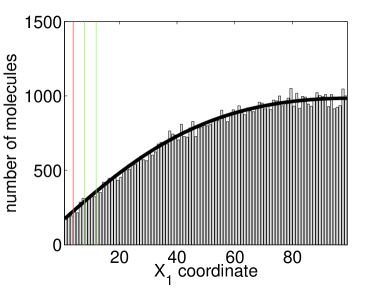
In Figure 6, we present illustrative results computed by averaging over realizations. Initial positions of the protein molecule are uniformly distributed along the axis. The histogram of positions (along the -axis) at time is plotted in Figure 6(a).
(a)
 (b)
(b)
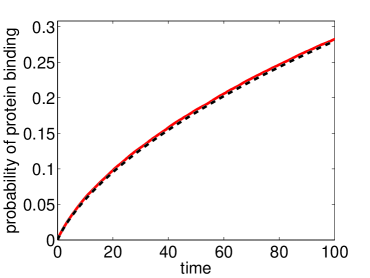
Interfaces , and are also shown in this plot. Since we used a very simple model of the protein binding, we can compare it with the mean-field limit given by the solution of the partial differential equation (PDE)
| (55) |
with boundary conditions (Erban & Chapman, 2007)
| (56) |
The solution of (55)–(56) with uniform initial condition is given by the black solid line in Figure 6(a). Since we only visualize the distribution along the axis in Figure 6(a), we can further decrease the computational cost by truncating the simulation domain in the and directions to the region close to the protein molecule. That is, we only simulate small particles in the subdomain where is the time when the protein molecule enters . This subdomain (moving window) is shifted accordingly whenever or approach its boundary.
7 Discussion
I have presented and analysed a multiscale approach which uses MD simulations in a part of the computational domain and BD simulations in the rest of the domain. The ultimate goal of this research is to use MD to help parameterize BD models of intracellular processes. One application area is modelling proteins in an aquatic environment which is useful for understanding protein binding to receptors (surfaces) as shown in Section 6.
The main idea of the presented coupling of MD and BD models is based on using equations (31) and (42) and estimating drift and diffusion coefficients for velocities of molecules which cross the interface . This coupling uses the same time step for the BD model (6)–(7) as for the MD model. In Section 6, it was shown that this is not a limiting step of this approach, because the BD model (6)–(7) is only needed in a small part of the domain next to . Then the coarser BD model (54) with larger time step can be used in the rest of the simulation domain, using a suitable overlap region. Another overlap region could be used to couple BD simulations with mean-field PDE-based models (Franz et al., 2013). Then multiscale models which couple BD (of point particles) with coarser reaction-diffusion approaches would be capable of further increasing time scales and space scales of simulations (Flegg et al., 2012; Franz et al., 2013).
MD models considered in this paper are relatively simple and analytically tractable, describing water molecules as point particles. An important generalization is to consider more complicated MD models of water molecules (Huggins, 2012). For example, Rahman & Stillinger (1971) model water molecules as rigid asymmetric rotors. That is, each water molecule is described by six coordinates: the position of its centre of mass and three angles describing molecule orientation. The energy of water solution is given as the sum of kinetic energies (for translation and rotation) and the intermolecular potential which is assumed to be pairwise additive and can be given in several different ways, i.e. the heat bath is given by its Hamiltonian (Rahman & Stillinger, 1971; Huggins, 2012; Mark & Nilsson, 2001). I am currently investigating MD models based on Hamiltonian dynamics, with the aim of designing and analyzing multiscale algorithms similar to the algorithm [M1]–[M8] from this paper. The ultimate goal of this research is to design BD models of intracellular process which make use of modern MD simulations (Merz, 2010; Deng & Roux, 2009) to infer parameters of BD models (Lipkova et al., 2011). I will report my results in a future publication.
Acknowledgements
I would like to thank the Royal Society for a University Research Fellowship; Brasenose College, University of Oxford, for a Nicholas Kurti Junior Fellowship; and the Leverhulme Trust for a Philip Leverhulme Prize. The research leading to these results has received funding from the European Research Council under the European Community’s Seventh Framework Programme (FP7/2007-2013) / ERC grant agreement No. 239870.
References
- Andrews & Bray (2004) Andrews, S. & Bray, D. 2004 Stochastic simulation of chemical reactions with spatial resolution and single molecule detail. Physical Biology, 1, 137–151.
- Deng & Roux (2009) Deng, Y. & Roux, B. 2009 Computations of standard binding free energies with molecular dynamics simulations. Journal of Physical Chemistry B, 113(8), 2234–2246.
- Dror et al. (2011) Dror, R., Pan, A., Arlow, D., Borhani, D., Maragakis, P., Shan, Y., Xu, H. & Shaw, D. 2011 Pathway and mechanism of drug binding to G-protein-coupled receptors. Proceedings of the National Academy of Sciences USA, 108(32), 13 118–13 123.
- Dunkel & Hänggi (2006) Dunkel, J. & Hänggi, P. 2006 Relativistic Brownian motion: From a microscopic binary collision model to the Langevin equation. Physical Review E, 74(5), 051 106.
- Dürr et al. (1981) Dürr, D., Goldstein, S. & Lebowitz, J. 1981 A mechanical model of Brownian motion. Communications in Mathematical Physics, 78, 507–530.
- Erban & Chapman (2007) Erban, R. & Chapman, S. J. 2007 Reactive boundary conditions for stochastic simulations of reaction-diffusion processes. Physical Biology, 4(1), 16–28.
- Erban & Chapman (2009) Erban, R. & Chapman, S. J. 2009 Stochastic modelling of reaction-diffusion processes: algorithms for bimolecular reactions. Physical Biology, 6(4), 046 001.
- Erban et al. (2007) Erban, R., Chapman, S. J. & Maini, P. 2007 A practical guide to stochastic simulations of reaction-diffusion processes. 35 pages, available as http://arxiv.org/abs/0704.1908.
- Erban et al. (2013) Erban, R., Flegg, M. & Papoian, G. 2013 Multiscale stochastic reaction-diffusion modelling: application to actin dynamics in filopodia. Bulletin of Mathematical Biology, to appear, DOI: 10.1007/s11 538–013–9844–3.
- Flegg et al. (2012) Flegg, M., Chapman, J. & Erban, R. 2012 The two-regime method for optimizing stochastic reaction-diffusion simulations. Journal of the Royal Society Interface, 9(70), 859–868.
- Flegg et al. (2013) Flegg, M., Rüdiger, S. & Erban, R. 2013 Diffusive spatio-temporal noise in a first-passage time model for intracellular calcium release. Journal of Chemical Physics, 138, 154 103.
- Franz et al. (2013) Franz, B., Flegg, M., Chapman, J. & Erban, R. 2013 Multiscale reaction-diffusion algorithms: PDE-assisted Brownian dynamics. SIAM Journal on Applied Mathematics, 73(3), 1224–1247.
- Hagan et al. (1989) Hagan, P., Doering, C. & Levermore, C. 1989 Mean exit times for particles driven by weakly colored noise. SIAM Journal on Applied Mathematics, 49(5), 1480–1513.
- Holley (1971) Holley, R. 1971 The motion of a heavy particle in an infinite one dimensional gas of hard spheres. Zeitschrift fr̈ Wahrscheinlichkeitstheorie und verwandte Gebiete, 17, 181–219.
- Huggins (2012) Huggins, D. 2012 Correlations in liquid water for the TIP3P-Ewald, TIP4P-2005, TIP5P-Ewald, and SWM4-NDP models. Journal of Chemical Physics, 136(6), 064 518.
- Lipkova et al. (2011) Lipkova, J., Zygalakis, K., Chapman, J. & Erban, R. 2011 Analysis of Brownian dynamics simulations of reversible bimolecular reactions. SIAM Journal on Applied Mathematics, 71(3), 714–730.
- Lipkow et al. (2005) Lipkow, K., Andrews, S. & Bray, D. 2005 Simulated diffusion of phosphorylated CheY through the cytoplasm of Escherichia coli. Journal of Bacteriology, 187(1), 45–53.
- Mark & Nilsson (2001) Mark, P. & Nilsson, L. 2001 Structure and dynamics of the TIP3P, SPC, and SPC/E water models at 298 K. Journal of Physical Chemistry A, 105(43), 9954–9960.
- Merz (2010) Merz, K. 2010 Limits of free energy computation for protein-ligand interactions. Journal of Chemical Theory and Computation, 6, 1769–1776.
- Opplestrup et al. (2009) Opplestrup, T., Bulatov, V., Donev, A., Kalos, M., Gilmer, G. & Sadigh, B. 2009 First-passage kinetic Monte Carlo method. Physical Review E, 80(6), 066 701.
- Rahman & Stillinger (1971) Rahman, F. & Stillinger, F. 1971 Molecular dynamics study of liquid water. Journal of Chemical Physics, 55(7), 3336–3359.
- Robert (1995) Robert, C. 1995 Simulation of truncated normal variables. Statistics and Computing, 5(2), 121–125.
- Smoluchowski (1917) Smoluchowski, M. 1917 Versuch einer mathematischen Theorie der Koagulationskinetik kolloider Lösungen. Zeitschrift für physikalische Chemie, 92, 129–168.
- Stiles & Bartol (2001) Stiles, J. & Bartol, T. 2001 Monte Carlo methods for simulating realistic synaptic microphysiology using MCell. In Computational neuroscience: Realistic modeling for experimentalists (ed. E. Schutter), pp. 87–127. CRC Press.
- Takahashi et al. (2010) Takahashi, K., Tanase-Nicola, S. & ten Wolde, P. 2010 Spatio-temporal correlations can drastically change the response of a mapk pathway. PNAS, 107, 19 820–19 825.
- van Zon & ten Wolde (2005) van Zon, J. & ten Wolde, P. 2005 Green’s-function reaction dynamics: a particle-based approach for simulating biochemical networks in time and space. Journal of Chemical Physics, 123, 234 910.
- Vilaseca et al. (2013) Vilaseca, P., Dawson, K. & Franzese, G. 2013 Understanding and modulating the competitive surface-adsorption of proteins through coarse-grained molecular dynamics simulations. Soft Matter, 9, 6978–6985.