Multiple soft-mode vibrations of lead zirconate
Abstract
Polarized Raman, IR and time-domain THz spectroscopy of orthorhombic lead zirconate single crystals yielded a comprehensive picture of temperature-dependent quasiharmonic frequencies of its low-frequency phonon modes. It is argued that these modes primarily involve vibration of Pb and/or oxygen octahedra librations and their relation to particular phonon modes of the parent cubic phase is proposed. Counts of the observed IR and Raman active modes belonging to distinct irreducible representations agree quite well with group-theory predictions. The most remarkable finding is the considerably enhanced frequency renormalization of the -polarized polar modes, resulting in a pronounced low temperature dielectric anisotropy. Results are discussed in terms of contemporary phenomenological theory of antiferroelectricity.
pacs:
77.80.-e, 63.20.D-, 77.80.Bh, 77.84.CgAlthough the ferroelectric and antiferroelectric materials have a lot in common, the latter have been much less investigated. An obvious reason is the absence of the direct linear coupling of the antiferroelectric (AF) order parameter to the macroscopic electric field.
At the same time, a nonlinear coupling to the macroscopic electric field is still present. Therefore, AF materials actually do provide interesting functionalities, as well. In fact, the AF oxides are promising materials for high-energy storage capacitors, high-strain actuators and perhaps even for electrocaloric refrigeratorsRabe13 ; LiuH11 ; Misc06 . The interest in the improvement of our understanding of AF oxides has been expressed recentlyRabe13 ; Taga13 ; LiuH11 ; Reye13 .

Lead zirconate, PbZrO3, is the best known example of an AF oxide - it is an end-member of technologically relevant solid solutions with PbTiO3 (piezoelectric PZT s)Taga13 ; Rabe13 ; LiuH11 ; Lines ; Shir50 ; Bhal00 . The parent paraelectric phase is a simple cubic perovskite with a 5-atom unit cell (, Z=1). Below the AF phase transition ( K), it goes over into an orthorhombic (Z=8) structureFuji84 ; Coch68 . The space-group symmetry change can be well understoodRabe13 as a result of the condensation of two order parametersFuji68 ; Rabe13 ; Taga13 ; Wagh97 . One of them is a polarization wave of a propagation vector , the other order parameter is a oxygen octahedra tilt mode (here pc stands for pseudocubic lattice, see Figs. 1-2).
Superpositions of , include also and cubic-phase Brillouin zone points. All of these points become Brillouin zone centers in the phase (see Fig. 2). Nevertheless, recent inelastic X-ray scattering experimentsTaga13 have clearly demonstrated that the critical scattering occurs only in the vicinity of the -point. Based on this experimental result, it was proposed that the AF phase transition is driven by a single mode, the -point ferroelectric soft modeTaga13 . Within this model, the condensation of the -point mode can be ascribed to the flexoelectric coupling with the ferroelectric mode, and the condensation of the -point mode can be explained as due to a biquadratic coupling with the mode (i.e. through the HolakovskyHola73 triggering mechanism)Taga13 .

It should be noted, however, that the earlier spectroscopic studiesDoba01 ; Role89 ; Osta01 indicated the existence of additional lattice modes with temperature dependent frequencies. The principal aim of this work is to provide a systematic overview of the temperature dependence of the low frequency phonon modes of the AF PbZrO3 by means of polarized IR and Raman spectroscopic study of single domain specimens. The results obtained testify the existence of multiple soft modes of different symmetry in orthorhombic PbZrO3. Consequently, the simple scenario with a single driving lattice mode as proposed in Ref. Taga13, has to be modified.
Before discussing the novel experimental results, let us note that the state-of-art density functional theory calculations have clearly demonstrated that the parent cubic structure of PbZrO3 is unstable at low temperatures with respect to the Pb ion off-centering as well as concerted oxygen octahedra tiltsGhos99 ; Reye13 ; Wagh97 ; Cock00 ; Leun02 ; Leun03 . These calculations show a system of unstable branches, dominated by Pb-O vibration, and including and phonon modes, as well as a few unstable branches connecting the rigid-body oxygen-octahedra tilt modes and (throughout the paper, we are using the labels of Ref. Ghos99, .)
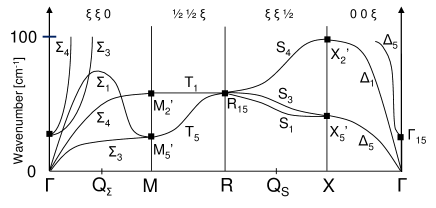
The PbZrO3 phonon dispersions curves have not yet been determined experimentally. Nevertheless, since the cubic-phase properties of PbTiO3-PbZrO3 solid solutions (PZT) are expected to vary smoothly with the PbTiO3 concentration, the cubic-phase phonon frequencies of Pb-dominated modes can be estimated from the previous inelastic neutron and X-ray scattering studies of PbTiO3 and PZT. For example, the frequencies of the and Pb-dominated modes can be extrapolated from the measurements of the PbTiO3Shir70 ; Tome12 ; Kemp06 and the PZT single crystalsHlin11 ; the acoustic mode dispersion can be estimated from PbZrO3 measurements of Refs. Taga13, ; KoJH13, , and the zone-center mode frequency can be estimated from the dielectric measurementsOsta01 ; Taga13 ; Buix11 . The lowest frequency phonon dispersion curves of the cubic PbZrO3 obtained in this way (near the phase transition point) are traced in Fig. 3. Let us note that almost all the estimated Pb-dominated mode frequencies fall below about 100 cm-1, while those of and oxygen octahedra tilt modes (not shown in Fig 3.) are expected to lie above 100 cm-1.
The cubic-orthorhombic transition is of the first order, but the PbZrO3 orthorhombic structure can be well understood as due to a small structural distortion of the cubic one. Thus, in the limit of the vanishing distortion, the -point modes of the orthorhombic structure transform also as or -point modes of the parent cubic phase. Correlation between irreducible representation of the actual and parent symmetry group for the Pb ion vibration modes is shown in Table I. In fact, irreducible representations listed in Table I match well those realized in Fig. 3. Therefore, about 24 optic Pb ion modes are expected in the AF phase within the cm-1 frequency range.
| Ag | B1g | B2g | B3g | Au | B1u | B2u | B3u | |
| X | X | X | X | |||||
| M | M | M | M | |||||
| R | R15 | R15 | R15 | |||||
| S | S3 | S1 | S4 | S4 | S3 | S1 | ||
| sum | 4 | 4 | 2 | 2 | (2) | 2 | 4 | 4 |
The flux-grown single crystal platelets used in the present experiments, with either out-of-plane or in-plane -axisDec89 , were detwinned using the method of Ref. Dec89, . Raman data were collected using a Renishaw microscope spectrometer operated with a 514 nm laser and a low-frequency edge filter, like e.g. in Refs. Raman1, ; Raman2, . IR reflectivity and time-domain THz transmission data were collected using a Fourier-transform Bruker spectrometer and a laboratory built system based on Ti-Sapphire laser, respectively, and then fitted simultaneously to obtain the consistent complex dielectric and conductivity spectra in the 10-800 cm-1 range (the same setup and experimental procedure as e.g. in Refs. Hlin08, ; DielExp, ).
The typical low-frequency, low-temperature Raman spectra are shown in Fig. 4. As indicated in the figure, the light was polarized along the crystallographic axes so that the assignment of the observed modes to the relevant irreducible representations was rather straightforward (unlike in Ref. Role89 ). Similarly, the real part of the conductivity spectra allows probing the , and modes independently (see Fig. 5.). Overall, the numbers of the modes observed in the cm-1 frequency range corresponds quite well to the list given in Table I.


Phonon frequencies up to about 150 cm-1 (from fits using damped harmonic oscillator response functions) as a function of temperature are shown in Fig. 6. The lowest frequency and modes can be assigned to the and acoustic modes folded from . All other modes of Fig. 6 reveal a considerable frequency increase upon cooling (both the modes in the 0-100 cm-1 range as well as the modes in the 100-150 cm-1 frequency range).
How can this be understood? The temperature dependence of the fully symmetric mode (), corresponding to the order parameter, follows naturally from the simplest Landau-type theory. The temperature dependence of the , and components of the Last-type mode could be explained e.g. by a positive biquadratic coupling to the primary order parameterTaga13 . What is the reason for the strikingly similar temperature dependence of so many other phonon frequencies below 100 cm-1? Our understanding is that PbZrO3 has a soft-branch driven phase transition, rather than a soft-mode one. In other words, the observations (i) indicate a small dispersion of Pb-based phonon branches, and (ii) suggest that the stabilizing anharmonic potential has a dominantly local character, as assumed in simple effective Hamiltonian modelsWagh97 ; Cock00 , so that it makes both the and branches temperature dependent. Soft phonon branches are known e.g. from incommensurate dielectricsHlinkaBCCD ; MatoK2SeO4 . As a matter of fact, soft polarization branches ensure a simultaneous instability with respect to both the homogeneous and the staggered polarization, and this seems to be the essential prerequisite of an AF materialDvorak ; Sama70 .
Obviously, among the modes of the same irreducible representation, the temperature dependence can be shared due to the mode mixing. In particular, modes listed within the same column in Table I. are coupled in the AF phase. For example, we have verified that the overall IR plasma frequencyHlin06 of all modes observed below 100 cm-1 is close to the IR plasma frequency of Last soft mode cm-1 determined from the analysis of the cubic phase spectraHlin06 . Since the bare and modes have the symmetry but no intrinsic IR strength, the relative integral intensities of the modes observed in the conductivity spectrum below 100 cm-1 (Fig. 5) can be directly interpreted as a measure of their eigenvector exchange with the pure Last mode.Hlin06 This mixing is visibly quite considerable.

Are the observed temperature variations of phonon frequencies large or small ? Within the Landau theory of the second-order structural phase transition, the squared soft-phonon frequency shows a linear temperature dependence (Cochran law). A stronger, nonlinear temperature dependence is expected below a first-order phase transition point, but the relation of the inverse static permittivity to the soft-mode frequency via Lyddane-Sachs-Teller relation should be still valid. In order to estimate the expected soft-mode frequency, we have thus multiplied the inverse of the static limit of the fitted permittivity by the square of the mode plasma frequency of the Last mode ( cm-1), and traced the resulting temperature dependence of the squared bare Last mode frequency (, ) in the panel (h) of Fig. 6. As it is clear from Fig. 6, such bare mode frequencies show very similar temperature dependence as most of the polar and nonpolar mode frequencies directly measured below 100 cm-1.
Let us stress that the , and Raman spectra show additional soft modes, with frequencies above of 100 cm-1, and an even stronger temperature dependence (Fig. 6). These modes correspond well to the soft mode reported in Refs. Role89 ; Doba01 . It is natural to ascribe them to descendants of the rigid oxygen octahedra tilt mode, known as the soft mode of the structural phase transition of SrTiO3 crystalCowl . Indeed, the mode components associated with oxygen octahedra tilts around the and orthorhombic axes do transform precisely as the , and irreducible representations. A recent IXS study concluded that mode plays only a passive role of a triggered modeTaga13 , since its frequency shows virtually no temperature dependence in the cubic phase. However, the mode investigated there had a frequency of about 50 cm-1 only, and according to our analysis, it was the Pb ion vibration of symmetry. On the contrary, the present results indicate that the actual oxygen octahedra tilt mode should have a frequency of about 100-150 cm-1 in the cubic phase.
Finally, panel (h) of Fig. 6 reveals a remarkable anisotropy of the low-frequency permittivity in the AF phase. Within the theory of Ref. Taga13, , the Curie-Weiss law for the AF phase was derived from free-energy terms , , where , are components of the macroscopic polarization, is the order parameter (staggered polarization) and and are positive coupling constants. The same terms determine also the magnitudes of AF coercive fieldsTaga13 . The anisotropy shown in panel (h) of Fig. 6 suggests either that or that there is some other reason for preferential suppression of the .
In summary, this polarized Raman, IR and THz spectroscopic study of AF PbZrO3 single crystals established that there are several low frequency modes with anomalously temperature dependent phonon frequencies distributed among all seven active irreducible representations. We conclude that the modes around 130 cm-1 are associated with oxygen octahedra tilt vibrations, while those below about 100 cm-1 are due to the Pb ion fluctuations. Softening of the latter can be understood as a consequence of a soft and flat phonon branch, without having to recall specific biquadratic couplings for each such mode separately. We argue that, in general, such soft and flat polarization fluctuation branches are expected to occur in AF materials. We have also found that the low temperature dielectric tensor of PbZrO3 is highly anisotropic and that this anisotropy originates from the anisotropic hardening of the Last mode components. We hope that the present systematic survey of low-frequency phonon modes will help in understanding and modeling of finite-temperature properties of PbZrO3 and other antiferroelectric oxides.
I acknowledgments
Authors are indebted to J. Petzelt for critical reading of the manuscript. This work was supported by the Czech Science Foundation (Project GACR 13-15110S).
References
- (1) K. M. Rabe, in Functional Metal Oxides: New Science and Novel Applications, edited by Satish Ogale and V. Venkateshan (Wiley, Hoboken, NJ, 2013).
- (2) H. Liu and B. Dkhil, Z. Kristallogr. 226, 163 (2011).
- (3) A. S. Mischenko, Q. Zhang, J. F. Scott, R. W. Whatmore, and N. D. Mathur, Science 311, 1270 (2006).
- (4) A. K. Tagantsev, K. Vaideeswaran, S. B. Vakhrushev, A. V. Filimonov, R. G. Burkovsky, A. Shaganov, D. Andronikova, A. I. Rudskoy, A. Q. R. Baron, H. Uchiyama, D. Chernyshov, A. Bosak, Z. Ujma, K. Roleder, A. Majchrowski, J.-H. Ko and N. Setter, Nature communications 4 2229 (2013).
- (5) S.E. Reyes-Lillo and K. M. Rabe, Phys. Rev. B 88, 180102 (2013).
- (6) M. E. Lines, A. M. Glass, Principles and Applications of Ferroelectrics and Related Materials (Oxford University Press, 1977).
- (7) G. Shirane, E. Sawaguchi, and A. Takeda, Phys. Rev. 80, 482 (1950).
- (8) A.S. Bhala, R. Guo, and R.Roy, Mat. Res. Innovat. 4, 3 (2000).
- (9) H. Fujishita and S. Hoshino, J. Phys. Soc. Jpn. 53, 273 (1968).
- (10) W. Cochran and A. Zia, Phys. Stat. Sol. 25, 273 (1968).
- (11) H. Fujishita and S. Hoshino, J. Phys. Soc. Jpn. 53, 226 (1984).
- (12) U. V. Waghmare and K. M. Rabe, Ferroelectrics 194, 135 (1997).
- (13) J. Holakovsky, Phys. Stat. Sol. (b) 56, 615 (1973).
- (14) P. S. Dobal, R. S. Katiyar, S. S. N. Bharadwaja, and S. B. Krupanidhi, Appl. Phys. Lett. 78, 1730 (2001).
- (15) K. Roleder, G. E. Kugel, M. D. Fontana, J. Handerek, S. Lahlou, and C. Carabatos-Nedelec, J. Phys.: Condens. Matter 1, 2257 (1989).
- (16) T. Ostapchuk, J. Petzelt, V. Zelezny, S. Kamba, V. Bovtun, V. Porokhonskyy, A. Pashkin, P. Kuzel, M. D. Glinchuk, I. P. Bykov, B. Gorshunov, and M. Dressel, J. Phys. Cond. Matter. 13, 2677 (2001).
- (17) Ph. Ghosez, E. Cockayne, U. V. Waghmare, and K. M. Rabe, Phys. Rev. B 60, 836 (1999).
- (18) E. Cockayne and K. M. Rabe, J. Phys. Chem. Solids 61, 305 (2000).
- (19) K. Leung, E. Cockayne, and A.F. Wright, Phys. Rev. B 65, 214111 (2002).
- (20) K. Leung, Phys. Rev. B 67, 104108 (2003).
- (21) G. Shirane, J. D. Axe, J. Harada, and J. P. Remeika, Phys. Rev. B 2, 155 (1970).
- (22) I. Tomeno, J. A. Fernandez-Baca, K. J. Marty, K. Oka, and Y. Tsunoda, Phys. Rev. B 86, 134306 (2012).
- (23) M. Kempa, J. Hlinka, J. Kulda, P. Bourges, A. Kania, and J. Petzelt, Phase Transitions 79, 351 (2006).
- (24) J. Hlinka, P. Ondrejkovic, M. Kempa, E. Borissenko, M. Krisch, X. Long, and Z.-G. Ye, Phys. Rev. B 83, 140101 (2011).
- (25) R. A. Cowley, Phys. Rev. 134, A981 (1964).
- (26) J.-H. Ko, M. Górny, A. Majchrowski, K. Roleder, and A. Bussmann-Holder, Phys. Rev. B 87, 184110 (2013).
- (27) E. Buixaderas, D. Nuzhnyy, J. Petzelt, L. Jin, and D. Damjanovic, Phys. Rev. B 84, 184302 (2011).
- (28) J. Dec and J. Kwapulinski, J. Phys. Condens. Matter 1, 3389 (1989).
- (29) J. Hlinka, I. Gregora, J. Pokorny, C. Hérold, N. Emery, J. F. Mareché, and P. Lagrange, Phys. Rev. B 76, 144512 (2007).
- (30) F. Borodavka, I. Gregora, A. Bartasyte, S. Margueron, V. Plausinaitiene, A. Abrutis, and J. Hlinka, J. Appl. Phys. 113, 187216 (2013).
- (31) J. Hlinka, T. Ostapchuk, D. Nuzhnyy, J. Petzelt, P. Kuzel, C. Kadlec, P. Vanek, I. Ponomareva, and L. Bellaiche, Phys. Rev. Lett. 101, 167402 (2008).
- (32) D. Nuzhnyy, J. Petzelt, M. Savinov, T. Ostapchuk, V. Bovtun, M. Kempa, J. Hlinka, V. Buscaglia, M.T. Buscaglia, and P. Nanni, Phys. Rev. B 86, 014106 (2012).
- (33) J. Hlinka, M. Quilichini, R. Currat, and J.-F. Legrand, J. Phys.: Condens. Matter 8, 8207 (1996); 8, 8221 (1996).
- (34) I. Etxebarria, M. Quilichini, J.M. Perez-Mato, P. Boutrouille, F.J. Zuniga, and T. Breczewski, J. Phys. Condens. Matter 4, 8551 (1992).
- (35) V. Dvorak, Phys. Status Solidi 14, K161 (1966).
- (36) G. A. Samara, Phys. Rev. B 1, 3777 (1970).
- (37) J. Hlinka, J. Petzelt, S. Kamba, D. Noujni, and T. Ostapchuk, Phase Transit. 79, 41 (2006).