Mapping the large scale structure around a z=1.46 galaxy cluster in 3-D using two adjacent narrow-band filters
Abstract
We present a novel method to estimate accurate redshifts of star-forming galaxies by measuring the flux ratio of the same emission line observed through two adjacent narrow-band filters. We apply this method to our NB912 and new NB921 data taken with Suprime-Cam on the Subaru Telescope of a galaxy cluster, XMMXCS J2215.9-1738, at and its surrounding structures. We obtain redshifts for 170 [O II] emission line galaxies at , among which 41 galaxies are spectroscopically confirmed with MOIRCS and FMOS on the Subaru mainly, showing an accuracy of . This allows us to reveal filamentary structures that penetrate towards the centre of the galaxy cluster and intersect with other structures, consistent with the picture of hierarchical cluster formation. We also find that the projected celestial distribution does not precisely trace the real distribution of galaxies, indicating the importance of the three dimensional view of structures to properly identify and quantify galaxy environments. We investigate the environmental dependence of galaxy properties with local density, confirming that the median colour of galaxies becomes redder in higher density region while the star-formation rate of star-forming galaxies does not depend strongly on local environment in this structure. This implies that the star-forming activity in galaxies is truncated on a relatively short time scale in the cluster centre.
keywords:
galaxies: clusters: general – galaxies: evolution.1 Introduction
Galaxies are distributed inhomogeneously on small scales in the Universe and thus define large-scale structures which consist of dense regions of galaxies such as galaxy clusters, sparse regions called voids, and filamentary structures which connect the dense regions, as revealed by large spectroscopic surveys such as Sloan Digital Sky Survey (SDSS, York et al., 2000) and 2 degree Field Galaxy Redshift Survey (2dFGRS, Colless et al., 2001). Galaxy clusters embedded in the large-scale structures are some of the densest systems in the Universe and occur at intersections of the galaxy filaments. While the spatial distribution of galaxies has been revealed in detail in the local Universe, the process by which the galaxy clusters form is yet to be understood in detail.
Galaxy clusters are considered to originate from the clustering of some young galaxies (i.e., proto-cluster) in the early Universe and to gradually grow into more massive gravitationally bound systems with time while accreting galaxies from the surrounding regions. The standard cold dark matter (CDM) scenario can reproduce well the picture seen in the Universe within the framework of the hierarchical formation of galaxy structures (e.g., Springel et al., 2005). Observational studies through wide-field imaging surveys of distant clusters at have also supported the hierarchical formation by finding large-scale structures around galaxy clusters (e.g., Kodama et al., 2005; Gal et al., 2008; Tanaka et al., 2009; Koyama et al., 2010). Now, the discovery of large-scale structures around galaxy clusters and proto-clusters is being extended to (e.g., Tanaka et al., 2011; Tadaki et al., 2012; Hayashi et al., 2012; Koyama et al., 2013; Erb et al., 2011; Yamada et al., 2012; Galametz et al., 2013; Henry et al., 2014). One interesting finding suggested by such observational studies is that cluster galaxies seem to follow an inside-out evolution in the sense that the environment where galaxies are active shifts from the densest regions at high redshifts ( 2–3) towards less dense regions at lower redshifts (). Star forming activity increases rapidly in the denser regions and becomes comparable to the surrounding lower density regions at higher redshifts, which implies that galaxy formation is biased towards higher density regions at high redshift (Kodama et al., 2013, and references therein). However, it is also known that the environmental dependences of galaxy properties seen at are already in place at (e.g., Holden et al., 2007; van der Wel et al., 2007; Patel et al., 2009, 2011; Sobral et al., 2011).
The next step to understand the evolution of cluster galaxies is to determine precisely how galaxies change their properties as a result of the hierarchical growth of large-scale structures. However, the difficulty is the need for accurate determination of the redshift to determine the precise environment of the galaxies. Although photometric redshifts estimated by fitting template spectral energy distributions (SEDs) to the multi-wavelength photometry of galaxies is quite effective, the uncertainty becomes large at higher redshifts. Moreover, the number density of blue star-forming galaxies with less prominent features in the SED exceeds that of red quiescent galaxies which have strong breaks in their SED at 1.0–1.5 (e.g., Brammer et al., 2011; Moustakas et al., 2013; Muzzin et al., 2013; Tomczak et al., 2013). An effective way to solve the issue is by carrying out the imaging with narrowband filters targeting nebular emission from HII regions of star-forming galaxies. The narrowband imaging enables a largely unbiased sampling of star-forming galaxies down to a limiting star-formation rate of galaxy and the redshift of galaxies selected are determined with the accuracy of . However, this is too uncertain to accurately define the environment of galaxies as this redshift range corresponds to a co-moving depth of 56 Mpc at . We thus demonstrate a novel technique to circumvent this problem.
The galaxy cluster XMMXCS J2215.9-1738 (hereafter XCS2215) at is one of the most distant massive clusters known (Stanford et al., 2006). Extended X-ray emission from hot gas bound in the cluster suggests that it is already a mature system. However, previous studies have revealed that this galaxy cluster is still growing actively (Hayashi et al., 2010, 2011). We discovered a high fraction of galaxies undergoing active star formation in the core of the cluster and the existence of large scale structures of star-forming galaxies around the cluster. The finding means that this galaxy cluster is a good target to investigate the processes operating on galaxies assembling into the centre of the cluster from the outskirts. However, our current understanding is based on a view of the large scale structures projected on the celestial plane. We require to know the true three dimensional structures to reveal in detail the processes playing a critical role in formation of characteristic properties of cluster galaxies, because the projected distribution of galaxies may not reflect the real structures. The results found without the three dimensional structures can be led to wrong conclusions. Thus, in this paper, we aim to define the three dimensional structures around the XCS2215 cluster at .
The outline of this paper is as follows. The observations and data are described in § 2, and samples of emission line galaxies identified with three different narrowband filters are presented in § 3. A new method to estimate the accurate redshifts with two adjacent narrowband filters is introduced in § 4, which allows us to reveal the three dimensional view of the filamentary large-scale structures around the galaxy cluster in § 5. Then, we compare [O II] emission line galaxies with H emission line galaxies associated with these structures. We also discuss the dependence of galaxy properties on the environment defined by the three dimensional distribution of the galaxies. Finally, we present the conclusions of this paper in § 6. Throughout this paper, magnitudes are presented in the AB system. However, Vega magnitudes in and , if preferred, can be obtained from our AB magnitudes using the relations: = and = , respectively. We adopt cosmological parameters of , and . In = 1.46, 1 arcmin corresponds to 1.25 Mpc (co-moving) and 0.51 Mpc (physical), respectively.
2 Observations and Data
2.1 Narrowband filters targeting nebular emission lines at =1.46
We used two narrowband filters which are adjacent filters and both can detect [O II] emission at . These are the NB912 and NB921 narrowband filters installed on the Subaru Prime Focus Camera (Suprime-Cam; Miyazaki et al., 2002) on the Subaru Telescope. The central wavelength and full width half maximum (FWHM) of the NB912 (NB921) filters are 9139 (9196)Å and 134(132)Å, which implies a velocity difference of km s-1 for galaxies at (Figure 1). The specifications of the two narrow-band filters are shown in Table 1. Our analysis also makes use of a third filter: the NBH narrowband filter installed on the Wide Field Camera (WFCAM; Casali et al., 2007) on the the United Kingdom Infrared Telescope (UKIRT). This filter was made for the High Redshift Emission Line Survey (HiZELS) which is a narrowband imaging survey aiming to detect H emission from galaxies at 0.4, 0.8, 1.5, and 2.2 with WFCAM on the UKIRT (Geach et al., 2008; Sobral et al., 2009; Sobral et al., 2012, 2013; Best et al., 2010), and can detect H emission at with the central wavelength and FWHM of response curve being 1.617µm and 0.0211µm. As shown in Figure 1, the response curves of the NB921 and NBH filters are well matched in redshift space corresponding to [O II] or H emission lines at (Sobral et al., 2012; Hayashi et al., 2013), while the NB912 filter is suitable to select [O II] emitters slightly in the foreground.
| Filter | Telescope | Emitter | NB912+NB921 [O II] | Limiting SFR‡ | ||||
| [µm] | [µm] | Line | Number | Number | Spec. confirmed† | [M⊙/yr] | ||
| NB912 | 0.9139 | 0.0134 | Subaru | [O II] | 380 | 170 | 41 | 2.6 |
| NB921 | 0.9196 | 0.0132 | Subaru | [O II] | 429 | 2.2 | ||
| NBH | 1.617 | 0.0211 | UKIRT | H | 9 | 1 | – | 14.6 |
| We spectroscopically confirmed 73 [O II] emitters in total; NB912+NB921=41, NB912=21, and NB921=11. | ||||||||
| The limiting SFRs are not corrected for dust extinction. | ||||||||

2.2 The NB921 data
The NB921 data were obtained with Suprime-Cam on the Subaru Telescope, which has a field-of-view (FoV) of 3427 arcmin2, corresponding to 42.533.8 Mpc2 in co-moving scale at , under the open-use programme in service-mode (S12A-131S, PI: M. Hayashi) on 2012 July 24. This enables us to cover from the central region to the outskirts of the cluster with a single pointing. We took 11 frames with individual exposure time of 20 minutes, which results in the total integration time of 220 minutes. The observations were conducted under photometric conditions. The seeing varied between 0.6 and 0.8 arcsec.
We used the data reduction package for Suprime-Cam (SDFRED2: Yagi et al., 2002; Ouchi et al., 2004) to reduce the data in the same way as for the other optical data (Hayashi et al., 2010, 2011). Note that we also used the software released by Yagi (2012) to correct for the crosstalk seen around bright stars in the Suprime-Cam image. The point spread function (PSF) is matched to 1.09 arcsec, which is the PSF of the other optical data (see § 2.4). The photometric zero-point is determined using the spectrophotometric standard star, Feige110. The 5 limiting magnitude measured within a 2″-diameter aperture is 25.4 comparable to the depth of 25.2 in the existing NB912 data (see § 2.4).
2.3 The NBH and H data from HiZELS
As a part of HiZELS, we conducted the NBH narrowband imaging in the galaxy cluster. WFCAM consists of four 20482048 HgCdTe detectors with a pixel scale of 0.4″, and each detector covers a 13.65′13.65′ region. However, the detectors are spaced with a gap of 12.83′. Thus, we observed the galaxy cluster in NBH and -bands by pointing one of the detector at the centre of cluster, resulting in the central 13.65′13.65′ images being available in both bands. Note that the broadband image is required to estimate the continuum flux density underneath the H emission line.
Data reduction was conducted in the standard procedure with the pipeline for HiZELS (PfHiZELS: Geach et al., 2008; Sobral et al., 2009). The integration times are 256.7 and 49 minutes in NBH and , respectively. Since seeing sizes were 1.02 and 1.32 arcsec in NBH and , they are matched to 1.32 arcsec. The 5 limiting magnitudes are 21.61 in NBH and 22.28 in , which are measured with a 2.4″-diameter aperture.
2.4 The data set used for previous studies
Our previous studies in the galaxy cluster are already published in Hayashi et al. (2010, 2011) using six broadband images in and and the NB912 narrowband image. Thus, we briefly summarize these data here.
Deep, wide-field imaging data in optical were taken with Suprime-Cam on the Subaru Telescope. The PSFs in the optical images are all matched to 1.09 arcsec. The 5 limiting magnitudes are between 25.2 and 27.0 (Hayashi et al., 2011). The data set in the near-infrared consists of and -band images. -band data were taken with WFCAM on the UKIRT and overlap well with the optical images. However, -band images taken with Multi-Object Infrared Camera and Spectrograph (MOIRCS; Ichikawa et al., 2006; Suzuki et al., 2008) on the Subaru telescope are available in the central 6′6′ region only. PSFs in both and are also matched to 1.09 arcsec. The 5 limiting magnitudes are 23.2 and 22.7 in and , respectively, which are measured with a 2″-diameter aperture (Hayashi et al., 2011).
2.5 Photometric catalogue
In this section, we describe the two catalogues for NB921-detected and NBH-detected sources. The NB912-detected catalogue is fully described in Hayashi et al. (2010, 2011).
2.5.1 NB921-detected catalogue
A photometric catalogue for NB921-detected sources is made following Hayashi et al. (2010, 2011). We use SExtractor (ver. 2.8.6: Bertin & Arnouts, 1996) to detect sources on the NB921 image. Note that we use the NB921 image before the PSF matching (i.e. FWHM of 0.81″) for the source detection to take advantage of the better signal-to-noise ratio. Photometry is conducted on all the PSF-matched images by using SExtractor in dual-image mode. Colours are derived from the 2″-diameter aperture magnitudes, and mag_auto magnitudes are used as total magnitudes. The aperture size is determined so as to be about twice as large as the PSF. Magnitude errors are estimated from the 1 sky noise taking account of the difference in depth at each object position due to slightly different exposure times and sensitivities. Magnitudes are corrected for the Galactic absorption by the following magnitudes; A()=0.10, A()=0.06, A()=0.05, A()=0.04, A(NB921)=0.04, A()=0.02, and A()=0.01, which are derived from the extinction law of Cardelli et al. (1989) on the assumption of and estimated from Schlegel et al. (1998). The values for the correction are the same as used for the NB912-detected catalogue of Hayashi et al. (2011). To check the NB921 zero-point, we compare NB921 magnitudes with NB912 magnitudes for stellar sources. We find that there is a good agreement between both magnitudes, indicating the validity of zero-point of magnitude in NB921 image.
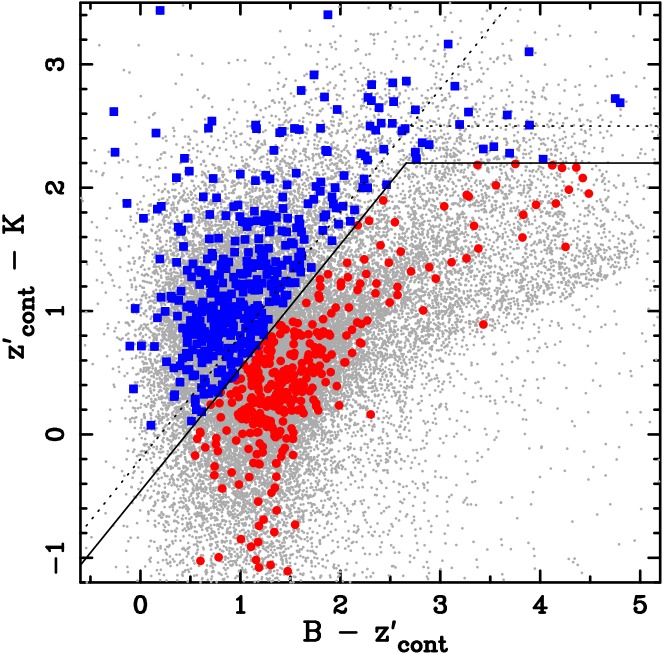
As a result, after rejecting objects in the regions masked due to the bad quality of the images, the catalogue contains 40,237 sources brighter than 25.44 mag in NB921 (5 limiting magnitude). Among them, 36,415 galaxies are distinguished from 3,822 stars based on and colours. This technique was devised by Daddi et al. (2004), and stars are actually well separated from galaxies on this colour-colour diagram ( vs. ) (Daddi et al., 2004; Kong et al., 2006).
2.5.2 NBH-detected catalogue
A catalogue for NBH-detected sources is made by following the steps described above. Since the PSF size of the NBH and images are larger than that of the others, this catalogue is used separately to select the NBH H emitters at in § 3. The NBH image with PSF of 1.02″ is used for source detection, and photometry is conducted on the PSF-matched images using the dual-image mode of SExtractor. The –NBH colour is obtained from 2.4″-diameter aperture magnitudes. Magnitudes are corrected for the Galactic absorption by A(NBH)=0.01 and A()=0.01. To compile the photometry for all of the data except and NBH, we cross-match the NBH-detected sources with those detected by NB912 or NB921. For almost all NBH-detected sources, counterparts are found in the NB912 or NB921 catalogues. We note that the NBH-detected sources for which no counterpart is found are cross-talk and false detection seen around bright stars. Thus, we remove them from the catalogue. As a result, the catalogue contains 1,324 sources brighter than 21.61 mag. in NBH (5 limiting magnitude).
|
|
|

|
2.6 Spectroscopic data
Hayashi et al. (2011) reported the confirmation of sixteen NB912 [O II] emitters in the central region of the galaxy cluster using MOIRCS on the Subaru Telescope. These data were useful for showing the validity of our selection of NB912 [O II] emitters. However, the spectroscopic confirmation was limited to [O II] emitters in the core region.
We have used the Fiber Multi Object Spectrograph (FMOS) on the Subaru Telescope to confirm the large scale structure of [O II] emitters we have discovered in Hayashi et al. (2011). It allows for multi-object spectroscopy in the and -bands with 400 fibers and a wide FoV of 30 arcmin. The FMOS spectroscopy was performed under an open-use program (S12A-084, PI: T. Kodama) during one and half nights of 2012 June 22–23. Unfortunately, due to the instrumental trouble, only the IRS2, i.e., one of the two spectrographs in FMOS, was available in our observation run. Therefore, only 50% of sources were targeted, resulting in sparse sampling of the targets. Targets are mainly selected from the sample of NB912 [O II] emitters shown in Hayashi et al. (2011). We targetted 78 galaxies in total, of which 56 are NB912 [O II] emitters. In this run, we used the high resolution H-long setting which covers the wavelength of 1.6–1.8µm with a spectral resolution of R=2000, enough to resolve H and [N II] emission lines, where present. We adopted the cross beam switching method, that is, half of the fibers available are allocated to the targets and at the same time the other half of them observe nearby regions of blank sky. The total integration time was 5.5 hours. Observations were conducted in photometric conditions. The seeing was 0.7–0.9 arcsec in -band, which was measured for the coordinate calibration stars (so-called CCS stars in the FMOS spine-to-object allocation software) near the centre of the FoV, implying that loss of flux escaping from the 1.2-arcsec diameter fibre should be small for unresolved objects.
We had another opportunity to observe the [O II] emitters with FMOS for about two hours on 2013 October 13 (S13B-106, PI: K.-I. Tadaki). The targets are selected from the samples of NB912 [O II] emitters and NB921 [O II] emitters described below. The same setup as for the previous observation was used in this run. However, only one spectrograph (IRS1) was available again. The total integration time was 1.5 hours on source. During the observations, the sky was almost clear and the seeing was 1.0 arcsec. Spectra were obtained for 65 [O II] emitters.
We used the FIBRE-pac data reduction package (Iwamuro et al., 2012) to reduce the FMOS data. FIBRE-pac corrects the flux for the loss from the fiber which is estimated using a calibration star. Although further correction may be required for extended sources like galaxies (Yabe et al., 2012; Stott et al., 2013), the redshift and ratio of emission line fluxes can be measured reliably even if the correction is not performed. We fitted three Gaussians to the spectra to measure H and the [N II] doublet and estimated the signal-to-noise ratio of emission lines seen in the spectra, and the redshift. In the Gaussian fitting, the width of the two Gaussians fitted to the [N II] doublet is fixed to the same value as H . In addition, the flux ratio of [N II] doublet is fixed to one-third. Errors on the emission line fluxes are estimated using the standard deviation of 500 measurements of the flux, where in each measurement a set of three Gaussians is fitted to the spectrum to which the error with normal distribution with 1 spectral noise is added. We regard H emission with flux greater than 3 as a detection, and then check the spectra judged to have a line detection, by visual inspection. We succeed in spectroscopically confirming 48 sources by detecting H emission at more than 3 in the whole region we surveyed, among which the number of the [O II] emitters is 41. Even if only a single emission line is detected in the spectrum, it can be identified as being H , because we have already detected [O II] emission with our narrowband imaging. The FMOS spectra demonstrate that our selection of NB912 and NB921 [O II] emitters is valid and that the structure we have found around the cluster is real.
We also have additional spectroscopic redshifts from the literature. Hilton et al. (2010) have spectroscopically confirmed 44 member galaxies in this cluster. We cross-identify the galaxies confirmed by our Subaru observations to the 44 member galaxies in Hilton et al. (2010), and seven galaxies turn out to be common objects. We checked that we do not find any disagreement in the redshifts of the common sources. Therefore, 101 galaxies are spectroscopically confirmed to be associated with the structure in and around the galaxy cluster. The redshift distribution of the confirmed galaxies is shown in Figure 1.
3 Selection of emission line galaxies
In this section, we select emission line galaxies using the photometric catalogues. We have already published the sample of [O II] emitters at based on the NB912 data (Hayashi et al., 2011). Since there is only a slight difference between NB912 and NB921 in the central wavelength of response curve, we can apply the same method for the selection of NB921 [O II] emitters as for NB912 [O II] emitters summarised below. We refer readers to Hayashi et al. (2011) for more details, if needed.
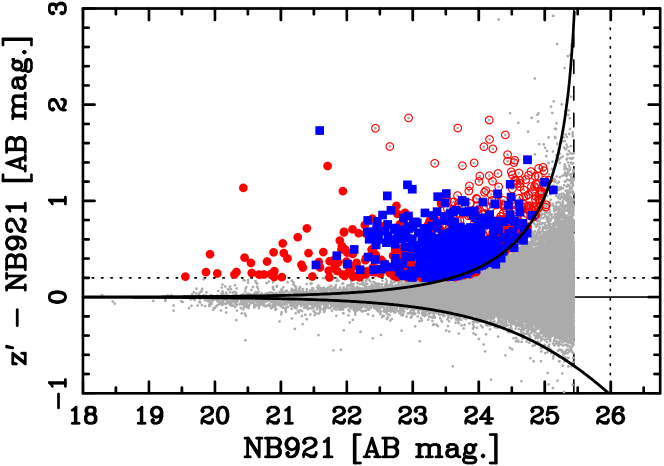
First, we select galaxies with colour excess in -NB921 at more than 3 (Figure 2). This corresponds to galaxies with a line flux larger than 1.210-17 erg s-1 cm-2 being selected. If the excess is due to the [O II] emission line at , the limiting flux corresponds to a dust-free SFR of 2.2 M⊙ yr-1 according to the [O II]–SFR calibration in Kennicutt (1998) where a Salpeter (1955) initial mass function (IMF) is assumed. To exclude the possible contamination of galaxies due mainly to photometric errors, additional criterion for the observed equivalent width (EW) larger than 35Å (i.e., 14Å in the rest-frame for [O II] at ) is applied. As a result, we select 1,135 NB921 emitters. Among them, 789 emitters are detected in at more than 2 level. In what follows, we deal with the -detected emitters, because we identify the [O II] emitters based on their and colours (Hayashi et al., 2011). With the criteria, we select 429 NB921 [O II] emitters in total (Figure 2). We note that the number of NB921 [O II] emitters is slightly larger than that of NB912 [O II] emitters even if the same limiting [O II] flux is adopted between the two samples. However, the numbers of [O II] emitters selected are in agreement within a 1 error based on Poisson statistics. The small difference can appear because of the structures and clustering of galaxies at slightly different redshifts.
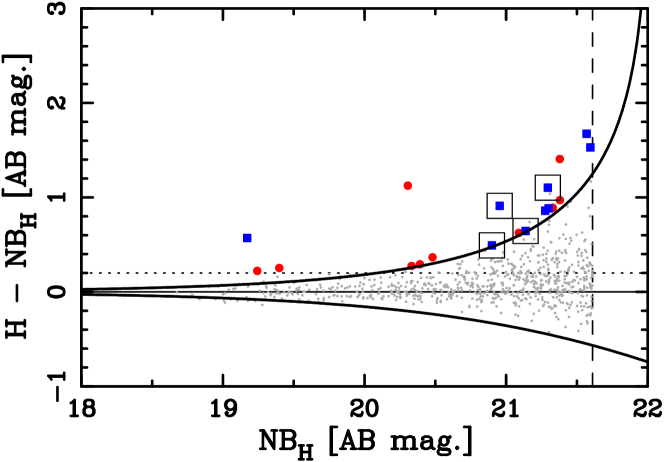
We can use the NBH and H images to select H emission line galaxies at . Again, galaxies with a colour excess in –NBH are selected, and then the same colour selection () is applied to identify H emitters among the 19 emission line candidates. The cut of 3 colour excess corresponds to galaxies with a line flux larger than 1.410-16 erg s-1 cm-2 being selected. If the excess is due to H at , the limiting flux corresponds to a dust-free SFR of 14.6 M⊙ yr-1 according to Kennicutt (1998). We also apply an observed EW cut larger than 50Å (i.e., 20Å in the rest-frame for H at ). Although Sobral et al. (2013) made a small correction to –NBH colours using colours to estimate the continuum level in the broadband more accurately, we find that –NBH colours are distributed around zero without any correction. Thus, no further correction is applied for the colour term and the method used for the selection is similar to that applied for the selection of [O II] emitters at . With their criteria, we select 9 H emitters in total (Figure 2).
Now, we have three samples of emission line galaxies at ; NB912 [O II] emitters, NB921 [O II] emitters, and NBH H emitters. Since they are all at similar redshifts, some emitters in the catalogues should overlap each other. First, we compare the catalogues between NB912 and NB921 [O II] emitters by searching for galaxies for which the difference in the coordinates are within 0.5 arcsec. Among 380 NB912 and 429 NB921 [O II] emitters, it is found that 170 galaxies are common in both samples. We also find that four NBH H emitters are in the [O II] emitter samples by using a circle with 1.0 arcsec radius to search for the common galaxies. Moreover, cross-matching with the spectroscopic data described in § 2.6, we spectroscopically confirm 41 NB912+NB921, 21 NB912, 11 NB921 [O II] emitters and two H emitters (see also Figure 1).
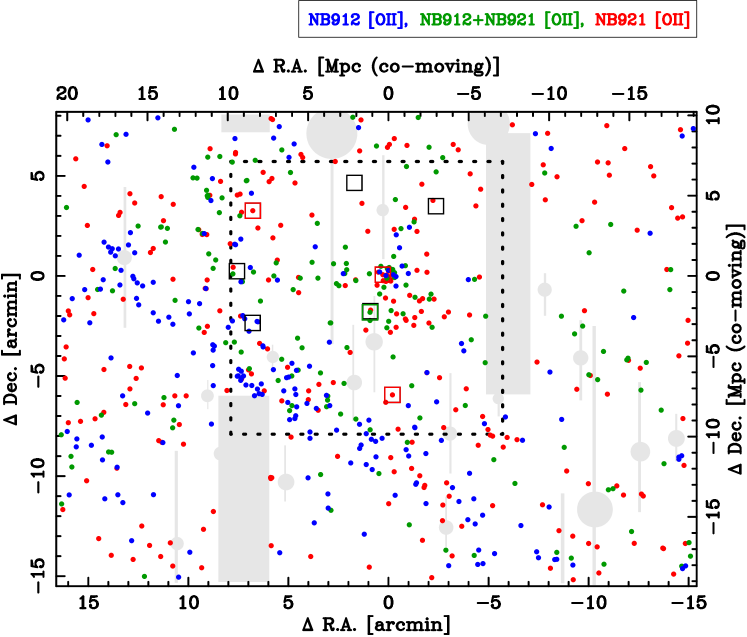
Figure 3 shows a celestial distribution of NB912 or NB921 [O II] emitters. It is worth mentioning that we can confirm again the clustering of [O II] emitters in the centre and the large-scale structure existing in the surrounding region which were already found in Hayashi et al. (2011), even when the NB921 data are used. More importantly, it seems that there is a slight difference in the distribution between NB912 and NB921 [O II] emitters, although about half of them overlap. The prominent filamentary structure that Hayashi et al. (2011) have discovered is likely to be slightly in the foreground, and the distribution of NB921 [O II] emitters seems to be spread along the southwestern direction from the cluster centre. As shown in Figure 1, the NB912 and NB921 can detect galaxies with a difference in velocity by 2000 km s-1. Thus, all of the differences suggest that there is a three dimensional structure around the galaxy cluster. A similar result has been reported at higher redshift as well. Shimasaku et al. (2004) used the samples of Lyman Emitters (LAEs) selected by two narrowband filters and found that the distribution of the galaxies are quite different at and 4.86. These observations demonstrate that revealing the three dimensional structure is crucial to improve our understanding, in particular in the early Universe when galaxies are active and the structures are growing. This implies the two dimensional celestial distribution could lead to errors in estimating the environment in which galaxies reside due to projection effects. This is investigated in the following sections using the two [O II] emitter samples.
Figure 3 also shows a celestial distribution of NBH H emitters. Unlike the [O II] emitters, H emitters are not clustered, but this is a likely consequence of the significantly shallow detection limit of H emission when compared to [O II]. However, it seems that the distribution of H emitters is consistent with tracing that of [O II] emitters.
4 Redshift measurements with two adjacent narrow-band filters
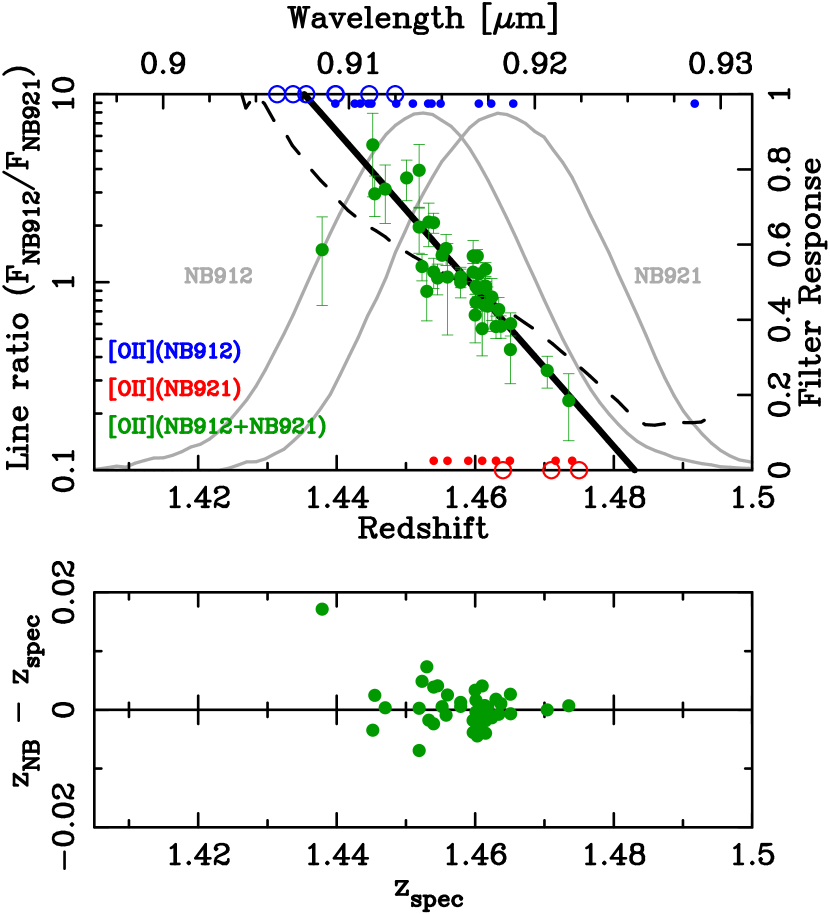
The two narrowband filters of NB912 and NB921 on Suprime-Cam are very close to each other (Figure 1). The overlap with a slight difference in the response curves allows us to estimate the redshift where the [O II] emitters are located between 1.42–1.49, based on the difference of emission line fluxes measured in the NB912 and NB921 images. This is because the narrowband filters are not perfect top-hats. That is, the flux measured by narrowband imaging for a galaxy with a given luminosity is dependent on its wavelength. For example, if a star-forming galaxy is at 1.44, it should be detected as a NB912 emitter but not detected as a NB921 emitter. On the other hand, if a star-forming galaxy is at 1.48, it should be detected as a NB921 emitter but not detected as a NB912 emitter. More interesting are star-forming galaxies detected with both NB912 and NB921 images. If the ratio of line flux measured with NB912 to that with NB921 is greater than unity, the galaxy is expected to be at , while if the ratio is smaller than unity the galaxy is likely to be at . Therefore, we can reveal the three-dimensional large scale structure in and around the XCS2215 galaxy cluster with these two filters.
Figure 4 shows that the expected ratio of NB912 to NB921-measured line flux is a monotonically decreasing function of redshift between and (shown by the broken line), demonstrating that we can estimate the redshift from the flux ratio measured with the two narrowband filters. We then make sure of the validity of the method using the [O II] emitters which have been spectroscopically confirmed. For NB912+NB921 [O II] emitters, it is clearly seen that the flux ratio is correlated with the spectroscopic redshift and the flux ratios measured are distributed around the values expected from the response function of the narrowband filters. However, a systematic difference between the actual line ratio and the expectation is seen when the redshift is far from . The discrepancy can be caused by inhomogeneity of response curve over the FoV and/or the difference between the actual response curve when installed on the Suprime-Cam and the measurement in a laboratory, although it is unlikely that the response curve of the two filters have large inhomogeneity. To correct for those effects, we fit a linear function to all of the data of NB912+NB921 [O II] emitters, and the fitted relation is shown by the solid line in Figure 4. Hereafter, we use this linear relation obtained from the fitting to estimate the redshift of [O II] emitters. Note that we removed the NB912+NB921 [O II] emitter at from the fitting since the deviation from the others is large, but even if the emitter is included, we make sure that the results shown below are not largely changed.
The [O II] emitters identified in only NB912 tend to have spectroscopic redshifts less than which corresponds to the redshift where the galaxy has the NB912/NB921 line ratio of unity, while those identified in only NB921 tend to have the redshift greater than . This is also what we expect. Indeed, the blue(red) open circles show the NB912(NB921) [O II] emitters for which the expected NB921(NB912) [O II] flux is smaller than the detection limit. This is the case for about a third of NB912 or NB921 [O II] emitters. Another third of [O II] emitters seem to have [O II] fluxes which in theory should be able to be detected in both narrowbands. However, the expected [O II] fluxes in the non-detection narrowband are close to the detection limit. Thus, the actual [O II] flux may be smaller than the limit due to the uncertainty of [O II] flux measured by the other narrowband. Finally, the remaining third of [O II] emitters should have a [O II] flux which is easily detected in both narrowbands, and yet are absent in one narrowband. Although the cause is unclear, the criteria of EW and significance of colour excess applied to select the emitters as well as the colour selection to identify the emission line can influence the detection of [O II] emission. Nevertheless, the redshift can be estimated from the line flux for about 70% of [O II] emitters detected by NB912 or NB921 narrowband filters, which adequately allows us to trace the three dimensional structure.
The redshift estimated from the line ratio measured by NB912 and NB921 filters, , is compared with the spectroscopic redshift, , for the NB912+NB921 [O II] emitters. We then calculate the difference of the two redshifts and find that (Figure 4). This suggests that the accuracy of the redshift, , is satisfactory, and despite only two narrowband datapoints being used, it is better than that of the photometric redshifts estimated from photometry with as many as 30-bands in the COSMOS field; at , at and , and at and (Ilbert et al., 2009). Thus, the line ratio measured with the adjacent narrowband filters can be a powerful estimator of redshift enabling us to map out well the three dimensional structure of star forming galaxies in the field surveyed without spectroscopy of all galaxies.
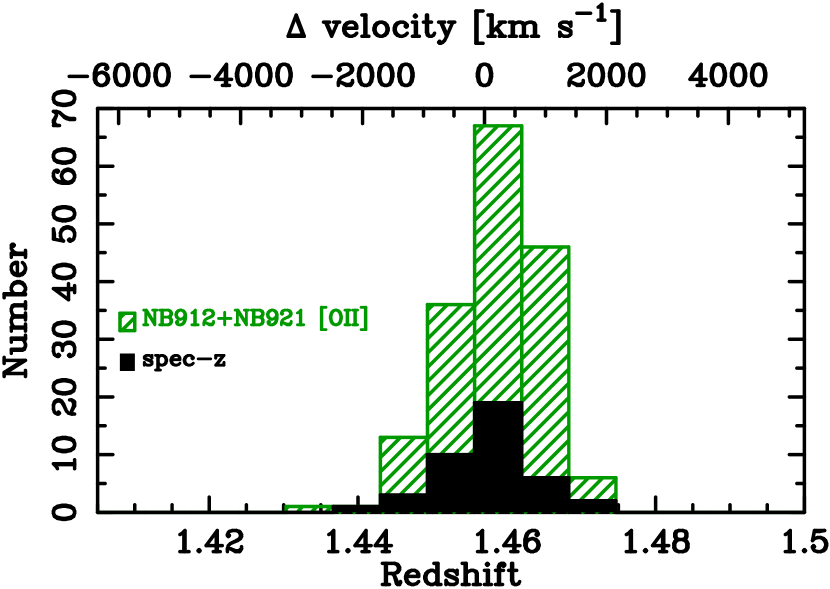
Figure 5 shows the distributions of the two redshift estimations; and . The histograms seem to be similar to each other. Indeed, the Kolmogorov-Smirnov (K-S) test indicates that they are likely to show the same distribution and the probability of their being based on the same populations is more than 70%. Thus, we conclude that we can use the line ratio to estimate the redshift of [O II] emitters and then investigate their three dimensional distribution in and around the galaxy cluster quite accurately.
5 Results
5.1 3-D structures around the XCS2215 cluster
|
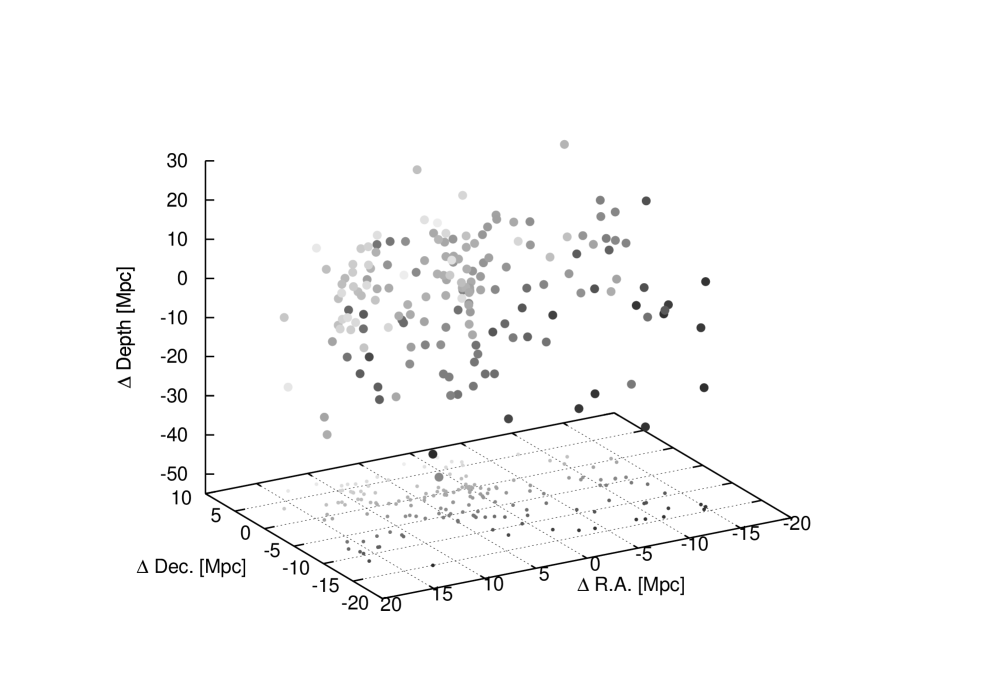
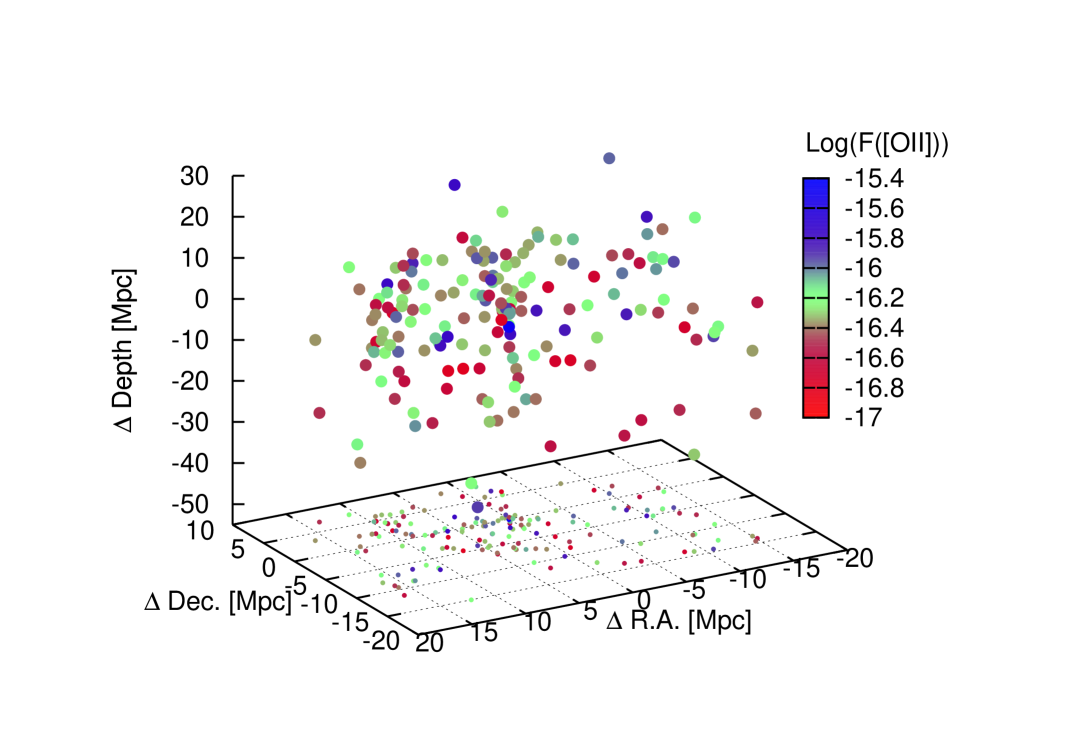
Figure 6 shows the three dimensional distribution of NB912+NB921 [O II] emitters. Although we have seen the filamentary structures in this field (Figure 3 and Hayashi et al. (2011)), the 3D view reveals that it is not an effect of projection but a real distribution and there are several new filamentary structures. It seems that some structures extend towards the centre of the galaxy cluster, and some intersect other structures. These structures cannot be fully understood without seeing the 3D distribution of galaxies as well as the projected celestial distribution. Galaxy clusters are considered to be formed at the intersection of filamentary structures and grow while assembling galaxies by the gravity of the system along the large-scale structures. The 3D structures we have found around the galaxy cluster is fully consistent with this picture. We should be witnessing the site where galaxies in the surrounding region are infalling towards the centre of galaxy cluster at when the vigorous evolution of galaxies occurred.
Since we use the redshift to draw the distribution of star-forming galaxies in three dimension, we should take care of the effect of peculiar motion which distorts that view. In particular, this effect could work significantly very near the cluster core and the structure in the redshift direction (i.e., depth) could seem to shrink relative to what it is. However, there is no doubt of the existence of the large scale structure, since the filamentary structures tend to spread widely in the direction parallel to the celestial plane.
Figure 6 resembles the structures seen in cosmological -body simulations based on the CDM model (e.g., Springel et al., 2005; Ishiyama et al., 2013). The simulations predict the distribution of dark matter. However, the consistency between the cosmological simulation and the observations at confirms that the distribution of galaxies in the Universe is governed by dark matter and grows hierarchically. In addition, the three dimensional structure of the galaxy cluster at provides us with an unique opportunity to investigate the dependence of galaxy properties on the location of galaxies infalling into the cluster. At lower redshifts, similar large-scale structures have been found (e.g., Kodama et al., 2005; Nakata et al., 2005; Tanaka et al., 2009; Sobral et al., 2011; Gal et al., 2008; Faloon et al., 2013). However, the properties of galaxies associated with the cluster is different, showing that star formation activity weakens in the core. It is interesting to investigate what causes the change of the properties in the course of galaxies infalling along the filamentary structure. We discuss this point in § 5.2.
5.1.1 Comparison between [O II] and H emitters
Thanks to the unique set of narrowband filters, we can compare H emission with [O II] emission in an unbiased manner for galaxies associated with the structures at . Similar comparisons have been conducted for emission line galaxies detected with dual narrowband filters in the field (Sobral et al., 2012; Hayashi et al., 2013). Before comparing them, we must keep in mind that the limiting fluxes in H and [O II] emissions are quite different as shown in §3 or Table 1; 1.410-16 erg s-1 cm-2 for H emitters (a dust-free SFR of 14.6 M⊙ yr-1) and 1.2 or 1.410-17 erg s-1 cm-2 for [O II] emitters (a dust-free SFR of 2.2 or 2.6 M⊙ yr-1). Also, note that this H limit is much shallower than those in Sobral et al. (2012) and/or Hayashi et al. (2013).
As shown in Figure 3, for four out of nine H emitters, [O II] emissions are detected by NB912 or NB921 imaging. All of them have [O II] emission detected in NB921 data, but only one emitter has [O II] emission detected in NB912. This is likely due to the difference between the filter response curves in redshift space (Figure 1). Note that among the four, the H emitter with [O II] emission detected in both NB912 and NB921 is spectroscopically confirmed, and the others are not confirmed yet. Figure 2 shows that the H emitters with [O II] detections tend to have redder colour. This may go against our intuition. We expect that [O II] emission is easier to detect in less dusty galaxies which should have bluer colour. The observations seem to suggest that the dust extinction does not determine mainly whether the [O II] emission is detected or not for the H emitters. Perhaps, it is related to the age, if the redder colour means stronger Balmer/4000Å break due to an older stellar population rather than heavier dust extinction. We check the EW of the emitters, but we do not find any significant difference between the [O II] emitters with and without H detection (see also Figure 2). The ratio of H /[O II] is also dependent on metallicity (e.g., Sobral et al., 2012; Hayashi et al., 2013). If the galaxies have lower metallicity, [O II] luminosity should be higher and easier to be detected for galaxies with a given H luminosity. On the other hand, about half of H emitters do not have [O II] emissions detected in NB912 or NB921 data. These galaxies may be metal-rich. The galaxies detected as a NBH emitter could alternatively be [O II] emitters at and/or [O III] emitters at . However, since the fluxes of the emission lines detected are greater than 1.410-16 erg s-1 cm-2, the corresponding luminosities are quite large if the galaxies are at . Thus, it is unlikely that almost all of them are contaminants.
In comparison with the large numbers of [O II] emitters being detected, the number of H emitters detected is small. Typically, [O II] emitters at are a population with a lower amount of dust (Hayashi et al., 2013). Less dusty galaxies have an observed ratio of H to [O II] of , suggesting that H luminosity may not be strong for galaxies with a given [O II] luminosity. Indeed, there are only four [O II] emitters with [O II] fluxes larger than 1.410-16 erg s-1 cm-2 in the region where NBH and data by WFCAM are available. Even if the limit is weakened down to 1.010-16 erg s-1 cm-2, the number of the [O II] emitters is only 12. This is of the same order of magnitude as the number of the H emitters detected among the [O II] emitter sample. This means that the ratio of H to [O II] is not high but close to unity, which may support that most of the [O II] emitters are typically less dusty. Thus, a deeper survey of H emission is required so that we can obtain a larger sample of H emitters at .
5.2 Environmental dependence of galaxy properties
One of the hot topics in the evolution of cluster galaxies is how and where the galaxies obtained the properties characteristic of cluster galaxies seen in the local Universe, with redder colour, less star formation activity, and bulge-dominated morphology (e.g., Blakeslee et al., 2006; Tanaka et al., 2005, 2013; Gerke et al., 2007; van den Bosch et al., 2008; Thomas et al., 2010; Lemaux et al., 2012; Rodriguez Del Pino et al., 2013; Newman et al., 2013; Strazzullo et al., 2013; Bassett et al., 2013). Some effects such as ram pressure stripping or galaxy-galaxy interactions are expected to be at work for infalling galaxies in the outskirts (e.g., Treu et al., 2003; Moran et al., 2007, and references therein). It is therefore interesting to investigate how the properties of [O II] emitters change along the filamentary large scale structures.
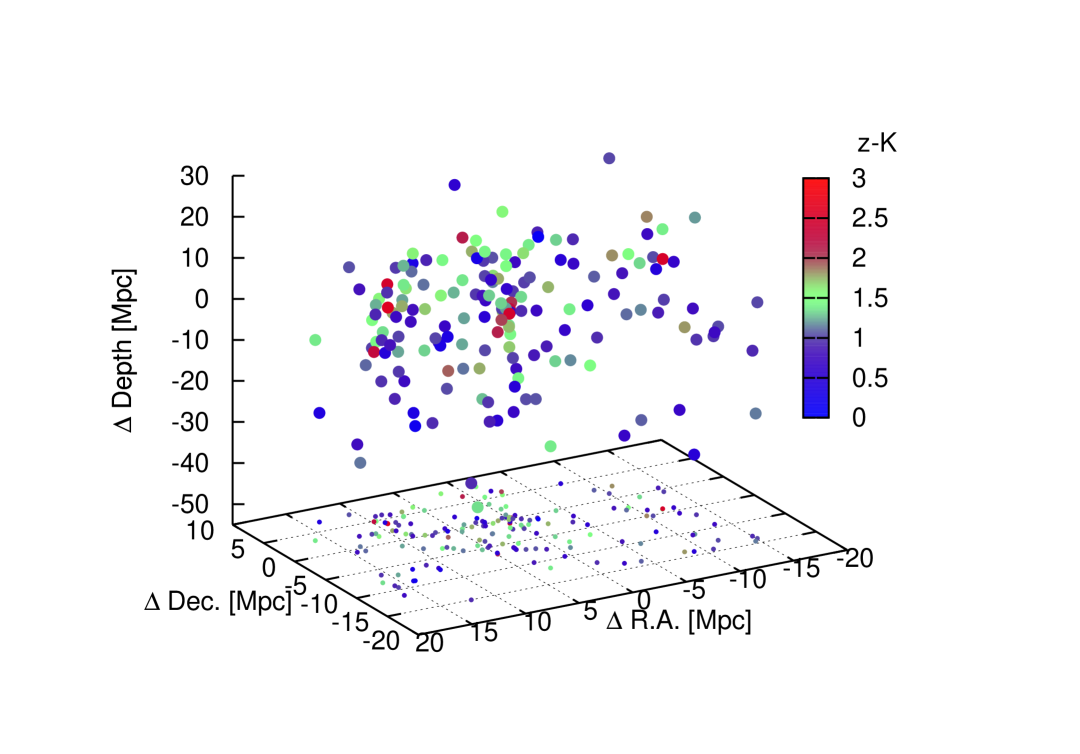
Figure 7 shows again the three dimensional distribution of the 170 [O II] emitters identified by both narrowband filters, but now colour-coded by colour and [O II] flux. Note that the colour of galaxies at corresponds to the colour in rest-frame, implying that it is useful to estimate the strength of the Balmer/4000Å break. It seems that [O II] emitters with red or green colour of are likely to be located along the filamentary structures and in the region close to the cluster centre, where the criterion of red or green colour is based on the distribution of colours shown in Figure 2. The [O II] emitters away from the cluster centre, and relatively isolated ones, seem to have bluer colours. If this is true, it can be considered that the galaxies have changed colour while they are in the filamentary structures and close to the centre of galaxy cluster. On the other hand, no strong dependence of [O II] flux on the location of the galaxy is seen, although we might have expected that the star formation of galaxies weakens along the structures. We note that stellar mass of the galaxies also does not show a strong dependence. This indicates that there is no strong dependence of specific SFRs on the location of the galaxy, which is consistent with the result that Brodwin et al. (2013) have found for galaxy clusters at . Although the result may be somewhat subjective, we discuss the dependence of galaxy properties on the environment more quantitatively below.
The red colour of galaxies can be caused by two degenerate factors. One is the age of the galaxy and the other is dust. If we assume that the age mainly dominates the change of the colour, since [O II] emitters at are likely to be typically less dusty populations (Hayashi et al., 2013), then the galaxies get older as they are in the filamentary structures and close to the centre of galaxy cluster. If we assume that dust extinction is a dominant cause of their red colors, this means that dusty starburst activity is preferentially triggered in the environments of filamentary structures and the centre of the galaxy cluster. This is very similar to our recent finding by Koyama et al. (2013), where we demonstrated that star-forming galaxies in dense environments tend to be more highly obscured by dust than normal field galaxies at the same redshifts. Thus, in any case, our result suggests that galaxy evolution occurs along the large-scale filamentary structures around the galaxy cluster. Furthermore, if we assume that galaxies in the surrounding region follow the scenario of hierarchical cluster formation as expected, galaxies are considered to evolve while infalling to the centre along the filamentary structures.
A dependence of the star formation activity on the site where galaxies reside is not seen in this cluster. However, studies of galaxy clusters at lower redshifts suggest that galaxies in the core of rich clusters must stop their activity significantly before . Thus, quenching process might be at work in the core region more effectively. Hayashi et al. (2011) have found an excess of [O II] emitters with red colours comparable to galaxies on the red sequence of colour-magnitude diagram, and they are likely to be possible AGNs. It is argued that the AGN feedback could play a role in quenching star formation of galaxies in the core of the galaxy cluster.
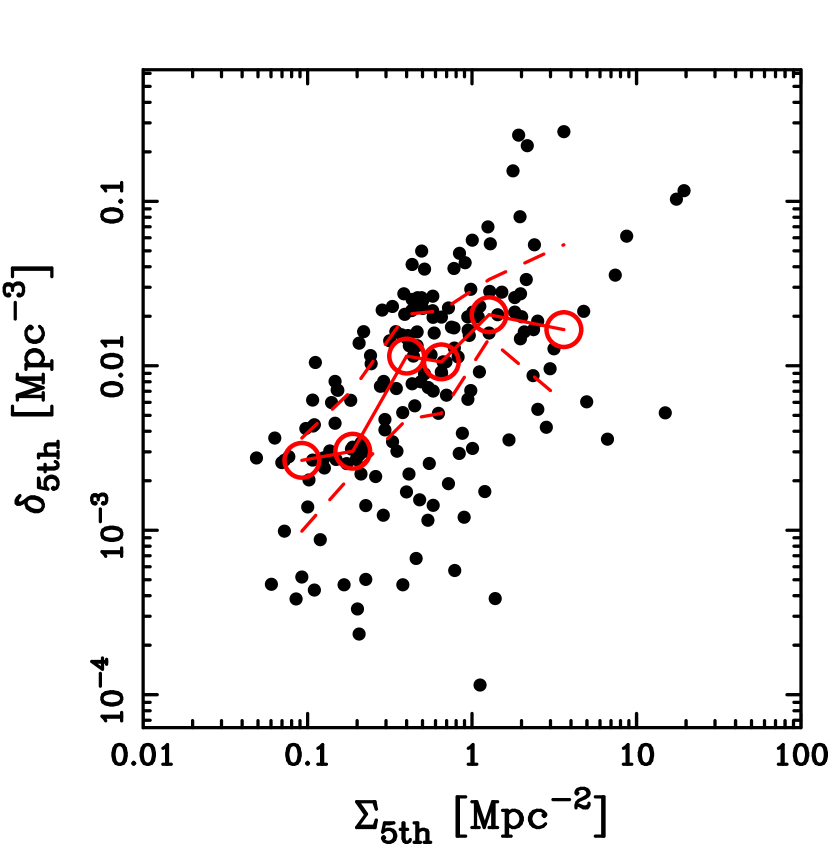
Here, we calculate a local density from the three dimensional distribution (Figure 6) to discuss the dependence of galaxy properties on the environment more quantitatively. We note that similar discussions were made in Hayashi et al. (2011), but we can refine them with the three dimensional distribution of the galaxies. The local density, , in units of Mpc-3 (in co-moving scale), is calculated using the volume out to which the fifth nearest [O II] emitters are included. We then compare this with the local surface density, , in units of Mpc-2 (in co-moving scale), calculated in Hayashi et al. (2011). Note that the NB912+NB921 [O II] emitters are used in the calculation of , while all of the NB912 [O II] emitters are used in the calculation of in Hayashi et al. (2011). However, as shown in Figure 4, many of the NB912 [O II] emitters without a [O II] detection in NB921 have redshifts lower than , that is, they tend to be embedded in structures slightly in the foreground compared with the galaxies associated with the cluster. Thus, although the samples used are not identical, the comparison allows us to investigate the properties of galaxies in the cluster and the structures at . We also make sure that our results do not change even if the local densities are calculated from the third or seventh nearest emitters. In this work, we adopt the local densities calculated from the fifth nearest emitters to be consistent with Hayashi et al. (2011). Figure 8 shows the comparison between the two local densities. Although the two densities are roughly in agreement, the correlation is not strong and there is a large dispersion between them. Indeed, the correlation coefficient is 0.52. The mild correlation between them underlines the importance of obtaining the true three dimensional distribution to properly estimate the environment where galaxies reside, instead of using a projected celestial distribution. However, as described in § 5.1, the peculiar motion of an individual galaxy can influence the local density estimated from the three dimensional distribution whose depth is based on the redshift.
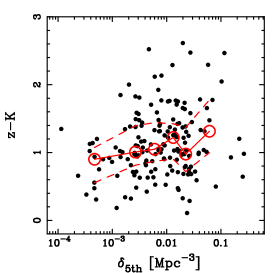
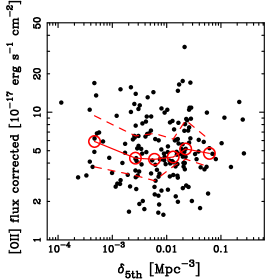
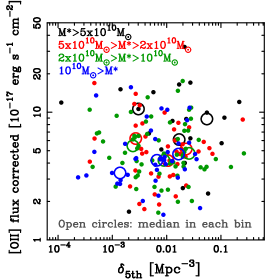
Figure 9 shows the colours and [O II] fluxes as a function of local density, , where the fluxes are corrected for the response curve of the filter using the redshift estimated from the ratio of NB912 to NB921 flux. The correction to the flux varies by a factor of 1.00 to 8.83, and the median is a factor of 1.06. Note that the precise correction is dependent on the redshift at which the galaxies are located (Figure 1). Our method using two adjacent narrowband filters demonstrates that we can measure both accurate fluxes of the emission lines and accurate redshifts. In both panels, the median, 25% and 75% values are also shown in each bin. The distribution of the colours and [O II] fluxes in each panel is consistent with our earlier discussion. First, the average colour of galaxies mildly gets redder as the local density becomes larger, although the difference in colour is not large. Moreover, almost all galaxies with red colours of , as defined in Hayashi et al. (2011), tend to be located in higher density regions, while no such red galaxy is seen in the lower density regions. Next, there is no strong dependence of [O II] flux on the local density, suggesting that the SFRs of galaxies associated with this cluster and structures are not dependent on the environment. Note that the [O II] fluxes are not corrected for dust extinction. However, even if a dust correction dependent on SFR or stellar mass is adopted for the [O II] emitters, the result does not change, as we do not observe a strong dependence of stellar masses of galaxies on the local density. We also investigate the star-formation activity in galaxies at a given stellar mass as a function of the local density. There is no strong dependence of star formation on environment in all bins of stellar mass. Consequently, although we find that the surface local density is not an ideal indicator of the environment, the results we have found in this paper support those of Hayashi et al. (2011).
In summary, our results show that there is a weak correlation between the galaxy colour and the environment on average, despite other properties showing no environmental dependence. As discussed above, galaxy colours can relate to the age or dust extinction. In the former case, it is likely that galaxies have experienced a similar, steady history of star formation in all environments, but galaxies formed earlier on average in denser environments. We may be witnessing the formation bias of cluster galaxies. In the latter case, it is also likely that star formation activity is underestimated and the dusty starburst might have something to do with the mode of star formation which is triggered by the environmental effects and thus different from that of field galaxies. It would be interesting to reveal which is the main factor to cause the environmental dependence of galaxy properties we have observed. However, such investigation is beyond the scope of this paper due to the limitations of the data.
6 Conclusions
We have revealed large-scale structures around a galaxy cluster, XCS2215, at for the first time in three dimensions by using a set of narrowband images targeting nebular emissions from the galaxies associated with the galaxy cluster. The uniqueness of this study is a combination of NB912 and NB921 narrowband filters installed in Suprime-Cam on the Subaru Telescope which is very effective to estimate the accurate redshifts of the star-forming galaxies at . The two overlapping filters, with a slight difference in central wavelength corresponding to km s-1, cause a difference in measured flux depending on the wavelength where the emission line is observed in each filter. Both narrowband filters can detect [O II] emission line from galaxies at . Thus, the ratio of [O II] flux measured with NB912 filter to that with NB921 filter is a good estimator of redshift for [O II] emission line galaxies.
We have 41 spectroscopic redshifts for [O II] emitters identified by both NB912 and NB921 filters, which are mainly obtained by our near-infrared spectroscopic follow-up with MOIRCS and FMOS on the Subaru. We confirm that such [O II] emitters have a ratio of NB912-measured [O II] flux to NB921 which is in good agreement with that expected from the filter response functions (Figure 4). Comparing with the spectroscopic redshift, , we show that the redshift from the difference of line flux, , can be derived with accuracy of . This demonstrates that the estimation of redshift from the emission fluxes measured with different but adjacent narrowband filters is quite reliable.
In this paper, we use two samples of [O II] emission line galaxies at . One is a sample of 380 [O II] emitters identified by NB912 which is constructed by Hayashi et al. (2011), while the other is a sample of 429 [O II] emitters identified using NB921 which is newly constructed in this paper. Among these two samples, 170 galaxies are found in both datasets. We then estimate the redshifts for the 170 [O II] emitters from the fluxes measured with NB912 and NB921 and so map the three dimensional distribution of these galaxies around the galaxy cluster. In addition, we have a sample of H emitters at in the field, although it is limited to the central 13.65′13.65′ region. Due to the shallowness of the H data, only nine H emitters are detected. About half of them are identified by NB921 [O II] emitters as well.
Our observations identify three-dimensional structures extending towards the centre of the galaxy cluster, some of which intersect other structures. The view we have found is consistent with a picture of hierarchical formation in which galaxy clusters are formed at the intersection of filamentary structures and grow through accretion of galaxies along the large scale structures. As we have already argued in Hayashi et al. (2010, 2011), we reiterate that this galaxy cluster is active and galaxies in the surrounding region constitute the filamentary structures penetrating towards the centre of galaxy cluster at within which the vigorous evolution of galaxies is occurring.
We also show the mild correlation between the local density calculated from the three dimensional distribution and the surface density estimated from the projected celestial distribution used in Hayashi et al. (2011), suggesting the importance of the 3D view of structures for properly estimating the environment. However, we have found results consistent with Hayashi et al. (2011) in that galaxies with a red colour tend to be located in higher density region and that star-formation activity is not strongly dependent on the environment within the cluster or the surrounding structures. This implies that the growth of galaxies is on-going along the filaments and in the centre of the galaxy cluster, and the process which quenches their activity may work more efficiently in the core region than in the infall regions. Unfortunately, spectroscopic data currently available are too sparse to discuss the change of galaxy properties in detail along the structures. We therefore require spectroscopic data covering multiple nebular emission lines in the rest-frame optical to further investigate the galaxy properties and processes critical for the evolution of cluster galaxies.
We conclude that the use of two adjacent narrowband filters provides us with the accurate redshifts and emission line fluxes of galaxies, which enables to draw a three dimensional view of galaxy distribution as well as to properly derive the star-formation activity of the galaxies in the whole field surveyed. In the near future, it is expected that much larger samples of galaxies at high redshifts will be discovered by wider-field imaging surveys such as one with Hyper Suprime-Cam on the Subaru Telescope. These samples will be too numerous to be observed spectroscopically. In this case, the method we apply in this paper can be a powerful tool for the accurate estimation of the redshift and emission line flux of star-forming galaxies.
Acknowledgments
We would like to thank an anonymous referee for carefully reading our manuscript and providing helpful comments. Many of the data used in this paper are collected at Subaru Telescope, which is operated by the National Astronomical Observatory of Japan. We thank the Subaru Telescope staff for their invaluable effort in our observation with Suprime-Cam in service programme. The United Kingdom Infrared Telescope is operated by the Joint Astronomy Centre on behalf of the Science and Technology Facilities Council of the U.K. T.K. acknowledges the financial support in part by Grant-in-Aid for the Scientific Research (Nos. 21340045, 24244015) by the Japanese Ministry of Education, Culture, Sports, Science and Technology. DS acknowledges financial support from the Netherlands Organisation for Scientific research (NWO) through a Veni fellowship. IRS acknowledges support from STFC (ST/I001573/1), the ERC Advanced Investigator programme DUSTYGAL 321334 and a Royal Society/Wolfson Merit Award.
References
- Bassett et al. (2013) Bassett R. et al., 2013, ApJ, 770, 58
- Bertin & Arnouts (1996) Bertin E., Arnouts S., 1996, A&AS, 117, 393
- Best et al. (2010) Best P. et al., 2010, arXiv:1003.5183
- Blakeslee et al. (2006) Blakeslee J. P. et al., 2006, ApJ, 644, 30
- Brammer et al. (2011) Brammer G. B. et al., 2011, ApJ, 739, 24
- Brodwin et al. (2013) Brodwin M. et al., 2013, ApJ, 779, 138
- Cardelli et al. (1989) Cardelli J. A., Clayton G. C., Mathis J. S., 1989, ApJ, 345, 245
- Casali et al. (2007) Casali M. et al., 2007, A&A, 467, 777
- Colless et al. (2001) Colless M. et al., 2001, MNRAS, 328, 1039
- Daddi et al. (2004) Daddi E., Cimatti A., Renzini A., Fontana A., Mignoli M., Pozzetti L., Tozzi P., Zamorani G., 2004, ApJ, 617, 746
- Erb et al. (2011) Erb D. K., Bogosavljević M., Steidel C. C., 2011, ApJL, 740, L31
- Faloon et al. (2013) Faloon A. J. et al., 2013, ApJ, 768, 104
- Gal et al. (2008) Gal R. R., Lemaux B. C., Lubin L. M., Kocevski D., Squires G. K., 2008, ApJ, 684, 933
- Galametz et al. (2013) Galametz A. et al., 2013, A&A, 559, A2
- Geach et al. (2008) Geach J. E., Smail I., Best P. N., Kurk J., Casali M., Ivison R. J., Coppin K., 2008, MNRAS, 388, 1473
- Gerke et al. (2007) Gerke B. F. et al., 2007, MNRAS, 376, 1425
- Hayashi et al. (2011) Hayashi M., Kodama T., Koyama Y., Tadaki K.-I., Tanaka I., 2011, MNRAS, 415, 2670
- Hayashi et al. (2010) Hayashi M., Kodama T., Koyama Y., Tanaka I., Shimasaku K., Okamura S., 2010, MNRAS, 402, 1980
- Hayashi et al. (2012) Hayashi M., Kodama T., Tadaki K.-I., Koyama Y., Tanaka I., 2012, ApJ, 757, 15
- Hayashi et al. (2013) Hayashi M., Sobral D., Best P. N., Smail I., Kodama T., 2013, MNRAS, 430, 1042
- Henry et al. (2014) Henry J. P., Aoki K., Finoguenov A., Fotopoulou S., Hasinger G., salvato M., Suh H., Tanaka M., 2014, ApJ, 780, 58
- Hilton et al. (2010) Hilton M. et al., 2010, ApJ, 718, 133
- Holden et al. (2007) Holden B. P. et al., 2007, ApJ, 670, 190
- Ichikawa et al. (2006) Ichikawa T. et al., 2006, in Society of Photo-Optical Instrumentation Engineers (SPIE) Conference Series.
- Ilbert et al. (2009) Ilbert O. et al., 2009, ApJ, 690, 1236
- Ishiyama et al. (2013) Ishiyama T. et al., 2013, ApJ, 767, 146
- Iwamuro et al. (2012) Iwamuro F. et al., 2012, PASJ, 64, 59
- Kennicutt (1998) Kennicutt Jr. R. C., 1998, ARA&A, 36, 189
- Kodama et al. (2013) Kodama T., Hayashi M., Koyama Y., Tadaki K.-I., Tanaka I., Shimakawa R., 2013, in Thomas D., Pasquali A., Ferreras I., eds, IAU Symposium Vol. 295, IAU Symposium. pp 74–77
- Kodama et al. (2005) Kodama T. et al., 2005, PASJ, 57, 309
- Kong et al. (2006) Kong X. et al., 2006, ApJ, 638, 72
- Koyama et al. (2010) Koyama Y., Kodama T., Shimasaku K., Hayashi M., Okamura S., Tanaka I., Tokoku C., 2010, MNRAS, 403, 1611
- Koyama et al. (2013) Koyama Y., Kodama T., Tadaki K.-I., Hayashi M., Tanaka M., Smail I., Tanaka I., Kurk J., 2013, MNRAS, 428, 1551
- Koyama et al. (2013) Koyama Y. et al., 2013, MNRAS, 434, 423
- Lemaux et al. (2012) Lemaux B. C. et al., 2012, ApJ, 745, 106
- Miyazaki et al. (2002) Miyazaki S. et al., 2002, PASJ, 54, 833
- Moran et al. (2007) Moran S. M., Ellis R. S., Treu T., Smith G. P., Rich R. M., Smail I., 2007, ApJ, 671, 1503
- Moustakas et al. (2013) Moustakas J. et al., 2013, ApJ, 767, 50
- Muzzin et al. (2013) Muzzin A. et al., 2013, ApJ, 777, 18
- Nakata et al. (2005) Nakata F. et al., 2005, MNRAS, 357, 1357
- Newman et al. (2013) Newman A. B., Ellis R. S., Andreon S., Treu T., Raichoor A., Trinchieri G., 2013, arXiv: 1310.6754
- Ouchi et al. (2004) Ouchi M. et al., 2004, ApJ, 611, 660
- Patel et al. (2009) Patel S. G., Holden B. P., Kelson D. D., Illingworth G. D., Franx M., 2009, ApJL, 705, L67
- Patel et al. (2011) Patel S. G., Kelson D. D., Holden B. P., Franx M., Illingworth G. D., 2011, ApJ, 735, 53
- Rodriguez Del Pino et al. (2013) Rodriguez Del Pino B., Bamford S. P., Aragon-Salamanca A., Milvang-Jensen B., Merrifield M. R., Balcells M., 2013, arXiv: 1311.2842
- Salpeter (1955) Salpeter E. E., 1955, ApJ, 121, 161
- Schlegel et al. (1998) Schlegel D. J., Finkbeiner D. P., Davis M., 1998, ApJ, 500, 525
- Shimasaku et al. (2004) Shimasaku K. et al., 2004, ApJL, 605, L93
- Sobral et al. (2009) Sobral D. et al., 2009, MNRAS, 398, 75
- Sobral et al. (2012) Sobral D., Best P. N., Matsuda Y., Smail I., Geach J. E., Cirasuolo M., 2012, MNRAS, 420, 1926
- Sobral et al. (2011) Sobral D., Best P. N., Smail I., Geach J. E., Cirasuolo M., Garn T., Dalton G. B., 2011, MNRAS, 411, 675
- Sobral et al. (2013) Sobral D., Smail I., Best P. N., Geach J. E., Matsuda Y., Stott J. P., Cirasuolo M., Kurk J., 2013, MNRAS, 428, 1128
- Springel et al. (2005) Springel V. et al., 2005, Nature, 435, 629
- Stanford et al. (2006) Stanford S. A. et al., 2006, ApJL, 646, L13
- Stott et al. (2013) Stott J. P. et al., 2013, MNRAS
- Strazzullo et al. (2013) Strazzullo V. et al., 2013, ApJ, 772, 118
- Suzuki et al. (2008) Suzuki R. et al., 2008, PASJ, 60, 1347
- Tadaki et al. (2012) Tadaki K.-I. et al., 2012, MNRAS, 423, 2617
- Tanaka et al. (2011) Tanaka I. et al., 2011, PASJ, 63, 415
- Tanaka et al. (2005) Tanaka M., Kodama T., Arimoto N., Okamura S., Umetsu K., Shimasaku K., Tanaka I., Yamada T., 2005, MNRAS, 362, 268
- Tanaka et al. (2009) Tanaka M., Lidman C., Bower R. G., Demarco R., Finoguenov A., Kodama T., Nakata F., Rosati P., 2009, A&A, 507, 671
- Tanaka et al. (2013) Tanaka M. et al., 2013, ApJ, 772, 113
- Thomas et al. (2010) Thomas D., Maraston C., Schawinski K., Sarzi M., Silk J., 2010, MNRAS, 404, 1775
- Tomczak et al. (2013) Tomczak A. R. et al., 2013, arXiv:1309.5972
- Treu et al. (2003) Treu T., Ellis R. S., Kneib J.-P., Dressler A., Smail I., Czoske O., Oemler A., Natarajan P., 2003, ApJ, 591, 53
- van den Bosch et al. (2008) van den Bosch F. C., Aquino D., Yang X., Mo H. J., Pasquali A., McIntosh D. H., Weinmann S. M., Kang X., 2008, MNRAS, 387, 79
- van der Wel et al. (2007) van der Wel A. et al., 2007, ApJ, 670, 206
- Yabe et al. (2012) Yabe K. et al., 2012, PASJ, 64, 60
- Yagi (2012) Yagi M., 2012, PASP, 124, 1347
- Yagi et al. (2002) Yagi M., Kashikawa N., Sekiguchi M., Doi M., Yasuda N., Shimasaku K., Okamura S., 2002, AJ, 123, 66
- Yamada et al. (2012) Yamada T., Nakamura Y., Matsuda Y., Hayashino T., Yamauchi R., Morimoto N., Kousai K., Umemura M., 2012, AJ, 143, 79
- York et al. (2000) York D. G. et al., 2000, AJ, 120, 1579