Power density spectra of modes of orbital motion in strongly curved spacetime: obtaining the observable signal
Abstract
High frequency quasi-periodic oscillations (HF QPOs) appear in the X-ray variability of several accreting low-mass binaries. In a series of works it was suggested that these QPOs may have connection to inhomogeneities orbiting close to an inner edge of the accretion disc. In this paper we explore the appearance of an observable signal generated by small radiating circular hot spots moving along quasi-elliptic trajectories close to the innermost stable circular orbit in the Schwarzschild spacetime. Our consideration takes into account the capabilities of observatories that have been operating in the past two decades represented by the Rossi X-ray Timing Explorer (RXTE) and the proposed future instruments represented by the Large Observatory for X-ray Timing (LOFT). For these purposes we choose such model parameters that lead to lightcurves comparable to those observed in Galactic black hole sources, in particular the microquasar GRS 1915+105. We find that when a weak signal corresponding to the hot-spot Keplerian frequency is around the limits of the RXTE detectability, the LOFT observations can clearly reveal its first and second harmonics. Moreover, in some specific situations the radial epicyclic frequency of the spot can be detected as well. Finally, we also compare the signal produced by the spots to the signal produced by axisymmetric epicyclic disc-oscillation modes and discuss the key differences that could be identified via the proposed future technology. We conclude that the ability to recognize the harmonic content of the signal can help to distinguish between the different proposed physical models.
keywords:
X-rays: binaries – accretion, accretion disks – black hole physics - gravitation – methods: numerical1 Introduction
Several low-mass X-ray binaries (LMXBs) exhibit in the high frequency part of their X-ray power density spectra (PDS) distinct peaks, so-called quasi-periodic oscillations (QPOs). The oscillations with the highest frequencies are sometimes displayed in the range of hundreds Hz (HF QPOs). In neutron star (NS) sources two simultaneous strong HF QPO peaks are often found (referred to as the upper and the lower QPO). The frequencies of these twin peak QPOs are varying over time, sometimes by several hundreds Hz on timescales of days, and the fastest documented changes of twin QPO frequency are of the order of Hz/sec (Paltani et al., 2004; Barret et al., 2005; Barret & Vaughan, 2012). The frequency ratio sampled from the available observations of individual NS QPO sources often clusters (typically around the 3:2 value). The clustering can account either to incomplete data sampling, weakness of the two QPOs outside the limited frequency range, or to the intrinsic source clustering (see Abramowicz et al., 2003a; Belloni, Méndez & Homan, 2005; Belloni et al., 2007; Török et al., 2008a, b, c; Török, 2009; Barret & Boutelier, 2008; Boutelier et al., 2009; Wang et al., 2013, for details). The HF QPOs observed in microquasars exhibit the 3:2 frequency ratio (e.g., Abramowicz & Kluźniak, 2001; McClintock & Remillard, 2006) as well. These QPOs are, however, somewhat different from the case of NS observations. Their frequencies are much more stable while their amplitudes are lower. One should also note that they are not displayed frequently and exhibit spectral differences from the NS QPOs (e.g. van der Klis, 2006).
So far, there is no consensus on the QPO origin, and numerous models have been proposed (e.g., Alpar & Shaham, 1985; Lamb et al., 1985; Miller, Lamb & Psaltis, 1998; Psaltis et al., 1999; Wagoner, 1999; Wagoner, Silbergleit & Ortega-Rodr guez, 2001; Abramowicz & Kluźniak, 2001; Titarchuk & Wood, 2002; Rezzolla, Yoshida & Zanotti, 2003; Pétri, 2005; Zhang, 2005; Šrámková, Torkelsson & Abramowicz, 2007; Kato, 2007; Stuchlík et al., 2008; Horák et al., 2009; Mukhopadhyay, 2009; Lai et al., 2012, and others). Several but not all of the models expect that the generic QPO mechanism is the same for both NS an BH sources. Commonly, there is a belief that the HF QPOs carry important information about the inner accreting region dominated by the effects of strong Einstein’s gravity. In several works it was suggested that the observed modulation of X-ray flux may have some connection to the inhomogeneities propagating close to the inner edge of the accretion discs. This idea was first discussed within the hypothesis of PDS continuum origin due to the presence of spots on the accretion disk surface (e.g, Abramowicz et al., 1991; Mineshige, Takeuchi & Nishimori, 1994).111In the same context, Abramowicz et al. (1992) argue that the surfaces of accretion disks must be populated by vortices. They point out that in differentially rotating fluids, vortices are not to be quickly destroyed by shear. Instead, they may be a very long lived objects, that survive in the disc like the Red Spot in Jupiter’s atmosphere.
Spots as the origin of QPOs have been discussed, in particular, in a series of papers (Stella & Vietri, 1998a, b, 1999, 2002; Morsink & Stella, 1999) that explain QPOs as a direct manifestation of modes of relativistic epicyclic motion of blobs at various radii in the inner parts of the accretion disc. Within the model, the two observed HF QPO peaks arise due to the Keplerian and periastron precession of the relativistic orbits. In a similar manner, Čadež, Calvani & Kostić (2008), Kostić et al. (2009), and Germana et al. (2009) introduced a concept in which the QPOs were generated by a tidal disruption (TD) of large accreting inhomogeneities. Recently, Germana (2012) argued that the behaviour of the azimuth phase for non-closed quasielliptic orbits in the curved spacetime can be responsible for the observed pairs of HF QPOs.
In this paper we investigate the behaviour of the observable signal produced by radiating small circular hotspots. We discuss the detectability of the produced signal propagated from the strongly curved spacetime region. In our discussion we consider the capabilities of the present X-ray observatories represented by Rossi X-ray Timing Explorer (RXTE), as well as the proposed future instruments represented by the Large Observatory for X-ray Timing (LOFT). We also compare the signal produced by spots to the signal obtained from another specific kind of simulations assuming axisymmetric epicyclic disc-oscillation modes.
2 Tracing the signal from spot
Effects of special and general relativity act on photons emitted by the hot matter that orbits in the inner part of the accretion disc with velocity reaching values of percents of speed of light. Complex fast calculations of the flux propagation through curved spacetime towards a distant observer represent a demanding, although, in principle, well understood problem with practical astrophysical applications. In past decades, serious effort has been invested to solving it using mathematically elegant approaches, as well as straightforward ray-tracing methods profiting from currently available high computational power. Overall, various alternative strategies have been developed by different authors (e.g. de Felice, Nobili & Calvani, 1974; Cunningham, 1975; Laor, 1991; Karas & Bao, 1992; Karas, Vokrouhlicky & Polnarev, 1992; Stuchlík & Bao, 1992; Viergutz, 1993; Matt, Fabian & Ross, 1993; Zakharov, 1994; Bromley, Chen & Miller, 1997; Dabrowski et al., 1997; Bursa et al., 2004; Bakala et al., 2007; Vincent, Gourgoulhon & Novak, 2012, and others). Particular application to the timing of radiating spots orbiting around black holes was discussed in greatest detail by Schnittman & Bertschinger (2004a, b) who elaborated the model of small radiating spots described as isotropic, monochromatic emitters following non-circular geodesic trajectories and also investigated effects given by large azimuthal shearing of such spots.
The expected spot-signal can be in principle used to model the response of X-ray detectors such as the Proportional Counter Arrray (PCA) on the board of the RXTE (Jahoda et al., 1996, 2006). The actual response of the instrument, however, depends on the complex time-dependent spectral behaviour of the whole source flux. In order to obtain relevant results one must then use a complete physical model of the accreting source radiation. First steps in this direction were taken in the above mentioned work of Schnittman & Bertschinger who investigated their hot-spot lightcurves assuming steady state disk models. This option for modelling the observable signal might be, however, difficult. The current observed radiation of Galactic microquasars exhibits a complex behaviour of transitions between particular X-ray states which are yet poorly understood, and the detailed selfconsistent picture of full accreting system physics is rather missing so far. Another option which we follow here is to use an empirical model of the global source flux and add just the particular investigated model for the HF QPO variability including the predicted time dependent energy spectra. This allows us to reproduce well the detectable signal using the response matrices of the RXTE and compare them to the results that can be achieved through the Large Area Detector (LAD) currently proposed within the future LOFT mission (Feroci et al., 2012).
2.1 Simulation setup
Next we investigate the signal from the motion of a small radiating spot obtained using the extended KYspot code (Dovčiak, Karas & Yaqoob, 2004). For simplicity, we choose the zero black hole spin. We assume radial perturbations of the circular orbit of the radiating spot at the specific orbital radius . At this radius, the radial epicyclic frequency is exactly three times smaller than the Keplerian frequency . The periastron precession frequency then reaches the value . The intrinsic local spot spectrum is chosen in a power law form,
| (1) |
For the further elaboration of observable effects we set the black hole mass . The considered mass scales the Keplerian frequency of the spot to 160Hz, close to one of HF QPO frequencies observed in the microquasar GRS-1915+105 (e.g. McClintock & Remillard, 2006). For the spot trajectory we assume constant angular velocity equal to the Keplerian value and two different amplitudes of the radial epicyclic oscillation - and , respectively. These amplitudes correspond to a dimensionless pseudoeccentricity
| (2) |
reaching the value of and , respectively. The integration interval of the spot observation measured by an observer at the infinity is chosen as 10sec. Due to the technical limitations of the applied code we restrict ourselves to this integration time in all further simulations presented in this paper.
We assume the global source flux described by the spectral distribution and power density spectra ,
| (3) | |||
| (4) |
where is chosen to normalize the assumed countrate roughly to Crab and . This setup mimics the so-called high steep power law (HSPL) state in GRS 1915+105, including steep spectrum and power-law dominated variability with an additional broad Lorentzian component at low frequencies (McClintock & Remillard, 2006).
2.2 Signal behaviour
Since the signal from the spot strongly depends on the source inclination , we compare the results for two representative values of corresponding to the nearly equatorial view and the view close to vertical axes.
2.2.1 Nearly equatorial view
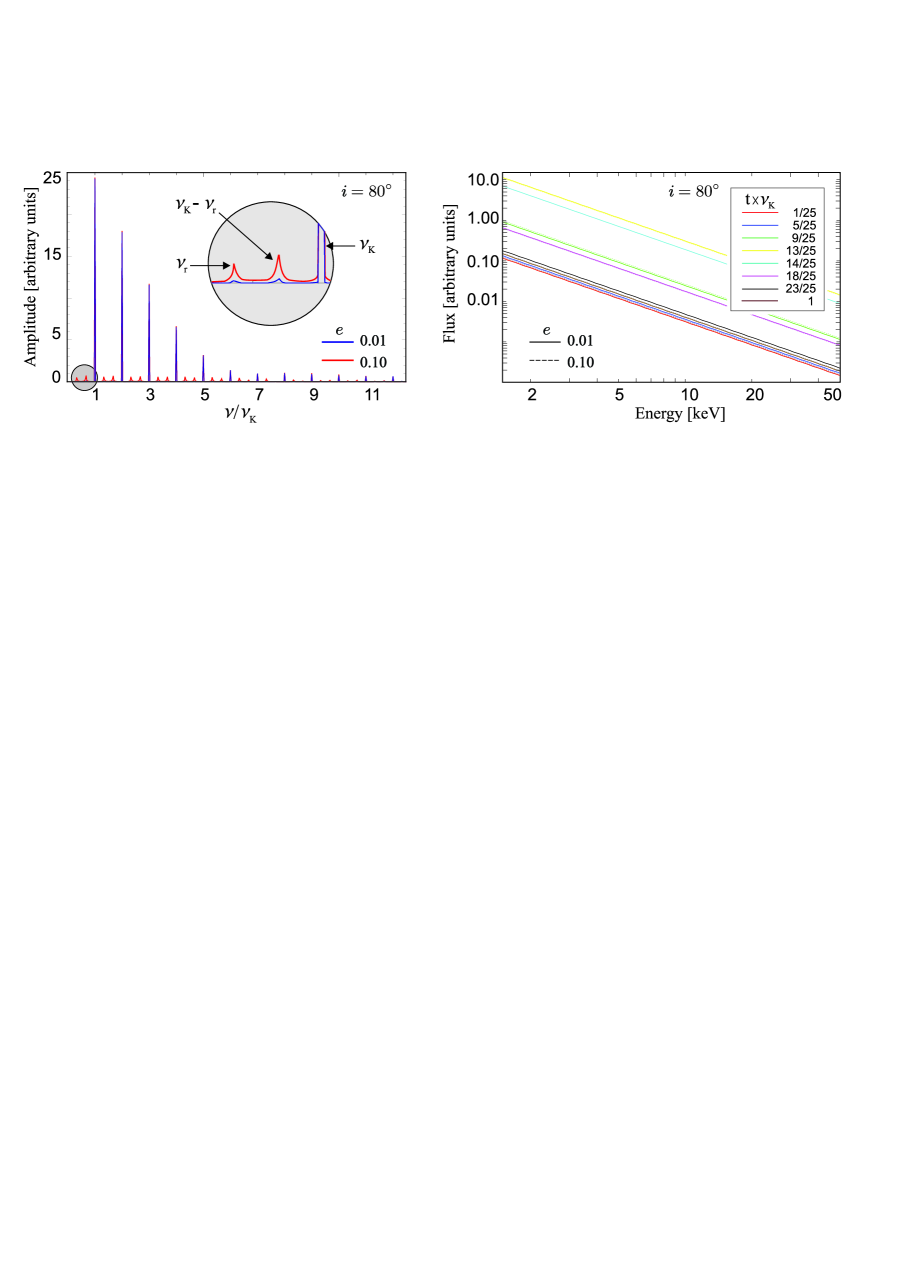
In Figure 1 we include amplitude spectra and time dependent energy spectra of the net spot signal calculated for the distant observer assuming . The spot signal is dominated by the Keplerian frequency and its harmonics amplified by relativistic effects which is well illustrated by the amplitude spectrum on the left panel of Figure 1. The eccentricity given by causes only a negligible modulation at the radial and precession frequency. The increased eccentricity corresponding to can be well recognized in the amplitude spectra, but the signal is still dominated by the Keplerian frequency and its harmonics. The time dependent energy spectra of the spot are depicted in the right panel of Figure 1. We can see that they clearly reveal the signatures of relativistic redshift effects.
So far we have reproduced just the variability and spectra of the net spot flux. In order to assess the observable effects we have to study the total composition of the net spot flux together with the global source flux given by Equations (3) and (4). Assuming this composed radiation, we can consider the capabilities of the RXTE and LOFT instruments using their response matrices and provided software tools. The time-dependent spectra describing the composed radiation are then convolved with the appropriate response matrix giving an estimate of the observed data. These are Fourier transformed to the resulting power spectra. The detectability of the spot signatures then depends obviously on the fraction of photons from the spot in the total flux. Hereinafter we refer to this quantity which determines the signal to noise ratio shortly as signal fraction .
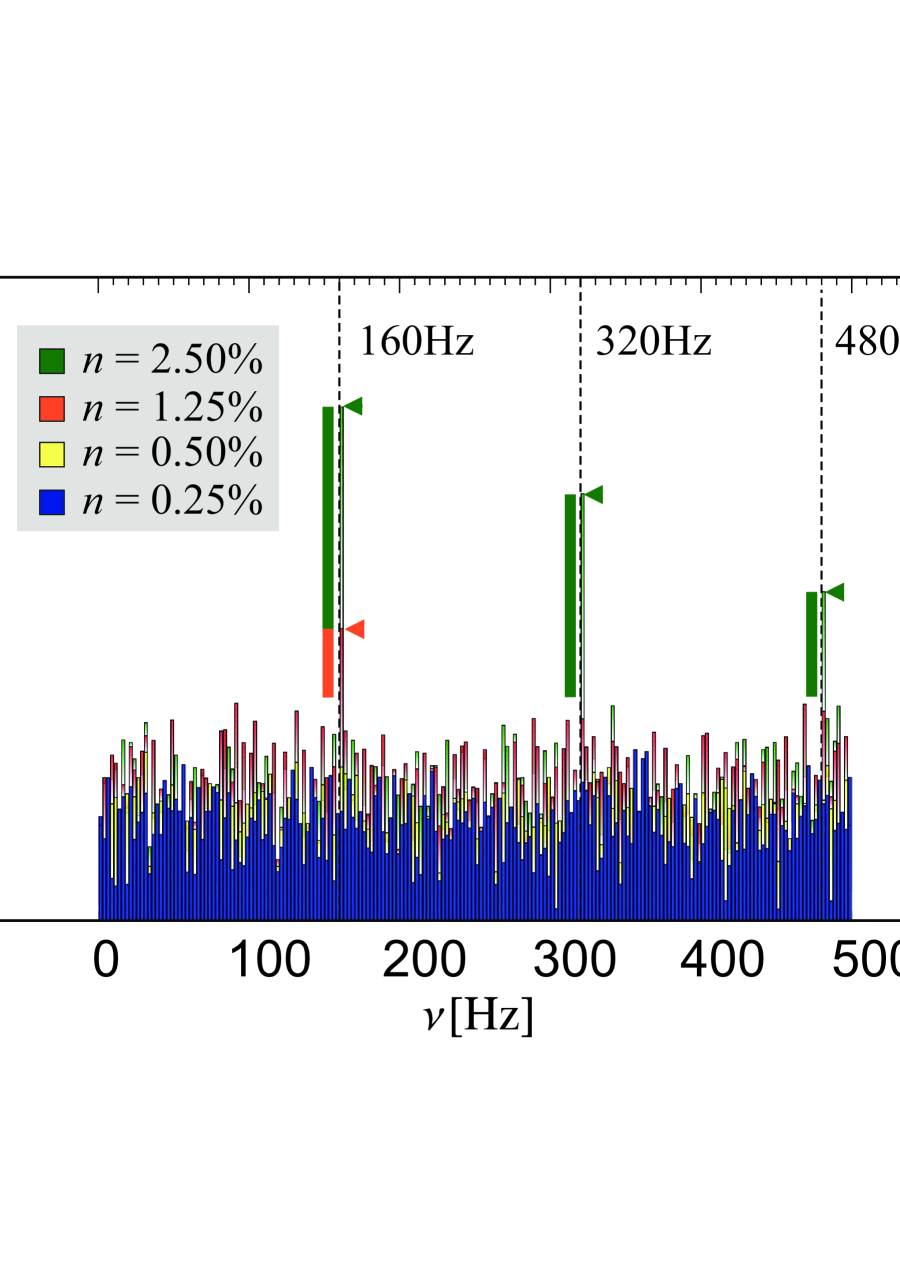
Figure 2 shows PDS resulting from the RXTE and LOFT simulations assuming various levels of and the inclination (i.e., nearly equatorial view). It includes the cases when the signal is weak for the RXTE and there are no significant features within its PDS as well as the high signal fraction when first two harmonics of the Keplerian frequency can be seen. Comparing both panels of this Figure we can deduce that when the weak QPO signal corresponding to the hot-spot Keplerian frequency is around the limits of the RXTE detectability, the LOFT observations will clearly reveal its first and second harmonics. We checked that there is, in practice, no qualitative difference between the cases of and . It is therefore unlikely that the periastron precession or radial epicyclic frequency can be detected in addition to the harmonics when the inclination angle is close to the equatorial plane.
2.2.2 View close to vertical axes
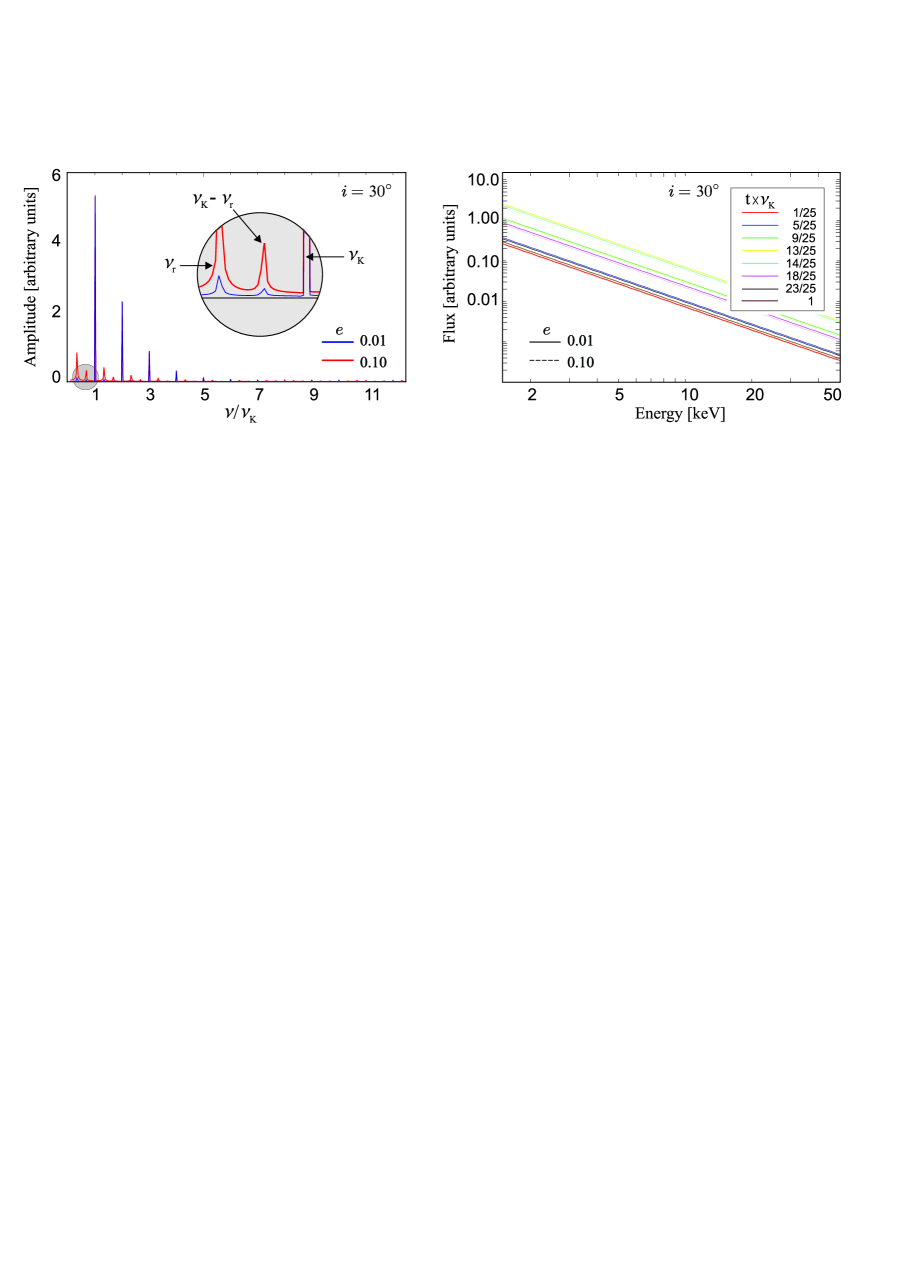
For , the signal is dominated by the Keplerian frequency but the harmonics are much less amplified in comparison to the nearly equatorial view (see the left panel of Figure 3). The pseudoeccentricity again causes rather negligible modulation at the radial and the precession frequency. Nevertheless, we can see that the increased eccentricity of affects the variability more than for the large inclination angle. Furthermore, the modulation at the radial frequency is comparable to those at the second harmonics of the Keplerian frequency. The time dependent energy spectra are depicted in the right panel of Figure 3.
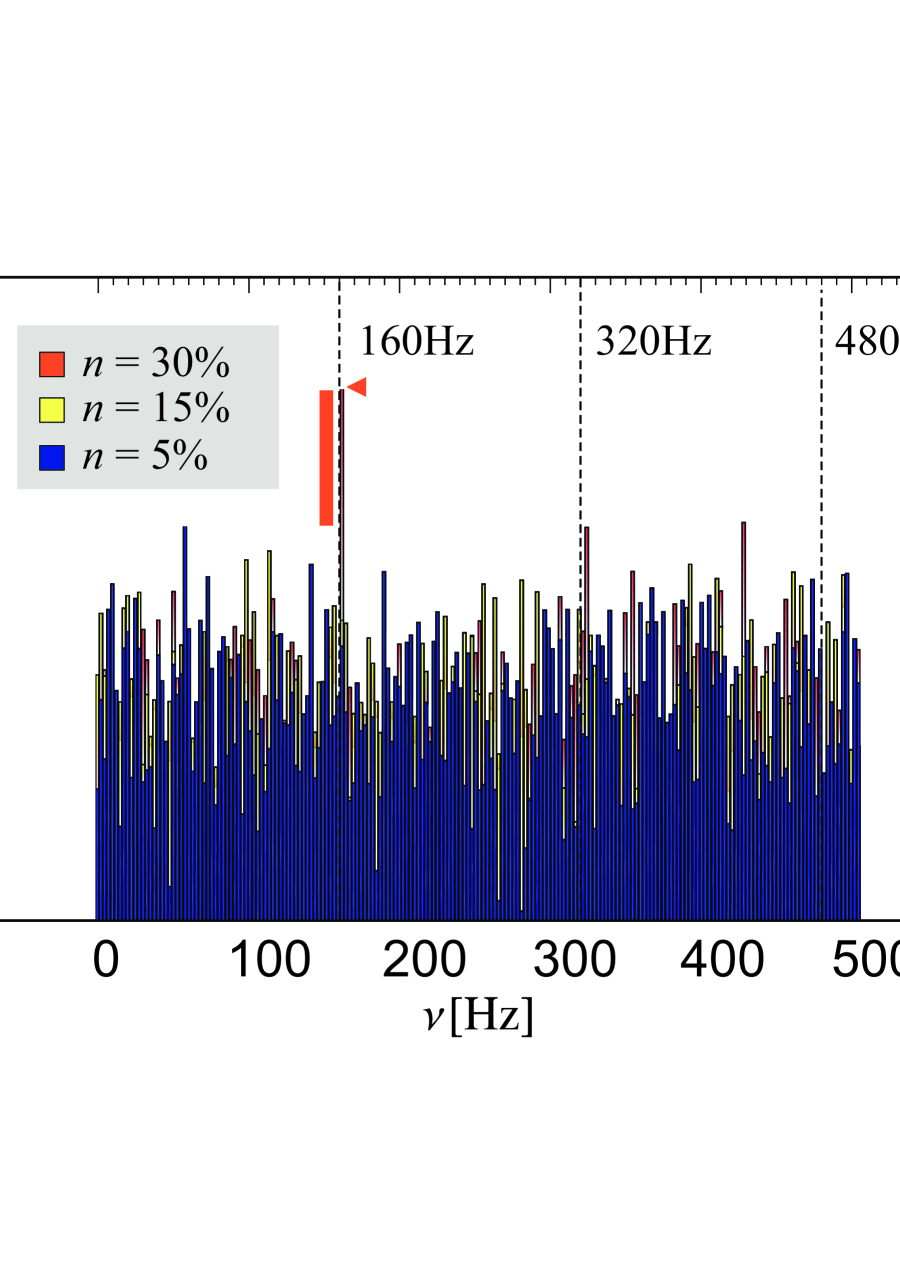
Figure 4 includes PDS resulting from RXTE and LOFT simulations assuming various levels of . It is drawn for and includes the few cases when the signal is weak for the RXTE and there are no significant features within its PDS, plus one case when some feature at the Keplerian frequency can be seen. Comparing both panels of this Figure, one can deduce that when the weak QPO signal corresponding to the hot-spot Keplerian frequency is around the limits of the RXTE detectability, the LOFT observations can clearly reveal its first and second harmonics, and in addition the radial epicyclic frequency and its combinational harmonics . Although it is not directly illustrated in the Figure, it can be shown that decreasing eccentricity to leads to a similar PDS, only without the features at and .
3 Broad peaks and their harmonics
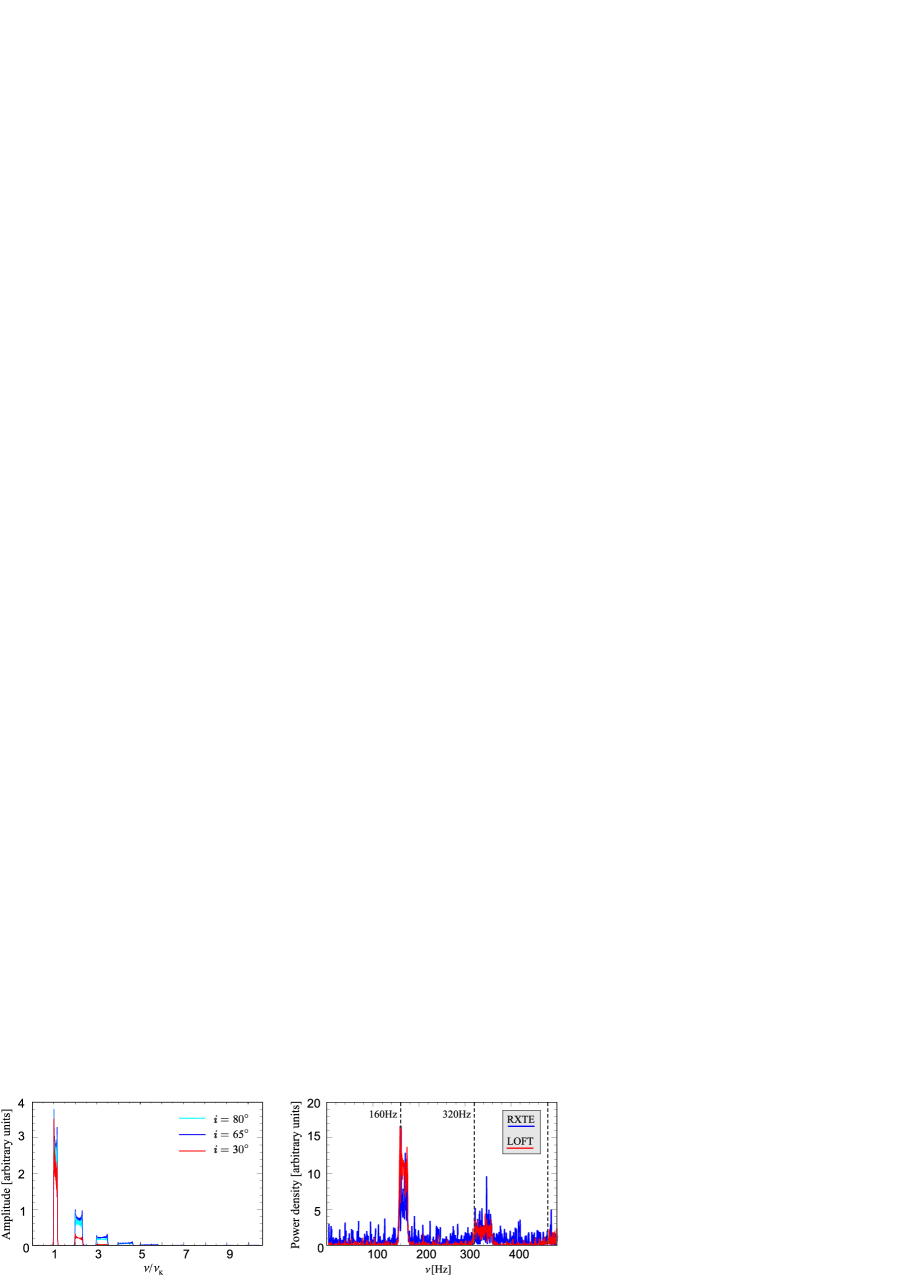
In the previous simplified analysis we assumed the single spot orbiting with the fixed Keplerian period. So far, there is no agreement on the physical origin and properties of the hypothetic clumps orbiting in the disc. In various proposed scenarios, the spot signal (de)coherence is commonly related either to the radial distribution of several spots or to the continuous change of the spot orbital radius (see, e.g., Karas, 1999; Pecháček, Karas & Czerny, 2008; Bini et al., 2012, for details and discussion). In the left panel of Figure 5 we show PDS resulting from consideration of spots created at and drifted to (ISCO). The Figure illustrates well the strong inclination dependence of the ratio between the amplitudes observed at Keplerian and harmonic frequencies. The example of instrument response to the total model flux is illustrated on the right panel of Figure 5 (the mass is set to the same value as in the previous sections).
3.1 The 3:2 peaks produced by spots and tori
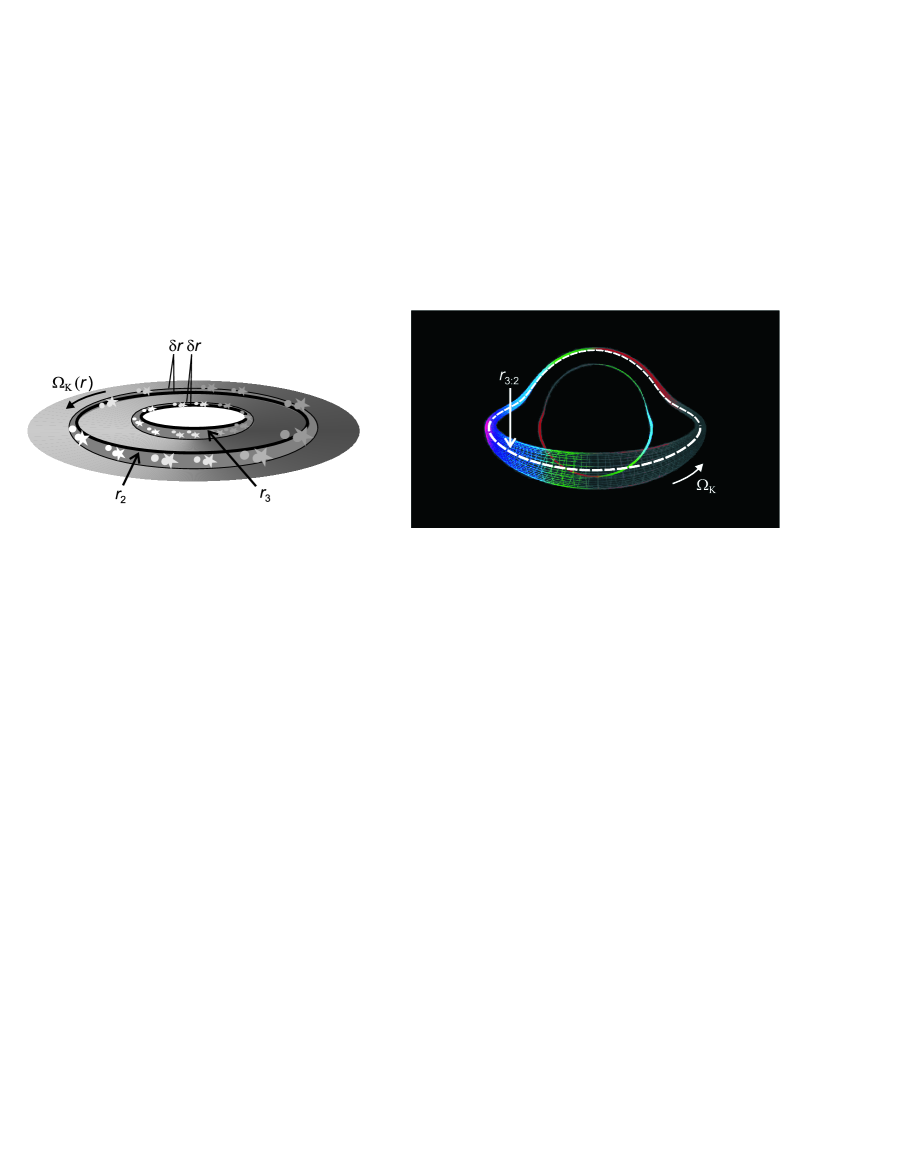
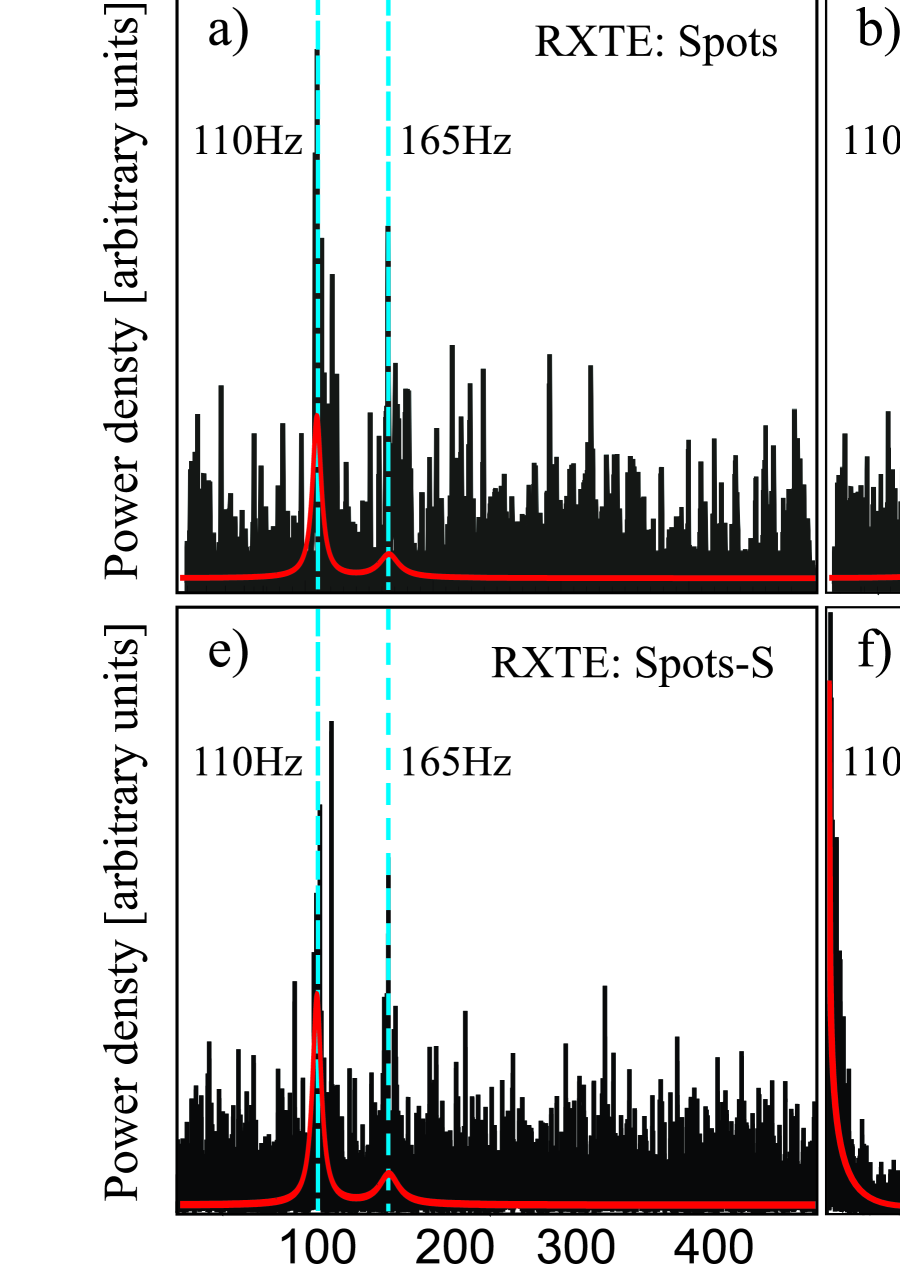
The radial distribution or drifting of the spots can clearly result in various levels of signal coherence. Nevertheless, small circular spots related to a single preferred radius do not reproduce the often observed 3:2 frequency ratio. Motivated by Karas (1999), we also consider a somewhat more complicated arbitrary scheme where the multiple spots are created and drifted around radii close to two preferred orbits with Keplerian frequencies roughly in the 3:2 ratio. These orbits are set as (radius where the radial epicyclic frequency reaches the maximum value) and (ISCO). Spots are then created within the regions with the size given by . The illustration of this scenario is shown in the left panel of Figure 6. Since we keep the same black hole mass as above, , our setup leads to the main observable frequencies around 110Hz and 160Hz (see panels a and c of Figure 7 drawn for signal fraction and ). In the following consideration we compare the PDS obtained for this setup to the PDS resulting from the model of the oscillating optically thin torus slowly drifting through the resonant radius .
For the torus kinematics we assume the radial and vertical oscillations with equal intrinsic amplitudes. The possible QPO origin in the resonances between this or similar disc oscillation modes has been extensively discussed in works of Abramowicz & Kluźniak (2001), Abramowicz et al. (2003a, b), Kluźniak et al. (2004), Horák (2005), Török et al. (2005), and several other authors. Here we adopt the concept previously investigated by Bursa et al. (2004) who focused on optically thin torus with slender geometry.
The visual appearance of torus influenced by lensing and Doppler effects is illustrated in the right panel of Figure 6. The periodic changes of the observed luminosity are partially governed by the radial oscillations due to changes of the torus volume while the vertical oscillations modulate the flux just due to lensing effects in the strong gravitational field. The contribution of the two individual oscillations to the variations of the observed flux thus strongly depends on the inclination angle (see also Mazur et al., 2013). Here we set where the fractions of the power in the two observed peaks are comparable. We set the black hole mass and , implying that the two oscillatory frequencies are Hz and Hz. Assuming this setup we produce torus drift lightcurves for the interval . The resulting PDS drawn for signal fraction is included in Figure 7 (panels b and d). We note that similar PDS can be reached assuming e.g. a near extreme rotating black hole with and .
Using Figure 7 we can finally confront the predictions for spots drifted around preferred radii to those expected for the oscillating torus slowly passing the resonant orbit . Inspecting this Figure, we can find that the RXTE PDS obtained for the given setup of the two models are rather similar. On the other hand, the LOFT PDS reveal the presence/absence of the harmonics in addition to the 3:2 peaks.
3.2 Other examples of the harmonic signature of spot motion
Higher harmonics should appear in the signal generated by small spots in various situations. In next we justify their possible detectability assuming two more examples of the spot motion.
Panels e and g of Figure 7 marked as “Spots-S” include PDS resulting for the group of 200 stationary spots (). These spots were spatially distributed around the two orbits and assuming a superposition of Gaussian radial distributions of deviations and random orbital phases. In contrary, panels f and h of the same Figure marked as “Spots-T” assume a non-stationary situation with spots that repetitively appear only at the two preferred radii and (). The spots were created with long delays with respect to their random lifetimes. These were much shorter than the integration time of the simulation. Apparently, in both chosen examples we can find harmonics representing the signature of the spot motion.
Inspecting the Spot-S and Spot-T situations we have found clear harmonics in the expected amplitude spectra for any choice of the model parameters. Nevertheless, we note that their detectability in the observational PDS was not high in all cases. Moreover, as illustrated in the case of Spots-T, various models can produce strong noise at low frequencies.
Detailed elaboration of the question which setup guarantess the detectability of the harmonics thus requires a full study of the related (rich) parameter space. We do not intend to make such a study in this work, but it should be discussed elsewhere.
4 Discussion and Conclusions
We identified the signatures of the spot motion mostly with the harmonic content of the observable signal. Remarkably, for large inclination angles, the LOFT observations could easily reveal the Keplerian frequency together with its first and second harmonics when the strongest (but still very weak) single signal is around the limits of the RXTE detectability. Nevertheless, the radial epicyclic frequency could be also found providing that the inclination is small. In our analysis we have paid attention to the timing signatures of the motion of small circular spots radiating isotropically from the slightly eccentric geodesic orbits. The case of highly eccentric orbits and/or spot having large azimuthal shear will be presented elsewhere.
The comparison between spot and torus models in Section 3 has been obtained for specific kinematic models. Its general validity is thus limited. For instance, a consideration of resonance driven effects or torus geometrical thickness could also give rise to some harmonic content in the signal from the oscillating tori. Despite these uncertainties, the elaborated comparison indicates clearly that the increased sensitivity of the proposed LOFT mission can be crucial for resolving the QPO nature.
Acknowledgments
We acknowledge the support of the Czech grant GAČR 209/12/P740, Polish grant NCN UMO-2011/01/B/ST9/05439 and the Swedish VR grant. We further acknowledge the project CZ.1.07/2.3.00/20.0071 ”Synergy” aimed to support international collaboration of the Institute of physics in Opava, and the internal SU student grant SGS/11/2013. We thank to the anonymous referee for his comments and suggestions that helped to improve the paper.
References
- Abramowicz et al. (1991) Abramowicz M. A., Bao G., Lanza A., Zhang X.-H., 1991, A&A, 245, 454
- Abramowicz et al. (1992) Abramowicz M. A., Lanza A., Spiegel E. A., Szuszkiewicz E., 1992, Nature, 356, 41
- Abramowicz & Kluźniak (2001) Abramowicz M. A., Kluźniak W., 2001, A&A, 374, L19
- Abramowicz et al. (2003a) Abramowicz M. A., Bulik T., Bursa M., Kluźniak W., 2003a, A&A, 404, L21
- Abramowicz et al. (2003b) Abramowicz M. A., Karas V., Kluźniak W., Lee W. H., Rebusco P., 2003b, PASJ, 55, 466
- Alpar & Shaham (1985) Alpar M. A., Shaham J., 1985, Nature, 316, 239
- Bakala et al. (2007) Bakala P., Čermák P., Hledík S., Stuchlík Z., Truparová K., 2007, Cent. European J. of Phys., 5, 599
- Barret et al. (2005) Barret D., Kluźniak W., Olive J. F., Paltani S., Skinner G. K., 2005a, MNRAS, 357, 1288
- Barret & Vaughan (2012) Barret D., Vaughan S., 2012, ApJ, 746, 131
- Barret & Boutelier (2008) Barret D., Boutelier M., 2008, New Astron. Rev., 51, 835
- Bao, Hadrava & Oestgaard (1994) Bao G., Hadrava P., Oestgaard E., 1994, ApJ, 435, 55
- Belloni, Méndez & Homan (2005) Belloni T., Méndez M., Homan J., 2005, A&A, 437, 209
- Belloni et al. (2007) Belloni T., Homan J., Motta S., Ratti E., Méndez M., 2007, MNRAS, 379, 1, 247, e-print arXiv:0705.0793
- Bini et al. (2012) Bini D., Falanga M., Geralico A., Stella L., 2012, Class. Quantum Grav., 29, 065014
- Boutelier et al. (2009) Boutelier M., Barret D., Lin Y., Török G., 2010, MNRAS, 401, 1290, e-print arXiv:0909.2990
- Bursa et al. (2004) Bursa M., Abramowicz M. A., Karas V., Kluzniak W., 2004, ApJ, 617, L45
- Bromley, Chen & Miller (1997) Bromley B. C., Chen K., Miller W. A., 1997, ApJ, 475, 57
- Čadež, Calvani & Kostić (2008) Čadež A., Calvani M., Kostić U., 2008, A&A, 487, 527
- Cunningham (1975) Cunningham C. T., 1975, ApJ, 202, 788
- Dabrowski et al. (1997) Dabrowski Y., Fabian A. C., Iwasawa K., Lasenby A. N., Reynolds C. S., 1997, MNRAS, 288, L11
- de Felice, Nobili & Calvani (1974) de Felice F., Nobili L., Calvani M., 1974, A&A, 30, 111
- Dovčiak, Karas & Yaqoob (2004) Dovčiak M., Karas V., Yaqoob T., 2004, ApJS, 153, 205
- Feroci et al. (2012) Feroci M. et al., 2012, Exp. Astron., 34, 415
- Germana et al. (2009) Germana C., Kostič U., Čadež A., Calvani M., 2009, in AIP Conf. Proc. Vol. 1126, SIMBOL-X: Focusing on the Hard X-ray Universe: Proc. 2nd International Simbol-X Symposium, ed. J. Rodriguez & P. Ferrando (Melville, NY:AIP), p. 367
- Germana (2012) Germana C., 2013, Monthly Notices of the Royal Astronomical Society: Letters, 430, L1
- Horák et al. (2009) Horák J., Abramowicz M. A., Kluźniak W., Rebusco P., Török G., 2009, A&A, 499, 535
- Horák (2005) Horák J., 2005, Astronomische Nachrichten, 326, 824
- Jahoda et al. (1996) Jahoda K., Swank J. H., Giles A. B., Stark M. J., Strohmayer T., Zhang W., Morgan E. H., 1996, Proc. SPIE Vol. 2808, p. 59-70, EUV, X-Ray, and Gamma-Ray Instrumentation for Astronomy VII, Oswald H. Siegmund; Mark A. Gummin; Eds.
- Jahoda et al. (2006) Jahoda K., Markwardt C. B., Radeva Y., Rots A. H., Stark M. J., Swank J. H., Strohmayer T. E., Zhang W., 2006, ApJS, 163, 401
- Karas & Bao (1992) Karas V., Bao G., 1992, A&A, 257, 531
- Karas, Vokrouhlicky & Polnarev (1992) Karas V., Vokrouhlicky D., Polnarev A. G., 1992, MNRAS, 259, 569
- Karas (1996) Karas V., 1996, ApJ, 470, 743
- Karas (1999) Karas V., 1999, PASJ, 51, 317
- Kato (2007) Kato S., 2007, PASJ, 59, 451
- Kluźniak et al. (2004) Kluźniak W., Abramowicz M. A., Kato S., Lee W. H., Stergioulas N., 2004, ApJ, 603, L89
- Kostić et al. (2009) Kostić U., Čadež A., Calvani M., Gomboc A., 2009, A&A, 496, 307
- Lai et al. (2012) Lai D., Fu W., Tsang D., Horak J., Yu C., 2013, Proceedings of IAUS 290 ”Feeding Compact Objects: Accretion on All Scales”, C. M. Zhang, T. Belloni, M. Mendez & S. N. Zhang (eds.), Vol. 290, p. 57, e-print arXiv:1212.5323
- Lamb et al. (1985) Lamb F. K., Shibazaki N., Alpar M. A., Shaham J., 1985, Nature, 317, 681
- Laor (1991) Laor A., 1991, ApJ, 376, 90
- Miller, Lamb & Psaltis (1998) Miller M. C., Lamb F. K., Psaltis D., 1998, ApJ, 508, 791
- Mineshige, Takeuchi & Nishimori (1994) Mineshige S., Takeuchi M., Nishimori H., 1994, ApJ, 435, L125
- Morsink & Stella (1999) Morsink S. M., Stella L., 1999, ApJ, 513, 827
- Matt, Fabian & Ross (1993) Matt G., Fabian A. C., Ross R. R., 1993, MNRAS, 264, 839
- Mazur et al. (2013) Mazur G. P., Vincent F. H., Johansson M., Šrámková E., Török G., Bakala P., Abramowicz M. A., 2013, A&A, 554, A57, e-print arXiv:1303.3834
- Mukhopadhyay (2009) Mukhopadhyay B., 2009, ApJ, 694, 387
- McClintock & Remillard (2006) McClintock J. E, Remillard R. A., 2006, astro-ph/0306213
- Paltani et al. (2004) Paltani S., Barret D., Olive J. F., Skinner G. K., SF2A-2004: Semaine de l’Astrophysique Francaise, meeting held in Paris, France, June 14-18, 2004. Edited by F. Combes, D. Barret, T. Contini, F. Meynadier and L. Pagani. Published by EdP-Sciences, Conference Series, 2004, p. 381
- Pecháček, Karas & Czerny (2008) Pecháček T., Karas V., Czerny B., 2008, A&A, 487, 815
- Pétri (2005) Pétri J., 2005, A&A, 439, L27
- Psaltis et al. (1999) Psaltis D. et al., 1999, ApJ, 520, 763
- Rezzolla, Yoshida & Zanotti (2003) Rezzolla L., Yoshida S., Zanotti O., 2003, MNRAS, 344, 978
- Schnittman & Bertschinger (2004a) Schnittman J. D., Bertschinger E., 2004a, ApJ, 606, 1098
- Schnittman & Bertschinger (2004b) Schnittman J. D., Bertschinger E., 2004b, X-RAY TIMING 2003: Rossie and Beyond. AIP Conference Proceedings, Vol. 714, p. 40
- Šrámková, Torkelsson & Abramowicz (2007) Šrámková E., Torkelsson U., Abramowicz M. A., 2007, A&A, 467, 641
- Stella & Vietri (1998a) Stella L., Vietri M., 1998a, in Abstracts of the 19th Texas Symposium on Relativistic Astrophysics and Cosmology, ed. J. Paul, T. Montmerle, & E. Aubourg (Saclay, France:CEA)
- Stella & Vietri (1998b) Stella L., Vietri M., 1998b, ApJ, 492, L59
- Stella & Vietri (1999) Stella L., Vietri M., 1999, Phys. Rev. Lett., 82, 17
- Stella & Vietri (2002) Stella L., Vietri M., 2002, in The Ninth Marcel Grossmann Meeting, Proc. MGIXMM Meeting held at The University of Rome ”La Sapienza”, 2000 July 2-8, ed. V. G. Gurzadyan, R. T. Jantzen, & R. Ruffini, Part A, p. 426
- Stella, Vietri & Morsink (1999) Stella L., Vietri M., Morsink S. M., 1999, ApJ, 524, L63
- Stuchlík & Bao (1992) Stuchlík Z., Bao G., 1992, Gen. Relativ. and Gravitation, 24, 945
- Stuchlík et al. (2008) Stuchlík Z., Konar S., Miller J. C., Hledík S., 2008, A&A, 489, 963
- Titarchuk & Wood (2002) Titarchuk L., Wood K., 2002, ApJ, 577, L23
- Török et al. (2005) Török G., Abramowicz M.A., Kluźniak W., Stuchlík Z., 2005, A&A, 436, 1
- Török et al. (2008a) Török G., Bakala P., Stuchlík Z., Čech P., 2008a, Acta Astronomica, 58, 1
- Török et al. (2008b) Török G., Abramowicz M. A., Bakala P., Bursa M., Horák J., Kluźniak W., Rebusco P., Stuchlík Z., 2008b, Acta Astronomica, 58, 15, e-print arXiv:0802.4070
- Török et al. (2008c) Török G., Abramowicz M. A., Bakala P., Bursa M., Horák J., Rebusco P., Stuchlík Z., 2008c, Acta Astronomica, 58, 113, e-print arXiv:0802.4026
- Török (2009) Török G., 2009, A&A, 497, 661
- van der Klis (2006) van der Klis M., 2006, in Compact Stellar X-Ray Sources, ed. W. H. G. Lewin & M. van der Klis (Cambridge: Cambridge Univ. Press), 39, see also astro-ph/0410551
- Viergutz (1993) Viergutz S. U., 1993, A&A, 272, 355
- Vincent, Gourgoulhon & Novak (2012) Vincent F. H., Gourgoulhon E., Novak J., 2012, Class. Quantum Grav., 29, 245005
- Wang et al. (2013) Wang D. H., Chen L., Zhang C. M., Lei Y. J., Qu J. L., 2013, e-print arXiv:1301.5478
- Wagoner (1999) Wagoner R. V., 1999, Phys. Rep., 311, 259
- Wagoner, Silbergleit & Ortega-Rodr guez (2001) Wagoner R. V., Silbergleit A. S., Ortega-Rodr guez M., 2001, ApJ, 559, L25
- Zakharov (1994) Zakharov A. F., 1994, MNRAS, 269, 283
- Zhang (2005) Zhang, C. M., 2005, Chin. J. Astron. Astrophys., 5, 21