Magnified Views of the Ultrafast Outflow of the = 1.51 AGN HS 0810+2554
Abstract
We present results from an observation of the gravitationally lensed narrow absorption line AGN HS 0810+2554 performed with the Chandra X-ray Observatory. The factor of 100 lensing magnification of HS 0810+2554 makes this source exceptionally bright. Absorption lines are detected at rest-frame energies of 7.7 keV and 11.0 keV at 97% significance. By interpreting these lines to arise from highly ionized iron the implied outflow velocities of the X-ray absorbing gas corresponding to these lines are 0.13 and 0.41, respectively. The presence of these relativistic outflows and the absence of any significant low-energy X-ray absorption suggest that a shielding gas is not required for the generation of the relativistic X-ray absorbing winds in HS 0810+2554. UV spectroscopic observations with VLT/UVES indicate that the UV absorbing material is outflowing at 0.065 . Our analysis indicates that the fraction of the total bolometric energy released by HS 0810+2554 into the IGM in the form of kinetic energy is = 1.0. An efficiency of greater than unity implies that magnetic driving is likely a significant contributor to the acceleration of this X-ray absorbing wind. We also estimate the mass-outflow rate of the strongest absorption component to be = 1.1 M⊙ yr-1. Assuming that the energetic outflow detected in the NAL AGN HS 0810+2554 is a common property of most AGN it would suggest that the X-ray absorbing wind may have a larger opening angle than previously thought. This has important consequences for estimating the feedback contribution of X-ray absorbing winds to the surrounding IGM.
Subject headings:
galaxies: formation — galaxies: evolution — quasars: absorption lines —X-rays: galaxies —intergalactic medium1. INTRODUCTION
UV spectroscopic observations have revealed highly blueshifted intrinsic narrow absorption lines (NALs; FWHM 500 km s-1) in several quasars implying outflow velocities of up to 60,000 km s-1 (e.g., Hamann, et al. 1997; Narayanan, et al. 2004; Simon et al. 2012). NAL outflows are common in Type I AGN, occurring in 50% of cases (Misawa et al. 2007). They may be present in all AGN but only detected in those cases where our line of sight intersects the outflowing absorbing stream. Most of our current understanding of the physical and kinematic structure of NALs stems from UV studies of the velocity profiles of absorption lines that appear blueward of resonance UV emission lines. Little is presently known about the properties of these absorption line systems in the X-ray band.
Quasars with troughs 2000 km s-1 at 10% depth below the continuum are traditionally referred to as BAL quasars (Weymann et al. 1991). BAL quasars are known to be heavily absorbed in X-rays with intrinsic column densities in the range 1023 – 1024 cm-2 (Green & Mathur 1996; Gallagher et al. 2002).
Our X-ray survey of NAL AGN with fast outflows of UV absorbing material (Chartas et al., 2009a) has revealed a remarkable X-ray bright object; the = 1.51 gravitationally lensed AGN HS 0810+2554 was detected in a 5 ks observation with a 2–10 keV observed flux of 8.310-13 erg s-1 cm-2. Its spectrum shows significant blueshifted high energy absorption lines implying the presence of a massive and ultrafast X-ray absorbing wind with up to 0.41 (see §3.1). UV spectroscopic observations with VLT/UVES indicate that the UV absorbing material of HS 0810+2554 is outflowing at 19,400 km s-1 (see §3.2; Culliton et al. in prep.). The only other quasar detected to date with similar blueshifted X-ray absorption features and a NAL outflow is the unlensed =2.74 NAL quasar HS 1700+6414 (Lanzuisi et al. 2012) which, however, has a much lower 2–10 keV flux of 3–910-14 erg s-1 cm-2. HST observations of HS 0810+2554 with STIS revealed the quadruple lensed nature of this object (Reimers et al. 2002). Asseff et al. (2011) have modeled the HS 0810+2554 gravitational lens system and estimated a magnification factor of about 100. Assuming this magnification, HS 0810+2554 is a border line Seyfert/Quasar with an unlensed 2–10 keV luminosity of 5.81043 erg s-1. Observations of the AGN HS 0810+2554 therefore provide us with the rare opportunity to spectroscopically study in detail the relativistic outflow of a low-luminosity NAL AGN near the peak of the galaxy merger number density and cosmic AGN activity and address many important science questions related to the nature of ultrafast ( 104 km s-1) AGN outflows and their importance for feedback.
The X-ray absorption lines detected in HS 0810+2554 are similar to those found in other high- quasars (i.e., APM 08279+5255, Chartas et al. 2002; PG 1115+080, Chartas et al. 2003; and HS 1700+6416, Lanzuisi et al. 2012). The inferred hydrogen column densities of 1022–1023 cm-2 and near-relativistic velocities of these outflowing X-ray absorbers imply mass-outflow rates that are comparable to their estimated accretion rates. Systematic studies of the X-ray spectra of large samples of Seyferts (Tombesi, et al. 2010; Gofford et al. 2013) have revealed ultrafast outflows in 40 % of these samples.
The mechanism responsible for the acceleration of the X-ray absorbing material to near-relativistic velocities is currently debated. The two main proposed mechanisms are radiation and magnetic driving (e.g., Murray et al. 1995a, 1995b; Proga et al. 2000, 2004; Konigl & Kartje 1994; Everett 2005, 2007; Fukumura et al. 2010, 2013). In the radiation driving mechanism, radiation from the accretion disk and possibly corona accelerate accretion disk material to near-relativistic speeds through Compton scattering, bound-free and bound-bound transitions. In the magnetic driving mechanism, acceleration of the X-ray absorbers is due to magneto-centrifugal forces generated by the rotation of the accretion disk and/or magnetic pressure forces. The wind acceleration may be produced by both magnetic and radiation driving mechanisms with their contributions varying as a function of distance from the black hole. A crucial ingredient of the radiation driving mechanism is the postulated shielding gas (i.e., Murray et al. 1995) that prevents the outflowing gas from being over-ionized by radiation from the central source. The strength of the radiative driving force depends critically on both the column density of the shield and its ionization level (Chelouche & Netzer 2003; Chartas et al. 2009b, Saez & Chartas 2011). The large intrinsic hydrogen column densities inferred in X-ray observations of BAL quasars have been proposed to represent the shielding gas (Gallagher et al. 2002, 2006) that is critical in the acceleration of the UV absorbing and X-ray absorbing gas. However, the low-to-medium S/N of available X-ray spectra of BAL quasars has made it difficult to place useful constraints on the ionization properties of the X-ray absorbing gas in BAL quasars.
With a magnification factor of 100, HS 0810+2554 is among the X-ray brightest distant AGN for which, as shown in the analysis below, we have detected a relativistic outflow of X-ray absorbing material. In §2 we present the spectral and spatial analysis of HS 0810+2554 and a nearby galaxy group that contributes to the lensing, in §3 we discuss the properties of the outflow and provide a test for the presence of a shielding gas, and in §4 we present a summary of our conclusions. Throughout this paper we adopt a flat cosmology with = 67 km s-1 Mpc-1, = 0.69, and = 0.31, based on the Planck 2013 results (Planck Collaboration et al. 2013). The resulting luminosity distance to HS 0810+2554 is 11,405 Mpc.
2. X-RAY OBSERVATION AND DATA ANALYSIS
HS 0810+2554 was observed with the Advanced CCD Imaging Spectrometer (ACIS; Garmire et al. 2003) on board the Chandra X-ray Observatory (hereafter Chandra) on 2002 January 30, with an effective exposure time 4894 sec. The pointing of the telescope placed HS 0810+2554 on the back-illuminated S3 chip of ACIS. The Chandra observation of HS 0810+2554 was analysed using the CIAO 4.5 software with CALDB version 4.5.5.1 provided by the Chandra X-ray Center (CXC). We used standard CXC threads to screen the data for status, grade, and time intervals of acceptable aspect solution and background levels. To improve the spatial resolution we employed the sub-pixel resolution technique developed by Li et al. (2004) and incorporated via the Energy-Dependent Subpixel Event Repositioning (EDSER) algorithm into the tool acis_process_events of CIAO 4.5.
The Chandra spectrum of HS 0810+2554 was fit with a variety of models
employing XSPEC version 12 (Arnaud 1996).
For all spectral models of HS 0810+2554 we
included Galactic absorption due to neutral gas (Dickey & Lockman 1990) with a column density of
= 3.94 1020 cm-2.
2.1. Spatial and Spectral Analysis of HS 0810+2554
We perform a spatial analysis of the Chandra observation of HS 0810+2554 by fitting the
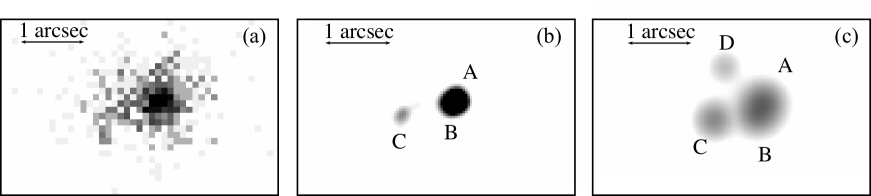
lensed images (see Figure 1) simultaneously using the relative astrometry derived from HST images
(Morgan et al. 2006) and MARX models (Wise et al. 1997) of the PSF.
We fit the data using 00246 bins (compared to the 0491 ACIS pixel scale)
by minimizing the -statistic (Cash 1979) between the observed and model images.
The PSF fitting method provided the best fit value and errors for the number of counts in each image, and
, respectively. We define as
to be the total counts of all four images (A, B, C, and D) from the PSF fitting method.
While the PSF models should correctly recover the relative fluxes, errors in the PSF models may bias the total fluxes. We corrected for this by renormalizing the total counts to match the total counts found in a 5′′ radius region centered on the lens with a background correction based on an annulus from 75 to 50′′ around the lens. Specifically, the counts from each image as determined from the PSF fitting method were renormalized to = R, where R = / and is the total counts from the aperture method. Table 1 lists the observation date, the observational identification number, the exposure time, and the counts (in the 0.2–10 keV band) of each image.
Figure 1 shows a binned image, a deconvolved image and the best-fit PSF model of the Chandra observation of HS 0810+2554.
For the deconvolution we applied the Richardson-Lucy algorithm (Richardson 1972; Lucy 1974)
and supplied a point spread function (PSF) created by the simulation tool MARX (Wise
et al. 1997). Images A and B are not resolved, while image C is resolved in the deconvolution. Image D is likely too faint to
be reconstructed in the deconvolution.
The inferred 0.210 keV flux ratios of HS 0810+2554 from the best-fit PSF model are
(A/D)X-ray = (8.5 2.2), (B/D)X-ray = (7.0 2.0), and (C/D)X-ray = (4.2 1.1).
For comparison, the optical HST Vband flux ratios of HS 0810+2554 are
(A/D)V-band = 11.5 0.6, (B/D)V-band = 5.6 0.8, and (C/D)V-band = 4.0 0.6.
The X-ray and optical flux ratios are consistent within errors albeit obtained during different epochs.
This consistency implies that no significant magnification due to possible microlensing produced by stars in the lens galaxy is present
during the X-ray observation in addition to the magnification of 100 that is produced by the gravitational potential of the lens.
The X-ray counts in the soft (0.2–2 keV) and hard (2–10 keV) bands for the combined images of HS 0810+2554 are 545 23 and 164 13, respectively. The X-ray counts were extracted from a circle of radius 5 arcsec centered on the mean location of the images. The backgrounds were determined by extracting events within an annulus centered on the mean location of the images with inner and outer radii of 10 arcsec and 50 arcsec, respectively. The extracted spectra were grouped to obtain a minimum of 10 counts in each energy bin, close to the minimum required number of counts per bin for to be statistically valid (e.g., Cash 1979; Bevington & Robinson 2003). We chose this grouping to satisfy this requirement and to allow the maximum spectral resolution for the low S/N spectrum of HS 0810+2554. To test the validity of the use of statistics in our analysis for our selected grouping of the data we also used the -statistic (Cash 1979)111The spectra were binned to have at least one count per bin. that does not have this limitation in binning the data. The results obtained from fitting the data with and -statistics are consistent within the estimated error bars. This provides additional support to the validity of our spectral fitting results. In the remaining of the paper we use the results from fits to the spectrum of HS 0810+2554 that employ the -statistic (unless mentioned otherwise).
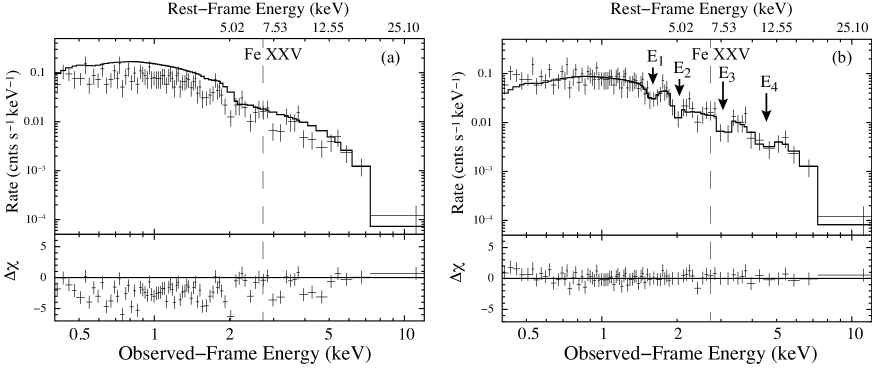
We performed fits to the spectrum of HS 0810+2554 using events in the 0.35–10 keV energy range with a variety of models of increasing complexity. The minimum rest-frame energy of events included in our analysis is therefore 0.89 keV. The fit residuals show significant absorption at observed-frame energies of 1–5 keV. To illustrate the presence of these features we fit the spectra in the observed-frame 5–10 keV band with a power-law model (modified by Galactic absorption) and extrapolated this model to the energy ranges not fit (see Figure 2). We proceed in fitting the following models to the data guided by the shape and location of identified absorption residuals located at observed-frame energies of 1–5 keV: 1) power-law modified by neutral intrinsic absorption (APL), 2) power-law modified by ionized intrinsic absorption (IAPL), 3) power-law modified by neutral intrinsic absorption and four absorption lines (APL + 4AL), and 4) power-law modified by neutral intrinsic absorption and two outflowing intrinsic ionized absorbers (APL + 2IA).
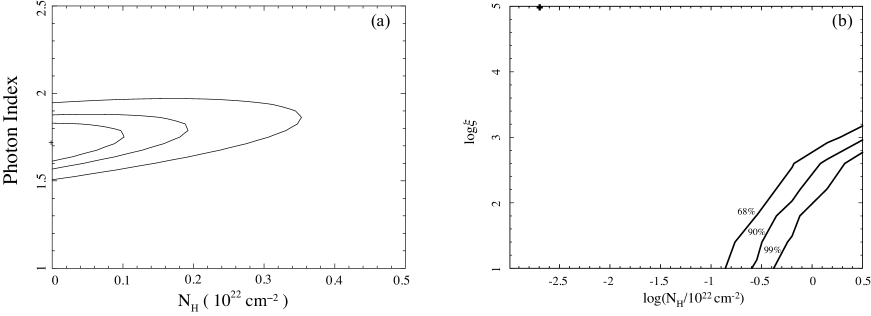
The results from fitting these models to the Chandra spectrum of HS 0810+2554 are presented in Table 2. No significant intrinsic neutral absorption is detected with fits using the APL model and we find intrinsic NH 1.2 1021 cm-2 at the 99% confidence level. In Figure 3 we show the 68%, 90% and 99% confidence contours of the intrinsic hydrogen column density, NH versus the photon index assuming model 1 of Table 2.
It is possible that an intrinsic absorber is ionized and was therefore difficult to detect in the 5 ks Chandra spectrum. With the IAPL model we investigated the presence of a possible mildly ionized intrinsic absorber that could affect the low-energy (1 keV observed-frame) continuum X-ray emission. Ionized absorbers have been postulated to provide shielding and prevent the outflowing gas from being over-ionized (i.e., Murray et al. 1995). Fits using the IAPL model do not provide useful constraints of the column density in the case of ionized absorption at the redshift of the source (see Figure 3). While the IAPL model provides an acceptable fit to the spectrum it does not provide any significant improvement over the APL model. The inclusion of four Gaussian absorption lines near the absorption features in the APL 4AL model (see Figure 2) resulted in a significant improvement of the fit compared to the fit using the APL model at the 99.3% confidence level (according to the -test). Specifically, the spectral fits indicate a change of per change in degrees of freedom of = 20.3/12 and a change of the -statistic per change in degrees of freedom of = 23/12. Protassov et al. (2002), argued that the -test cannot be applied when the null values of the additional parameters fall on the boundary of the allowable parameter space. They proposed a Monte Carlo approach to determine the distribution of the F statistic. We followed this approach and constructed the probability density distribution of the -statistic between spectral fits of models 1 and 3 of Table 2. Our Monte Carlo simulations indicate that the probability of obtaining an value of 2.6 or greater is 5 10-3 similar to the result found by using the analytic expression for the distribution of the -statistic. The best-fit observed-frame energies of the four Gaussian absorption lines are = 1.6 keV, = 2.0 keV, = 3.1 keV, and = 4.5 keV (see Table 2).
We also investigated the improvement in the spectral fits of adding one Gaussian absorption line at a time. The inclusion of one Gaussian absorption line near each of the four absorption features, resulted in a slight improvement of the fit compared to the fit using the APL model. Specifically, we find a change of per change in degrees of freedom of = 5.19/2 for including a line near , = 4.20/2 for including a line near , = 4.15/2 for including a line near , and = 4.60/2 for including a line near . The respective -values and the probabilities of obtaining values equal to or larger than these values indicated by our Monte Carlo simulations are =3.1, =0.1 for ,=2.5, =0.1 for , =2.4, =8 10-2 for , and =2.7, =0.1 for .
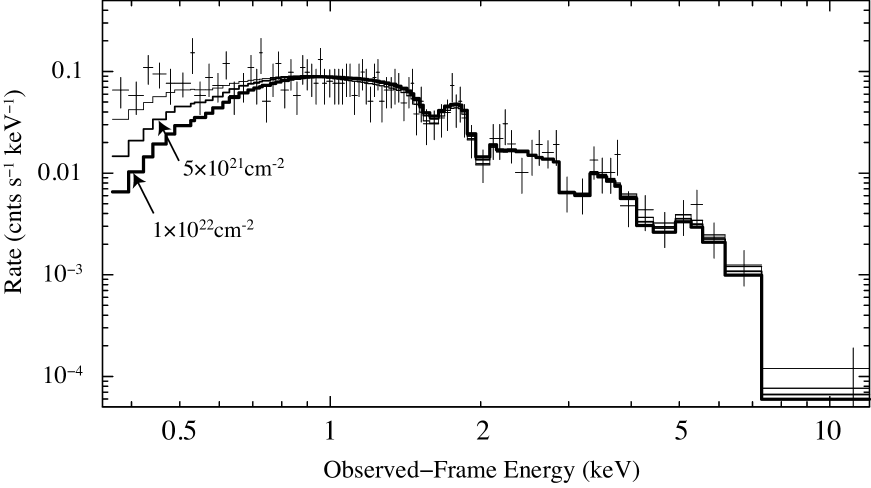
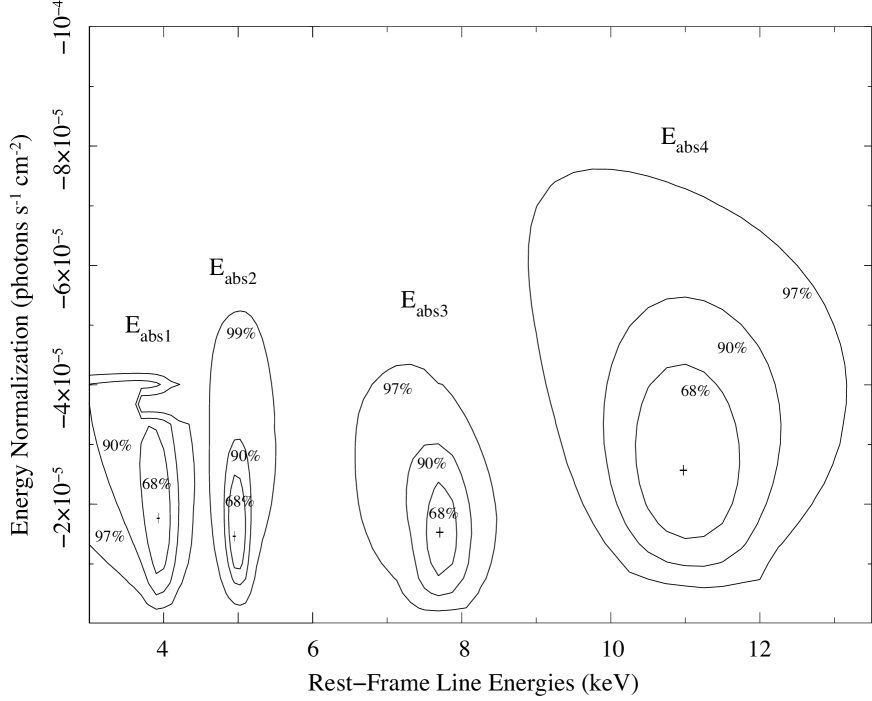
No significant intrinsic neutral absorption is detected with fits using the APL 4AL model and we find intrinsic NH 0.93 1021 cm-2 at the 99% confidence level, similar to the best-fit value of model 1. To further test the robustness of our upper limit of the intrinsic neutral hydrogen column density, we took the best-fit model 3 of Table 2 and forced the intrinsic column density to have a fixed value of for case 1 and for case 2, and redid the spectral fits for each case. In Figure 4 we show the best-fit models for each case over-layed with the best-fit model where was allowed to be a free parameter. Figure 4 clearly shows that the hydrogen column densities assumed for cases 1 and 2 would lead to poor fits with significant residuals in the 0.35–0.8 keV observed-frame energy band. We conclude that our upper limit of the intrinsic hydrogen column density (assuming model 3 of Table 2) is robust. In Figure 5, we show the confidence contours of the rest-frame absorption line energies versus normalization of components abs1 ( = 3.94 keV), abs2 ( = 4.96 keV), abs3 ( = 7.74 keV), and abs4 ( = 11.0 keV) based on spectral fits that use the APL + 4AL model. The 99% confidence contours, of , , and are erratic and not closed at the 99% level and are therefore not displayed for clarity.
The number of background counts in the 5′′ source extraction circle are 3 counts in the 0.3-10 keV
energy range and 0.3 counts in the 1.5 - 5 keV range. We conclude that background subtraction is not the origin of
the four detected absorption lines in the 1.5 – 5 keV energy range.
There are several ACIS instrumental spectral features that fall near the observed-frame absorption line energies of
= 1.57 kV and = 1.98 kV. Specifically, an Al K absorption edge at 1.56 keV from the ACIS
optical blocking filters and Ir M edge of the Chandra X-ray mirrors at 2.085 keV.
We note, however, that the detected lines are too strong (see Table 2)
to be instrumental features and are not consistent with being absorption edges.
Specifically, we also modeled the four absorption features as absorption
edges using the zedge command in XSPEC.
The spectral fits using absorption lines were better than fits that used
absorption edges, with a change of per
change in degrees of freedom of = 10.75/1, corresponding to a
-statistic of 18.6.
Our Monte-Carlo simulations indicate that the probability of obtaining an value of
18.6 or greater is 1.3 10-2 slightly larger than the value found
by the analytic expression for the distribution of the F-statistic.
The identification of the absorption lines at and is ambiguous
and mostly speculative partly due to the detected rest-frame energies of the lines being below 6.7 keV,
the low S/N of the current spectrum and the relatively low-energy resolution available.
The identification of the absorption lines at and is less ambiguous because of their
detected rest-frame energies being above 6.7 keV.
Specifically, the high energy absorption lines that are likely associated with highly ionized iron are detected at rest-frame energies of
= 7.74 keV and = 11.0 keV at 97% significance.
The best-fit results from the APL + 4AL model are used to identify the most significant absorption lines in HS 0810+2554 and provide a guide to fit an XSTAR photoionization model (APL + 2IA) containing two velocity systems to the spectrum
of HS 0810+2554. Specifically, as our final refinement (model APL + 2IA) we model two of the high energy absorption features ( and )
using the warm-absorber model XSTAR (Kallman et al. 1996; Kallman & Bautista 2001).
XSTAR calculates the physical conditions, and emissionabsorption spectra of photoionized gases.
In the current analysis we use an implementation of the XSTAR model that can be used within
XSPEC.
Our fits with XSTAR indicate an outflowing X-ray absorbing medium with
ionization parameters222Throughout this paper we
adopt the definition of the ionization parameter of Tarter et al. (1969) given by
, where is the hydrogen number
density, and is the source-cloud separation.
of components abs3 and abs4 of erg cm s-1
and erg cm s-1, respectively, assuming a = 2 ionizing continuum (model 4 of Table 2).
Of all the abundant elements, iron absorption lines would be the closest in energy to the observed features.
In this sense, our interpretation that the absorption lines are associated with highly ionized Fe K absorption is the most
conservative one possible (e.g., absorption lines from relativistic sulfur or oxygen would require much larger blueshifts).
A detailed justification of our interpretation that the high-energy absorption
is due to lines arising from highly ionized Fe xxv is provided in
related studies presented in Chartas et al. (2002, 2003, 2007) and Saez et al. (2007, 2011).
The two strongest iron lines for this highly ionized absorbing medium have rest (or laboratory)
energies of 6.70 keV (Fe xxv ) and 6.97 keV
(Fe xxvi ). In general the Fe xxv
line will be stronger than the Fe xxvi line for a
medium with
assuming an incident power-law spectrum with a photon index similar to the one inferred from fits using the APL + 2IA model
(see also Figure 3 of Saez et al. 2009).
For our spectral analysis we use the photo-ionization model XSTAR for the IAPL and
APL + 2IA models. We have selected to use the analytic XSTAR model warmabs
instead of the XSTAR table models. According to the
XSTAR manual there are many advantages regarding accuracy and flexibility of using the analytic
XSTAR model instead of the XSTAR table model (Kallman & Bautista 2001).
We emphasize, however, that the photo-ionization model used in our analysis
does not consider possible velocity gradients in the outflowing absorber and therefore
cannot provide realistic models of the X-ray absorption lines.
We attempt to mimic the velocity broadening of the lines by introducing in the
XSTAR warmabs model large turbulent velocities.
By introducing a turbulent velocity in warmabs,
the absorption line shapes are assumed by XSTAR to be Gaussian with
energy widths corresponding to the input turbulent velocity.
We performed several fits using warmabs
where we allowed the turbulence velocity to vary and found best-fit values of
10,000 km s-1 for component abs3 and
20,000 km s-1 for component abs4.
Since there are several atomic transitions at slightly different energies
in addition to the strongest atomic transitions of Fe xxv 1s21s2p and Fe xxv 1s21s2p (e.g., see figure 3 of Chartas et al. 2009)
we expect the best-fit values of the turbulent velocities to be slightly smaller than the velocity broadening inferred when
the features are modeled with only one absorption line as in model 3 of Table 3.
This is indeed what we find. Specifically, the widths of 300 eV and 970 eV (from model 3 using -statistic
of Table 2) correspond to velocity widths of 11,600 km/s and 26,000 km/s, respectively.
The velocity widths used in the warmabs model are therefore consistent within errors
to the velocity widths implied by fits of single Gaussians to the absorption lines.
However, because of the low S/N of the Chandra spectrum of HS 0810+2554, the
turbulent velocities, are not well constrained.
For the error analysis of the remaining variables of model 4 of Table 3 we
therefore froze the turbulent velocities to = 10,000 km/s and
= 20,000 km s-1.
If we interpret the absorption
lines at rest-frame energies of 7.7 keV
and 11.0 keV as being due to Fe, the most
conservative assignments (giving the lowest outflowing velocity) are to
highly ionized Fe xxv which requires and/or highly ionized Fe xxvi which requires ,
assuming an incident power-law spectrum with a photon index similar to the observed one.
In our spectral fits using the XSTAR photoionization code we are able to match the observed absorption lines at Eabs3 and Eabs4 as Fe xxv outflowing at and , respectively (see §3.1 for details). If we allow the abundance of S to be a free parameter in the modeled outflow we are able to match the observed absorption line at Eabs1 as arising from highly ionized S xv () (but at an abundance of the solar value) outflowing at the same velocity of as the abs4 component. We note that a detailed analysis of the physical conditions of intrinsic narrow absorption line systems in three quasars at by Wu et al. (2010) finds S to be overabundant relative to the Sun, consistent with our observations.
We note that the identification of the absorption lines abs1 and abs2 are not unambiguous in our spectral analysis due to the low CCD energy resolution and the fact that there are many possible absorption lines that fall in this energy range (see Figure 3 of Chartas et al. 2007). An X-ray spectrum of HS 0810+2554 with higher S/N and energy resolution will be required to identify the absorption lines abs1 and abs2. Our photoionization APL + 2IA model, that includes two outflowing components, does not indicate any clear absorption feature at Eabs2. One possibility is that the absorption line at Eabs2 is produced by a third outflow or inflow component, however, deeper follow-up X-ray observations are required to identify the origin of this spectral feature. The spectra of the lensed images of HS 0810+2554 represent different epochs separated by the time-delays between images. A deeper Chandra observation can provide spatially resolved and time-resolved spectra of the images (A+B), C, and D, thus constraining the properties of the outflow in individual images. AGN with relativistic outflows and with similar black hole masses show variability of the X-ray absorption lines on timescales as short as 10 ks (e.g., Chartas et al. 2007; Giustini et al. 2011; and Lanzuisi et al., 2012). We thus expect variability of the high-energy absorption lines of HS 0810+2554 over similar timescales. A longer observation will therefore provide insight into the variability of the properties of the outflow in individual images. Our simulations based on the 5 ks Chandra observation of HS 0810+2554 indicate that a deeper 100 ks Chandra observation will provide a significant detection of the outflow at the 99.99% level and result in improved constraints of the outflow properties in images (A+B) and C and a detection of the blueshifted absorption lines in image D as well. For example, a 100 ks Chandra observation would result in the reduction of the uncertainties of the detected energies of the absorption lines by factors ranging between 2 and 4.
The column densities of the outflowing ionized components abs3 and abs4 (model 3 of Table 2) are NHabs3 = 1023 cm-2 and NHabs4 = 1023 cm-2, respectively. For comparison, the typical column densities of outflowing X-ray absorbing material in BALs range between 1023 cm-2 and 1024 cm-2 (e.g., Chartas et al., 2009b). The column density of outflowing X-ray absorbing material in the NAL quasar HS 1700+6416 was found to be 3 1023 cm-2 (Lanzuisi et al. 2012).
2.2. Spatial and Spectral Analysis of the Group of Galaxies Near HS 0810+2554
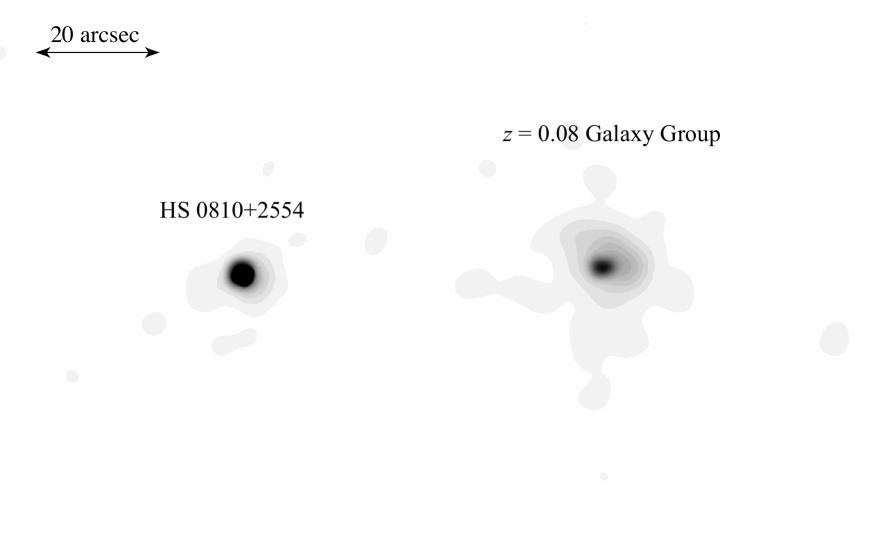
In Figure 6 we show the Chandra image of the lensed system HS 0810+2554 and the surrounding field. The image was binned with a bin size of 0.1 arcsec and adaptively smoothed with the CSMOOTH tool developed by Ebeling et al. (2000). CSMOOTH smooths a two-dimensional image with a circular Gaussian kernel of varying radius. The binned data were smoothed using minimum and maximum smoothing scales of 005 and 10′′, respectively. We detect extended X-ray emission centered at RA = 8 13 27, Dec = 25 45 4.5 (J2000), approximately 58′′ west of HS 0810+2554. The diffuse X-ray emission detected 58′′ west of the lens is likely associated with a group of galaxies based on our analysis of the spectrum of the extended X-ray emission presented below. The NASA/IPAC Extragalactic Database (NED) lists nine 0.08 galaxies within a separation of 5′ of the lensing galaxy, one of which is separated by 9′′ from the center of the extended X-ray emission. The overdensity of galaxies near the center of the extended X-ray emission supports our hypothesis that the extended X-ray emission centered 58′′ west of the lens is associated with a group of galaxies at . It is likely that the lensing galaxy is also a member of this group of galaxies.
We fit the emission from the foreground group
using a model for the group brightness profile (e.g., Jones & Forman 1984) combined with a uniform background
of 0.005 events per pixel. Prior to performing the fit
we binned the image in 05 pixels.
The fits were performed with the CXC software package SHERPA.
We find that the group center is = 581 west
and = 13 north of the center of HS 0810+2554.
The intensity distribution is nearly round
with an ellipticity of 0.15 0.09.
The best-fit values for and the core radius of the group
are = 0.20 0.01 and r0 = 49 (7.3 kpc),
respectively.
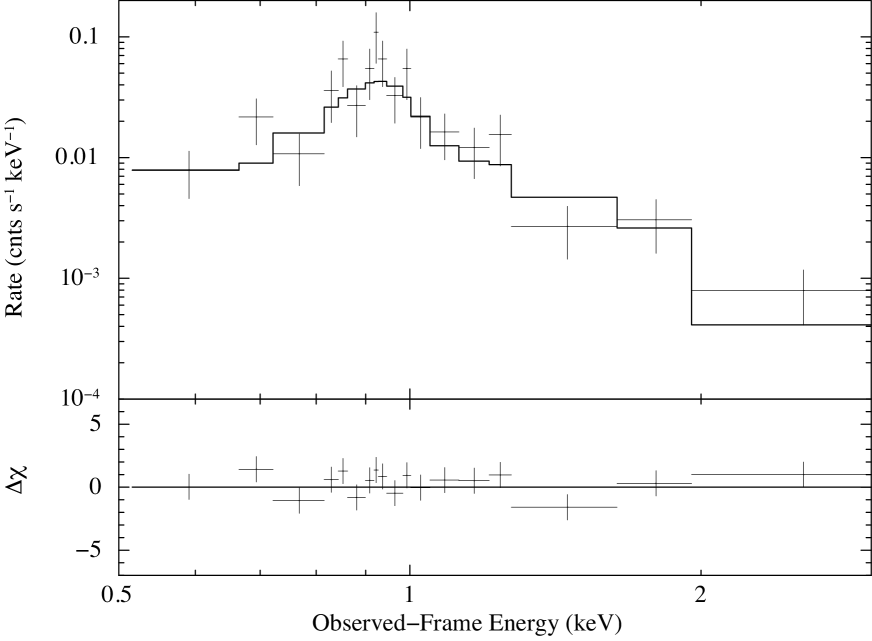
We extracted the spectrum of this group from a 50 arcsec radius circle centered on the X-ray group center. The extracted spectrum was of relatively low S/N containing a total of 98 counts and was therefore fit using the -statistic (Cash 1979)333The spectrum was binned to have at least one count per bin.. This spectrum was fit with a simple model consisting of emission from hot diffuse gas based on the XSPEC model mekal (Mewe, et al. 1985; Kaastra 1992; Liedahl, et al. 1995) modified by Galactic absorption. For display purposes only the spectrum was binned to have at least 5 counts per bin (Figure 7.). Our best-fit model is shown in Figure 7. We obtain best-fit values (based on fits using the -statistic) for the temperature and metal abundances of Te = 1.06 keV and A = 0.5 solar, respectively (both errors are at the 90% confidence level). The 0.2–10 keV and 2–10 keV luminosities of this galaxy group are 1.2 1042 ergs sec-1 and 1.6 1041 ergs s-1, respectively. The detected LX and Te for the galaxy group near HS 0810+2554 is consistent with the LX Te scaling relation for a statistically complete sample of galaxy groups (e.g., Eckmiller et al. 2011).
2.3. Mass Distribution, Convergence and Shear of Galaxy Group Near HS 0810+2554
Assuming a model for the density profile of the hot gas (e.g., Jones & Forman 1984) the equation for the total mass of the galaxy group within a radius ,
| (1) |
where is Boltzmann’s constant, is the proton mass, and is the mean molecular weight of the galaxy group gas.
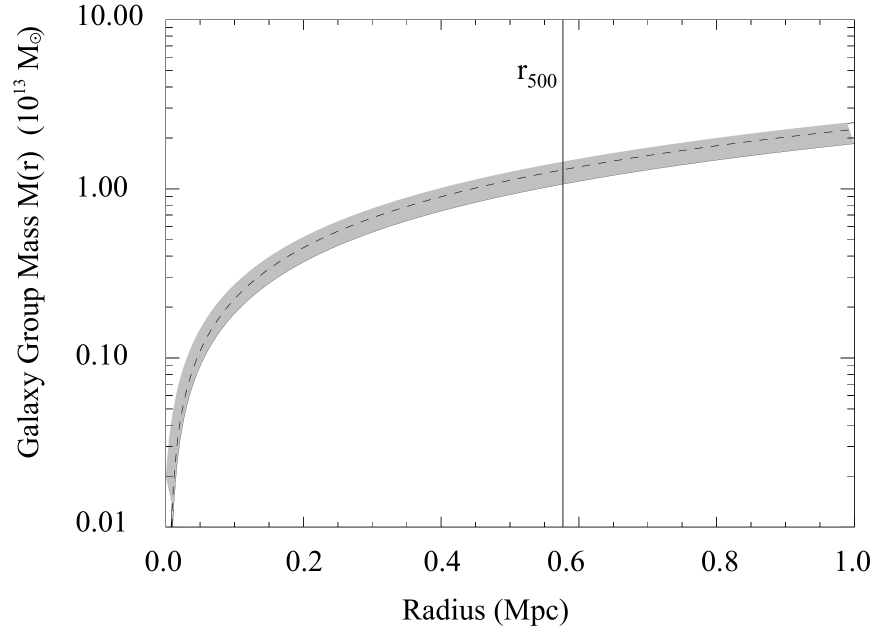
By incorporating the best-fit spatial and spectral parameters from our present analysis we find the total galaxy group mass within radii of and 1 -1 Mpc to be Mgrav = 1.4 1013 M⊙ and Mgrav = 2.2 1013 M⊙, respectively, where is the radius in which the mean over-density is 500, and = 1.69(TX/10 keV)1/2 Mpc 0.55 Mpc (Mohr, Mathiesen, & Evrard, 1999). In Figure 8 we show the total group mass within a radius as a function of radius. The shaded region indicates the allowed values for the group mass including the uncertainties obtained from the spatial and spectral fits to the group.
These mass estimates were used to evaluate the convergence parameter ,
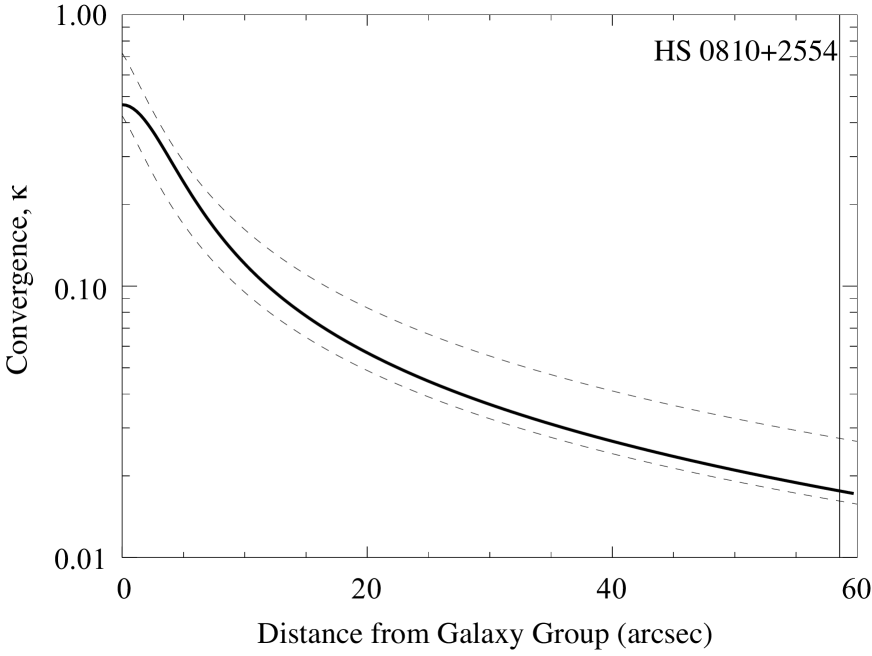
where is the surface mass density of the galaxy group as a function of the cylindrical radius (e.g., Chartas et al. 1998) and is the critical surface mass density (see, e.g., Schneider, Ehlers & Falco 1992). In Figure 9 we plot the convergence parameter as a function of distance from the group center. The thick solid line corresponds to the best-fit spatial and spectral parameters. The largest contributor to the uncertainty in our estimate of is the weak constraint on the temperature of the group. To illustrate this we have plotted the uncertainty in assuming 90% (dashed lines) confidence intervals for the temperature. We also chose galaxy group limits ranging from 0.7 and 1.4.
At the location of the center of HS 0810+2554 with respect to the group center, we estimate the convergence due to the galaxy group to be = 0.017, assuming the 90% confidence range in group temperature. The second order term of the Taylor series expansion of the potential of the galaxy group (Kochanek 1991, Bernstein & Fischer 1999, Keeton et al. 2000) represents the shear from the galaxy group that can be expressed as where, , is the galaxy group core radius and is the distance from the group center to the center of HS 0810+2554 (see, Kochanek, 1991). Using the values for , , and provided by our analysis of the Chandra observation of HS 0810+2554 we find that the group shear amplitude is = 0.016 0.003 (90% confidence level).
2.4. Lens Modeling of HS 0810+2554
For estimating the energetics of the outflow of HS 0810+2554 it is important to constrain the unlensed luminosity of the quasar and thus the magnification of each image. The galaxy group contributes to the lensing of the quasar and our lens modeling of HS 0810+2554 provides estimates of the magnification and time-delays of the system taking into account the perturbation effects of the galaxy group.
We used the gravitational lens adaptive-mesh fitting code glafic version 1.1.6 (Oguri 2010) to model the gravitational lens system HS 0810+2554. The lens was modeled as a singular isothermal ellipsoid plus an external shear from the nearby galaxy group. The ellipsoid’s orientation and ellipticity were left as free parameters.
The external shear was constrained by our analysis of the Chandra observation of the galaxy group near HS 0810+2554 as presented in §2.3. We find that the magnifications of the images are =40, =38, =10, and =6, consistent with Assef et al. (2011). The time-delays between images are found to be =86 s, =6,220 s, =6,307 s, and =25,230 s.
3. DISCUSSION
3.1. Mass-Outflow Rate and Efficiency of the Outflow
Our analysis of the Chandra observation of HS 0810+2554 places constraints on the velocity, column density and ionization parameter of the outflowing X-ray absorbing material. This allows us to estimate the mass-outflow rate and the efficiency of outflow from the expressions:
| (2) |
| (3) |
where is the thickness of the absorber at radius , is the hydrogen column density, is the outflow velocity of the X-ray absorber, is the global covering factor of the absorber, indicates the absorbing component and is the bolometric photon luminosity of the quasar.
The formalism that we adopt for estimating the mass-outflow rate assumes a spherically symmetric wind with a covering factor of (e.g., Lamers & Cassinelli 1999). We approximate , where is the number density of the gas. For the special case of = 1 we obtain the equation used in Crenshaw & Kraemer (2012). A different formalism for estimating the mass-outflow rate proposed by Krongold et al. (2007) applies to particular outflows with narrow biconical geometries as shown in their Figure 12. We do not adopt this formalism because the assumptions made in that derivation likely do not apply to relativistic outflows in NAL quasars. We find the bolometric luminosity of HS 0810+2554 to be =2.41045(94/)(/30) erg s-1 where is the 210 keV bolometric correction factor and is the flux magnification. We note that the bolometric luminosity of HS 0810+2554 is not well constrained because of the uncertainties in the lensing magnification and bolometric correction factor. An independent estimate of is provided from the measured black hole mass of MBH = 4.2 108 (94/)0.5 M⊙ and the dependence of the median Eddington ratio on the median MBH for type-I AGN found in XMM-COSMOS survey (Lusso et al. 2012). Based on the Lusso et al. results the mean Eddington ratio for an AGN with the black hole mass and redshift of HS 0810+2554 is 0.1 resulting in =5.3 1045 (94/)0.5 (0.1/) erg s-1.
We estimated the hydrogen column densities of the X-ray absorption lines from the fit of a photoionization model to the spectrum of HS 0810+2554 (see §2.1 and model 4 of Table 2). From our spectral fits using model 4 we find NHabs3 = 1023 cm-2 and NHabs4 = 1.6 1023 cm-2. We note that in this model we assumed full coverage of the source by the outflowing absorbers.
The bulk outflow velocities of each outflow component were inferred from the best-fit values of the redshifts of these components assuming model 4 of Table 2. We find the outflow velocities of X-ray absorbers abs3 and abs4 to be = 0.13 c and = 0.41 c, respectively.
The global covering factor of the outflowing absorber is not constrained with the current observation. A recent spectroscopic study along multiple lines of sight through the outflowing wind of the lensed quasar SDSS J1029+2623 found that the column density of outflowing mini-BAL and NAL absorbers did not change significantly in a small angular separation of 20′′ (Misawa et al. 2013). In previous X-ray analyses of BAL quasars (e.g., Chartas et al. 2009b) we assumed a conservatively wide range for the covering factor of =0.1–0.3 based on the observed fraction of BAL quasars (e.g., Hewett & Foltz 2003). The detection of near-relativistic outflows in NAL quasars HS 0810+2554 and HS 1700+6414, however, would suggest that the X-ray absorbing winds in NAL quasars may have a larger opening angle that previously thought. Specifically, several studies of NAL quasar (e.g., Misawa et al. 2007; Simon et al. 2012; Culliton et al. 2012) indicate that the true fraction of quasars with a quasar-driven outflow NAL is 40%. For our estimate of the mass-outflow rate we assumed a conservative wide range for the covering factor of =0.3–0.5.
For estimating the mass outflow rate and outflow efficiency, we assumed a fraction ranging from 1 to 10 based on theoretical models of quasar outflows (e.g., Proga et al. 2000). Assuming that the maximum outflow velocity is produced by gas that has reached its terminal velocity one obtains the approximation a few times , where is the observed outflow velocity and = . Based on our estimated maximum outflow velocity (), we expect to be similar to and range between 3 and 10 . Our assumed range of is conservative, ranging from the innermost stable circular orbit (ISCO) radius to 10 . Launching a wind at significantly smaller radii than the ISCO radius is unlikely since general relativistic (GR) effects on an absorber launched within the ISCO radius would result in significant GR redshifts of the absorption lines and launching radii greater than 10 will result in even larger values of the mass-outflow rate.
We used a Monte Carlo approach to estimate the errors of and . The values of and were assumed to have normal distributions within their error limits. The values of , , and were assumed to have uniform distributions within their error limits. By multiplying these distributions and with the appropriate constants from equations 2 and 3 we obtained the distributions of and . We finally determined the means of the distributions of and and estimated the 68% confidence ranges.
In Table 3 we list the total hydrogen column densities of the X-ray absorption lines, the outflow velocity of each absorption component, the mass-outflow rates and the efficiency of the outflows. One intriguing result of our study is that the efficiency of the abs4 outflowing component is found to be = 1.0(0.1/). An efficiency of greater than the covering factor implies that radiation driving alone cannot explain the acceleration of this outflowing highly-ionized absorber. It is likely that magnetic driving is a significant contributor to the acceleration of this X-ray wind (e.g., Kazanas et al. 2012; Fukumura et al. 2013). The mass outflow rate of the abs4 outflowing component is found to be = 1.1 M⊙ yr-1, which is comparable to the accretion rate of HS 0810+2554 which we estimate to be 1.8 10-3(/) yr-1 1 yr-1, where we assumed a typical accretion efficiency of = 0.1.
3.2. Testing the Shielding Hypothesis of AGN Outflows
The radiation driving model of Murray et al. (1995) posits the presence of a shielding gas that is required to drive the gas radiatively from small radii. The X-ray spectra of NAL AGN HS 0810+2554 (presented in this study) and HS 1700+6416 (presented in Lanzuisi et al. 2012) indicate that ultrafast outflows can be present in quasars without the presence of any significant absorbing shielding medium along the X-ray line-of-sight. Specifically, the ultrafast outflows detected in HS 1700+6416 and HS 0810+2554 are manifested as blueshifted absorption lines in the X-ray spectra. These absorption lines have been interpreted as arising from highly ionized (log 3 erg cm s-1) outflowing gas with column densities of about NH 1023 cm-2. This outflowing gas is too ionized and transparent to contribute to its shielding. Our spectral analysis of these two objects indicated the absence of any significant absorber that could act to shield the outflows. It is possible that the shielding gas is ionized and was therefore difficult to detect in the low signal-to-noise ratio Chandra spectrum of HS 0810+2554. We investigated this possibility in section §2.1 by fitting the 5 ks Chandra spectrum with a model consisting of a simple power law, Galactic absorption of 3.941020 cm-2 and intrinsic ionized absorption (model 2 of Table 2). This model provides an acceptable fit in a statistical sense but does not provide a significant improvement (based on the –test) over a model that includes a neutral absorber. No useful constraints of the ionization parameter, shield, and the hydrogen column density, NH,shield, are provided in such a model (see panel b of Figure 3).
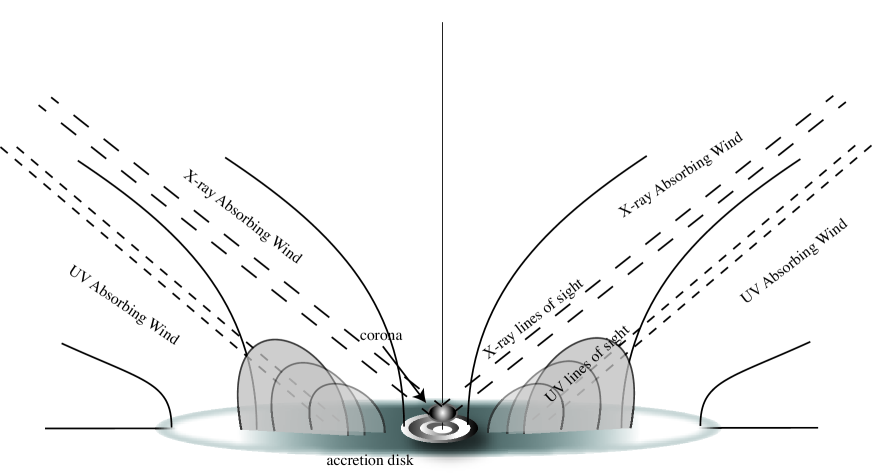
In Chartas et al. (2009a) we presented results from an X-ray survey of a sample of NAL quasars with high velocity UV outflows. In contrast to what we find in BAL quasars we do not detect any significant excess intrinsic absorption in most NAL quasars. Specifically, we found the intrinsic column densities of the X-ray absorbers in our sample of NAL quasars were constrained to be less than a few 1022 cm-2. We also found that the distribution of of the NAL quasars of our sample differs significantly from those of BAL quasars (see Figures 2 and 3 of Chartas et al. 2009a), where, is the optical-to-X-ray slope = (Tananbaum et al. 1979). Since is known to correlate with UV luminosity we also calculated the parameter = - , where is the expected for the monochromatic luminosity at 2500Å (Strateva et al. 2005) based on an unbiased sample of non-absorbed and radio-quiet AGN. is a proxy of X-ray weakness corrected for the dependence of on UV luminosity. We found that the distribution of of the NAL quasars of our sample also differs significantly from those of BAL quasars. The NAL quasars are not significantly absorbed in the X-ray band and the positive values of suggest absorption in the UV band. One plausible scenario that we presented to explain the and distributions of the NAL quasars was that the lines of sight towards the compact X-ray hot coronae of NAL quasars differ from the lines of sight towards their UV emitting accretion disks. In Figure 10 we present a plausible geometric configuration of a quasar outflow that can explain the non-detection of absorption from the shielding gas in the X-ray spectra of NAL quasars. These low values of NH of NAL quasars are consistent with an outflow scenario in which NAL quasars are viewed at smaller inclination angles than BAL quasars. In this possible scenario, shielding gas may be present and intercepted along a UV line of sight and thus aid in driving the UV wind but not intercepted by the X-ray line of sight resulting in no significant absorption in the X-ray spectra of NAL quasars.
The confirmation of an absence of a mildly ionized absorber in the X-ray spectrum of HS 0810+2554 would place into question the hypothesis that a shielding gas is required to protect the X-ray wind from being over-ionized and efficiently drive the X-ray outflow. The non detection, however, of absorption in the X-ray spectrum of HS 0810+2554 would not rule out the presence of shielding gas along the UV line of sight to HS 0810+2554.
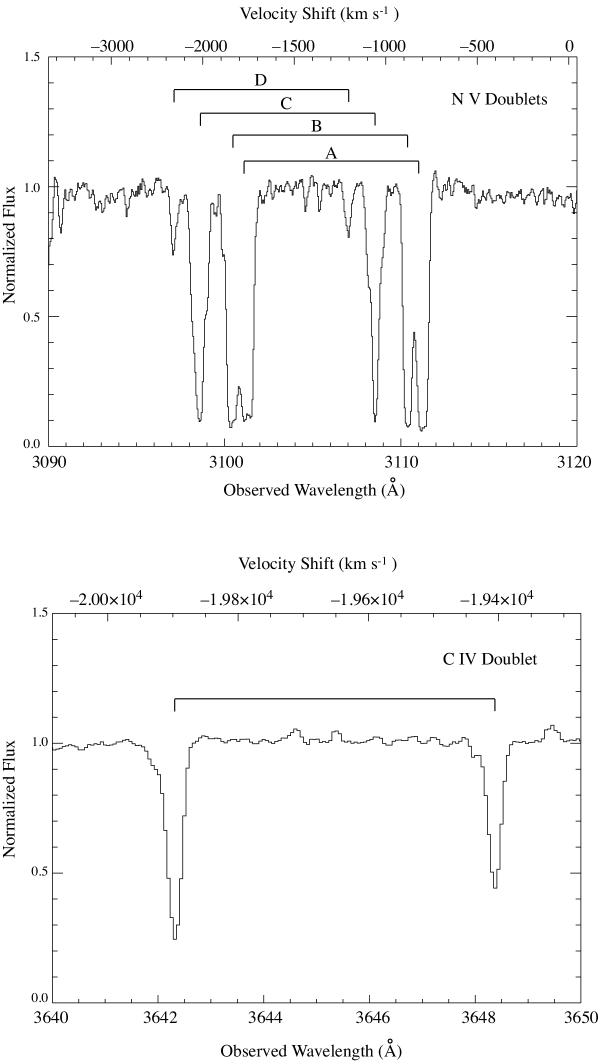
In Figure 11 we show the VLT/UVES spectrum of HS 0810+2554 near the C iv and N v doublets, each form a different parcel of gas. The observed wavelengths of the C iv doublet ( 1548.20 , 1550.77 ) implies that the absorber is outflowing with a speed of 19,400 km s-1. The N v doublet ( 1238.81 , 1242.80 ) shows four outflowing components A, B, C, and D, with velocities of = 789 km s-1, = 868 km s-1, = 1046 km s-1, and = 1198 km s-1, respectively.
The C iv and N v NAL lines are likely intrinsic to the quasar outflow (Culliton et al., in prep.) based on a partial coverage analysis (e.g., Hamann et al. 1997; Misawa et al. 2007). Specifically, the partial covering analysis indicates that for at least one component in each CIV and NV system the covering fraction is more than 3 below 1. The rest-frame equivalent widths of the C iv ( 1548.20 ) and N v ( 1238.81 ) lines are WCIV = 0.11 and WNV = 0.3 (sum of all kinematic components), respectively.
The outflow velocities of the UV and X-ray absorbing material differ significantly implying that the UV and X-ray absorption lines are produced by different absorbers. The ionization parameter of the gas that produces the C iv and N v absorption lines in the UV spectrum is considerably lower than that needed to explain the absorption lines in the X-ray spectrum. This reinforces the idea that the X-ray and UV absorption lines originate from different absorbers. The large velocities of the highly ionized X-ray absorber are difficult to explain with radiation driving. Specifically, for large values of the ionization parameter of the absorber fewer resonant transitions are available to absorb photons from the source, thus resulting in a weaker driving force. Our recent analysis of a sample of mini-BAL quasars found that their X-ray absorption was weak or moderate with total neutral-equivalent column densities few 1022 cm-2 (Hamann et al. 2013). This weak to moderate X-ray absorption might imply the lack of any significant shielding gas that could explain the observed moderate ionization levels (e.g., C iv and O vi) and the high velocities of the outflowing UV absorbing gas in these mini-BAL quasars. However, as we mentioned earlier it is also possible that absorption from the shielding gas is undetected in the X-ray spectra of NAL quasars in a geometry in which the UV and X-ray lines of sight differ. In this later case the shielding is likely not present along the X-ray line of sight but may be present along the UV line of sight.
4. SUMMARY
We have presented results from an analysis of a 5 ks Chandra observation of
the lensed NAL AGN HS 0810+2554 ().
Despite the short exposure, the very large (100) magnification factor offers
a unique opportunity for the study in X-rays of a borderline AGN/QSO (unlensed 2–10 keV
luminosity of 5.81043 erg sec-1) near the
cosmic peak of AGN activity (). The main conclusions of our spectral and spatial analyses are the following.
1. High-energy X-ray absorption lines in the range of 1.55 keV (observed-frame)
are detected at the greater than 97% confidence level in HS 0810+2554.
Based on our fits that use the photoionization model XSTAR, the
absorption lines centered near rest-frame energies of 7.7 keV and 11.0 keV (dominated by Fe xxv ())
are associated with absorbers outflowing at 0.13 and 0.41 , respectively.
If we interpret the absorption line near rest-frame energy of 3.94 keV as arising from highly blueshifted S xv ()
(but at three times the solar abundance value) the implied outflow velocity of this absorber is also 0.41 .
2. Our estimated values of the mass-outflow rates for the outflowing components abs3 and abs4 are
= 0.35 M⊙ yr-1 and = 1.1 M⊙ yr-1,
respectively. These mass-outflow rates are comparable to the estimated accretion rate of HS 0810+2554 which we estimate
to be 1.8 10-3(/) yr-1 1 yr-1,
where we assumed a typical accretion efficiency of = 0.1.
We conclude that the X-ray outflow of NAL AGN HS 0810+2554 distributes a significant amount of
accretion-disk material into the vicinity of the quasar central engine and into the host galaxy over the lifetime of its active phase.
3. Our estimated values of the fraction of the total bolometric energy released by HS 0810+2554 into the IGM in the form of kinetic
energy for components abs3 and abs4 are
= 0.04(0.1/) and
= 1.1(0.1/), respectively.
An efficiency greater than the covering factor = 0.3–0.5 implies that radiation driving alone cannot explain the
acceleration of this highly-ionized absorber. It is likely that magnetic driving is a significant
contributor to the acceleration of this X-ray wind.
4. We detected a galaxy group 58′′ west of the center of HS 0810+2554. By modeling the brightness profile of the galaxy group
we inferred the external shear at the location of HS 0810+2554.
Our gravitational lens model of HS 0810+2554 consisted of a singular isothermal ellipsoid plus an external shear
from the nearby galaxy group. We find that the magnifications of the images are =40, =38, =10, and =6, consistent with Assef et al. (2011).
5. Our analysis of the X-ray spectrum of HS 0810+2554 indicated the absence of any significant neutral absorber that could act to shield the outflow
of X-ray absorbing material. The presence of outflows of X-ray absorbing gas at 0.41
suggest that a shielding gas is not required for the generation of the relativistic X-ray absorbing winds in HS 0810+2554.
It is possible that the shielding gas is ionized and was therefore difficult to detect in the 5 ks Chandra spectrum.
Deeper observations will be required to unambiguously reveal whether a neutral or moderately ionized shielding gas is present or not
along the X-ray line of sight. If the UV and X-ray lines of sight are different, as in a plausible
outflow geometry (see Figure 9), it is possible that shielding is present along the UV line of sight but not
present along the X-ray line of sight.
6. Our analysis of the VLT/UVES spectrum of HS 0810+2554 shows highly blueshifted C iv and N v doublets implying
outflow velocities of 19,400 km s-1 and up to 1,046 km s-1, respectively.
The significantly different UV and X-ray outflow velocities indicate that the UV and X-ray absorption lines are produced by different absorbers.
7. The detection of ultrafast winds in NAL quasars HS 0810+2554 (this study) and HS 1700+6414 (Lanzuisi et al., 2012), in addition to those detected in mini-BAL and BAL quasars, would suggest that the X-ray absorbing winds of quasars may have opening angles larger than previously thought, as large as 50% if ubiquitous in all NAL and BAL quasars. If confirmed, these winds would thus increase their implied feedback contribution to the surrounding ISM and IGM.
References
- (1)
- (2) Assef, R. J., Denney, K. D., Kochanek, C. S., et al. 2011, ApJ, 742, 93
- (3)
- (4) Bernstein, G., & Fischer, P. 1999, AJ, 118, 14
- (5)
- (6) Bevington, P. R., & Robinson, D. K. 2003, Data reduction and error analysis for the physical sciences, 3rd ed., by Philip R. Bevington, and Keith D. Robinson. Boston, MA: McGraw-Hill, ISBN 0-07-247227-8, 2003
- (7)
- (8) Cash, W. 1979, ApJ, 228, 939
- (9)
- (10) Chartas, G., Brandt, W. N., Gallagher, S. C., & Garmire, G. P. 2002, ApJ, 579, 169
- (11)
- (12) Chartas, G., Brandt, W. N., & Gallagher, S. C. 2003, ApJ, 595, 85
- (13)
- (14) Chartas, G., Charlton, J., Eracleous, M., et al. 2009a, New A Rev., 53, 128
- (15)
- (16) Chartas, G., Saez, C., Brandt, W. N., Giustini, M., & Garmire, G. P. 2009b, ApJ, 706, 644
- (17)
- (18) Chelouche, D., & Netzer, H. 2003, MNRAS, 344, 233
- (19)
- (20) Crenshaw, D. M., & Kraemer, S. B. 2012, ApJ, 753, 75
- (21)
- (22) Culliton, C., Eracleous, M., Charlton, J., & Misawa, T. 2012, AGN Winds in Charleston, 460, 109
- (23)
- (24) Dickey, J. M., & Lockman, F. J. 1990, ARA&A, 28, 215
- (25)
- (26) Ebeling, H., White, D. A., & Rangarajan, F. V. N. 2006, MNRAS, 368, 65
- (27)
- (28) Eckmiller, H. J., Hudson, D. S., & Reiprich, T. H. 2011, A&A, 535, A105
- (29)
- (30) Everett, J. E. 2005, ApJ, 631, 689
- (31)
- (32) Everett, J. E., Zweibel, E. G., Benjamin, R. A., et al. 2007, Ap&SS, 311, 105
- (33)
- (34) Fukumura, K., Kazanas, D., Contopoulos, I., & Behar, E. 2010, ApJ, 715, 636
- (35)
- (36) Fukumura, K., Tombesi, F., Kazanas, D., et al. 2013, arXiv:1311.0077
- (37)
- (38) Gallagher, S. C., Brandt, W. N., Chartas, G., & Garmire, G. P. 2002, ApJ, 567, 37
- (39)
- (40) Gallagher, S. C., Brandt, W. N., Chartas, G., et al. 2006, ApJ, 644, 709
- (41)
- (42) Garmire, G. P., Bautz, M. W., Ford, P. G., Nousek, J. A., & Ricker, G. R., Jr. 2003, Proc. SPIE, 4851, 28
- (43)
- (44) Green, P. J., & Mathur, S. 1996, ApJ, 462, 637
- (45)
- (46) Hamann, F., Barlow, T. A., & Junkkarinen, V. 1997, ApJ, 478, 87
- (47)
- (48) Hamann, F., Barlow, T. A., Junkkarinen, V., & Burbidge, E. M. 1997, ApJ, 478, 80
- (49)
- (50) Hewett, P. C., & Foltz, C. B. 2003, AJ, 125, 1784
- (51)
- (52) Jannuzi, B. T., Hartig, G. F., Kirhakos, S., et al. 1996, ApJ, 470, L11
- (53)
- (54) Jones, C., & Forman, W. 1984, ApJ, 276, 38
- (55)
- (56) Kaastra, J.S. 1992, An X-Ray Spectral Code for Optically Thin Plasmas (Internal SRON-Leiden Report, updated version 2.0)
- (57)
- (58) Kallman, T., & Bautista, M. 2001, ApJS, 133, 221
- (59)
- (60) Kazanas, D., Fukumura, K., Behar, E., Contopoulos, I., & Shrader, C. 2012, The Astronomical Review, 7, 030000
- (61)
- (62) Keeton, C. R., Falco, E. E., Impey, C. D., et al. 2000, ApJ, 542, 74
- (63)
- (64) Kochanek, C. S. 1991, ApJ, 382, 58
- (65)
- (66) Konigl, A., & Kartje, J. F. 1994, ApJ, 434, 446
- (67)
- (68) Lamers, H. J. G. L. M., & Cassinelli, J. P. 1999, Introduction to Stellar Winds, by Henny J. G. L. M. Lamers and Joseph P. Cassinelli, pp. 452. ISBN 0521593980. Cambridge, UK: Cambridge University Press, June 1999.
- (69)
- (70) Lanzuisi, G., Giustini, M., Cappi, M., et al. 2012, A&A, 544, A2
- (71)
- (72) Liedahl, D. A., Osterheld, A. L., & Goldstein, W. H. 1995, ApJ, 438, L115
- (73)
- (74) Lucy, L. B. 1974, AJ, 79, 745
- (75)
- (76) Lusso, E., Comastri, A., Simmons, B. D., et al. 2012, MNRAS, 425, 623
- (77)
- (78) Mewe, R., Gronenschild, E. H. B. M., & van den Oord, G. H. J. 1985, A&AS, 62, 197
- (79)
- (80) Misawa, T., Charlton, J. C., Eracleous, M., et al. 2007, ApJS, 171, 1
- (81)
- (82) Misawa, T., Inada, N., Ohsuga, K., et al. 2013, AJ, 145, 48
- (83)
- (84) Mohr, J. J., Mathiesen, B., & Evrard, A. E. 1999, ApJ, 517, 627
- (85)
- (86) Morgan, N. D., Kochanek, C. S., Falco, E. E., & Dai, X. 2006, arXiv:astro-ph/0605321
- (87)
- (88) Murray, N., Chiang, J., Grossman, S. A., & Voit, G. M. 1995, ApJ, 451, 498
- (89)
- (90) Narayanan, D., Hamann, F., Barlow, T., et al. 2004, ApJ, 601, 715
- (91)
- (92) Oguri, M. 2010, Astrophysics Source Code Library, 10012
- (93)
- (94) Proga, D., Stone, J. M., & Kallman, T. R. 2000, ApJ, 543, 686
- (95)
- (96) Proga, D., & Kallman, T. R. 2004, ApJ, 616, 688
- (97)
- (98) Planck Collaboration, Ade, P. A. R., Aghanim, N., et al. 2013, arXiv:1303.5076
- (99)
- (100) Reimers, D., Hagen, H.-J., Baade, R., Lopez, S., & Tytler, D. 2002, A&A, 382, L26
- (101)
- (102) Richardson, W. H. 1972, Optical Society of America Journal, 62, 55
- (103)
- (104) Saez, C., & Chartas, G. 2011, ApJ, 737, 91
- (105)
- (106) Schneider, P., Ehlers, J., & Falco, E. E. 1992, Gravitational Lenses, XIV, 560 pp. 112 figs.. Springer-Verlag Berlin Heidelberg New York. Also Astronomy and Astrophysics Library.
- (107)
- (108) Simon, L. E., Hamann, F., & Pettini, M. 2012, AGN Winds in Charleston, 460, 52
- (109)
- (110) Spitzer, L. 1978, New York Wiley-Interscience, 1978. 333 p.
- (111)
- (112) Strateva, et al. 2005, AJ, 130, 387
- (113)
- (114) Tananbaum, et al. 1979, ApJ, 234, L9
- (115)
- (116) Tombesi, F., Cappi, M., Reeves, J. N., et al. 2010, A&A, 521, A57
- (117)
- (118) Weymann, R. J., Morris, S. L., Foltz, C. B., & Hewett, P. C. 1991, ApJ, 373, 23
- (119)
- (120) Wise, M. W., Davis, J. E., Huenemoerder, D. P., et al. 1997, The MARX 3.0 User Guide, CXC Internal Document available at http://space.mit.edu/ASC/MARX/
- (121)
- (122) Wu, J., Charlton, J. C., Misawa, T., Eracleous, M., & Ganguly, R. 2010, ApJ, 722, 997
- (123)
| Chandra | Exposure | |||||
| Observation | Observation | Time | aafootnotemark: | aafootnotemark: | aafootnotemark: | aafootnotemark: |
| Date | ID | (s) | counts | counts | counts | counts |
| 2002 January 30 | 3023 | 4894 | 290 | 239 | 145 | 34 |
aSource counts for events with energies in the 0.2–10 keV band.
| Modela | Parameterb | Fitted Valuesc | Fitted Valuesd |
|---|---|---|---|
| 1.72 | 1.65 | ||
| 1.21021 cm-2 | 61020 cm-2 | ||
| 65.9/81 | 245.8/296 | ||
| e | 8.9 10-1 | – | |
| 1.74 | 1.72 | ||
| f | f | ||
| f | f | ||
| 65.8/80 | 243.8/295 | ||
| e | 8.7 10-1 | – | |
| 1.50 | 1.57 | ||
| 0.931021 cm-2 | 0.68 1021 cm-2 | ||
| Eabs1 | 3.94 keV | 3.94 keV | |
| 0.15 keV | 0.17 keV | ||
| EWabs1 | 210 eV | 243 eV | |
| Eabs2 | 4.96 keV | 5.01 keV | |
| 0.27 keV | 0.26 keV | ||
| EWabs2 | 246 eV | 235 eV | |
| Eabs3 | 7.74 keV | 7.76 keV | |
| 0.6 keV | 0.30 keV | ||
| EWabs3 | 495 eV | 413 eV | |
| Eabs4 | 11.00 keV | 11.17 keV | |
| 0.95 keV | 0.97 keV | ||
| EWabs4 | 1400 eV | 1257 eV | |
| 45.6/69 | 222.8/284 | ||
| e | 9.9 10-1 | – | |
| 1.75 | 1.76 | ||
| 1.7 1023 cm-2 | 1.0 1023 cm-2 | ||
| 3.37 erg cm s-1 | 3.2 erg cm s-1 | ||
| 1.21 | 1.20 | ||
| 1.62 1023 cm-2 | 1.64 1023 cm-2 | ||
| 3.06 erg cm s-1 | 3.06 erg cm s-1 | ||
| 0.63 | 0.62 | ||
| 60.4/76 | 235/291 | ||
| e | 9.1 10-1 | – |
a Model 1 consists of a power law and neutral absorption at the source.
Model 2 consists of a power law and ionized absorption at the source.
Model 3 consists of a power law, neutral absorption at the source, and Gaussian absorption lines at the source.
Model 4 consists of a power law, neutral absorption at the source and two outflowing ionized absorbers at the source.
All model fits include the Galactic absorption toward the source (Dickey & Lockman 1990).
bAll absorption-line parameters are calculated for the rest frame.
cSpectral fits were performed using the statistic and all errors are for 90% confidence unless mentioned otherwise with all
parameters taken to be of interest except absolute normalization.
dSpectral fits were performed using the Cash statistic and all errors are for 90% confidence unless mentioned otherwise with all
parameters taken to be of interest except absolute normalization.
e is the probability of exceeding for degrees of freedom
if the model is correct.
f No useful constraints are obtained for this parameter.
| Component | NH | |||
|---|---|---|---|---|
| cm-2 | (M) | |||
| 1023 | ||||
| 1023 | ||||