Formation of gapless triplets in the bond-doped spin-gap antiferromagnet (C4H12N2)(Cu2Cl6).
Abstract
We report results of an electron spin resonance (ESR) study of a spin-gap antiferromagnet (C4H12N2)(Cu2Cl6)(nicknamed PHCC) with chlorine ions partially substituted by bromine. We found that up to 10% of nominal doping the contribution of the random defects to the absorption spectra remains at about 0.1% per copper ion, almost the same as in the pure system. Instead, a particular kind of ESR absorption corresponding to gapless S=1 triplets is observed at low temperatures in samples with high nominal bromine content %. Increase of bromine concentration also leads to the systematic broadening of ESR absorption line indicating reduction of the quasi-particles lifetime.
pacs:
75.10.Kt, 76.30.-v1 Introduction.
Spin-gap antiferromagnets have been actively studied during the last decades. Because of particular geometry of the spin-spin interactions (frequently featuring dimer motives) these systems of strongly exchange coupled spins do not order antiferromagnetically, but remain in disordered spin-singlet () state down to the lowest temperatures. Stability of the singlet state is ensured by an energy gap of exchange origin separating the ground state from the triplet () excitations. Among examples of such systems are: a spin-Peierls magnet CuGeO3 [1], a dimer magnet TlCuCl3[2], various Haldane magnets (e.g., PbNi2V2O7 [3, 4] or organo-metallic compound NENP [5]) and various spin-ladder systems [6].
Application of an external magnetic field leads to the Zeeman splitting of the triplet states and to lowering of the energy of one of its substates. This leads to a quantum critical point at a certain critical field . This quantum critical point has been actively discussed recently since it is formally quivalent to Bose-Einstein condensation [2, 7, 8]. If a spin subsystem is three-dimensional, then a field induced antiferromagnetically ordered phase is formed above the critical field [7].
Controlled introduction of defects is another way to affect stability of the ground state. Bond-doping, i.e. introduction of defects that affect interspin couplings but do not affect magnetic sublattices, is of particular interest as a way to realize different random coupling models. Theoretical models considering such systems make interesting predictions, including formation of a glass-like state[9] or a random singlet state [10, 11]. This mechanism was already exploited in the study of random-bond systems IPA-CuCl3 [12, 13], Sul-Cu2Cl4 [14], and DTN[15].
Recently found organo-metallic compound (C4H12N2)(Cu2Cl6)(abbreviated as PHCC for piperazinium hexachlorodicuprate) is a good test model to study quantum critical behaviour and the effect of impurities. The pure compound is well characterised by a variety of techniques including bulk measurements, elastic and inelastic neutron scattering [16, 17, 18] and electron spin resonance [19]. These measurements have confirmed the existence of an energy gap meV, triplet nature of magnetic excitations and closing of the energy gap by a magnetic field above approximately 8T. Inelastic neutron scattering experiments revealed the presence of at least six relevant exchange couplings[16], the exchange couplings geometry can be envisioned as a 2D set of moderately coupled spin-ladders with the dominant interaction on the rung of the ladder and some frustrating couplings.
This system allows to perform a substitution of chlorine ions mediating the interspin interactions by bromine with the nominal Br concentration above 10%. As it was shown by neutronographic and calorimetric experiments [20, 21, 22] doping results in an increase of the gap and the critical field, as well as in a broadening of the excitation spectrum and in a change of the crossover critical exponent. The magnon damping in the doped samples turned out to be strongly dependent on the wavevector with damping rate increasing away from the zone center [21].
Here we present the results of an electron spin resonance (ESR) study of the bromine doped PHCC single crystals. High energy resolution of ESR technique and its ability to distinguish between different paramagnetic centers allows us to demonstrate that particular kind of S=1 paramagnetic centers are formed with bond doping: low temperature ESR response is dominated by resonance absorption of gapless triplets. At the same time, increase of ESR linewidth indicates reduction of lifetime of thermally excited triplet excitations.
2 Experimental details and samples characterisation.
2.1 Samples preparation and characterisation.
Samples of pure and bromine substituted (C4H12N2)(Cu2Cl6(1-y)Br6y)(PHXC for short for the samples) were grown from solution as described in [23]. The saturated solution for the growth of pure PHCC was prepared by adding of piperazine C4H10N2 (from Sigma Aldrich), dissolved in a minimal amount of concentrated HCl, to CuClH2O (99.99% purity from Sigma Aldrich), dissolved in a minimal amount of concentrated HCl, at a 4:1 molar ratio of CuCl2 to C4H10N2. Saturated solution for the diluted crystals was prepared by introducing a proportional amount of CuBrH2O and HBr. We will use nominal bromine concentration (determined by the Br to Cl ratio in the initial solution components) for the sample identification. As grown samples have a typical size of mm3 with a well developed plane normal to the -axis and the longest edge of the sample parallel to the -axis. Details of the lattice structure (which is triclinic) can be found in [16].
The quality of the samples was checked by X-ray diffraction on a Bruker Apex II diffractometer. It was found that up to the nominal bromine content of 12.5% lattice symmetry remains the same (triclinic) and lattice constants slowly increase [22]. Above 12.5% a phase separation was found to occur. Detailed structural analysis [22] has demonstrated that the average bromine concentration in (C4H12N2)(Cu2Cl6(1-y)Br6y) is slightly below the nominal value , , and the occupation of different halogen positions varies: bromine ions enter at almost nominal concentration on the positions responsible for the strongest couplings (rung and leg of the ladder), while bromine occupation of the positions responsible for the interladder couplings is by a factor of three smaller.
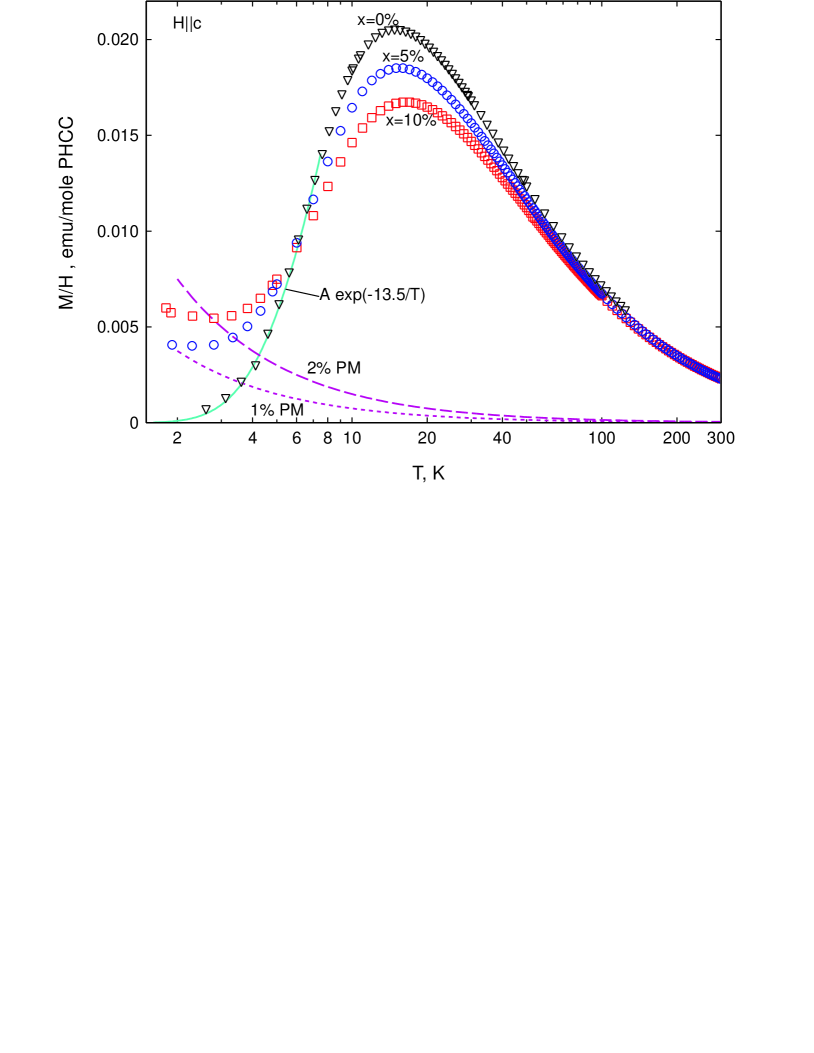
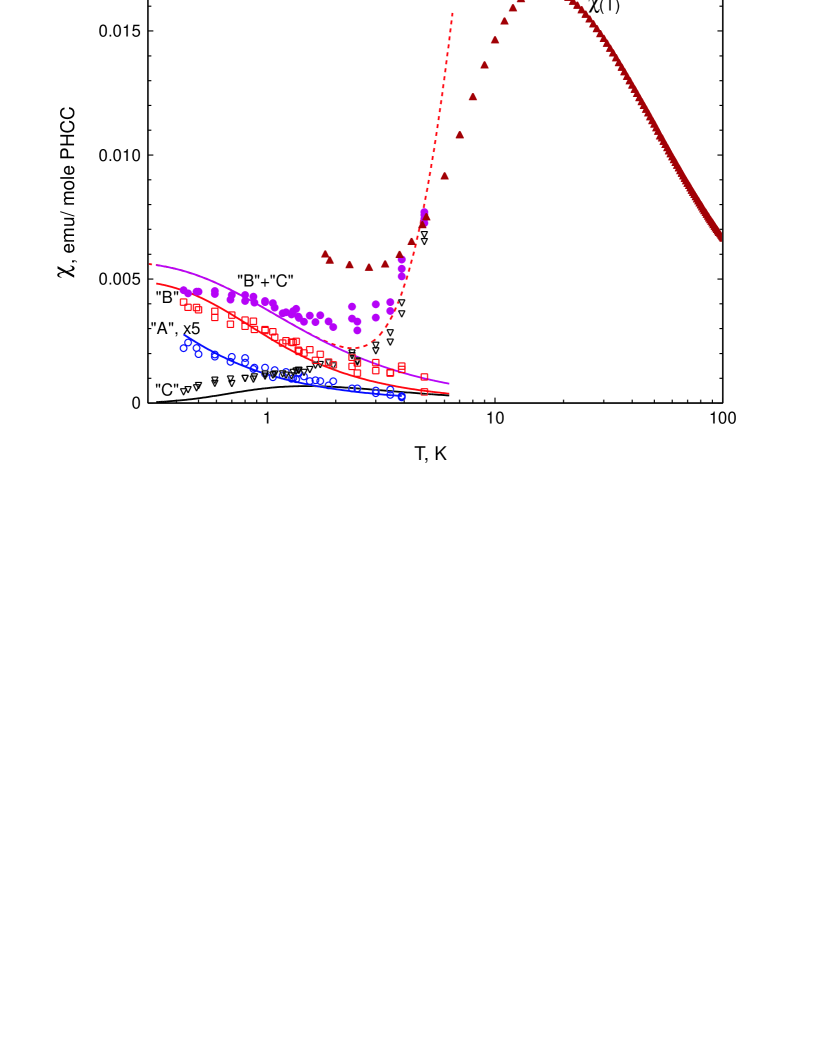
The static magnetization of all samples was measured with a Quantum Design MPMS-XL system. The M(T) curves are shown on Fig.1. All curves demonstrate a broad maximum around 15K. Below this temperature magnetization decreases due to the diminishing population of the gapped magnetic excitations. Since the exchange bonds structure of PHCC is complicated (at least six relevant couplings are suggested in Ref.[16]) we do not attempt to fit these magnetization curves with any compact simple model. Inelastic neutron scattering study of Ref.[20] demonstrated that the gap in the spectrum increases with doping and is above 10K for both pure and doped samples. Thus, contribution of the thermally excited triplets to the magnetic susceptibility at 2K is negligible (see reference line in Figure 1). The increase of magnetization at lowest temperatures is due to the presence of some paramagnetic centers. A crude estimation of the amount of paramagnetic centers can be performed by a direct comparison of the 2K magnetization data with the Curie law. The amplitude of the magnetization at low temperatures corresponds to the concentration of paramagnetic centers (assuming ) of about 1% per copper ion for the nominally 5% Br-doped sample and about 1.5% per copper ion for the nominally 10% Br-doped sample (see dashed lines in Figure 1).
2.2 ESR experiment details
Electron spin resonance experiments were carried out with the help of home-made transmission type ESR spectrometers at the frequencies 10-70 GHz and at temperatures down to 450 mK.
Limited sensitivity of our spectrometer required usage of the quite big samples (about mm3) which in turn limited possibilities for the sample mounting. For this reason ESR experiments for all samples were carried out for the magnetic field orientation. For the same reason, as the sample size is comparable to the microwave wavelength, the field distribution inside the sample is unknown a priori (in particular, different polarizations of microwave magnetic field with respect to the static field are present), but this distribution remains the same for each series of experiments (with the same microwave frequency and the same sample mounting).
Here we briefly recall some basics of ESR technique that will be necessary to interpret experimental data [24, 25].
First, ESR technique allows to discern different paramagnetic centers by their resonance fields. This allows to determine both -factor and spin of the paramagnetic center. Characteristic fingerprint of a center is splitting of the absorption line due to zero-field splitting of its spin sublevels (so called crystal field splitting which is described in the simplest case by axial term in the spin Hamiltonian ). Magnitude and sign of the crystal field parameter can be deduced from the positions and relative intensities of the split absorption components. In particular, for a center a direct transition between sublevels (so called ”two-quantum” transition since it corresponds to ) results in the characteristic absorption signal at one half of the usual paramagnetic resonance field. Zero-field splitting of the collective triplet excitations of a spin-gap magnet can be interpreted as effective crystal field microscopically originating from different anisotropic spin-spin interactions. Unravelling the exact microscopic origin of this splitting is a separate task, this problem has been solved by different approaches for various spin-gap magnets in literature [26, 27, 28].
Second, ESR absorption can be interpreted in absolute units. In our experiment the microwave power transmitted through the cavity with the sample is recorded as a function of slowly swept magnetic field at a fixed microwave frequency. For a weakly absorbing point sample the decrease of the transmitted microwave power is proportional to the imaginary part of the high-frequency susceptibility for the appropriate polarization of the microwave magnetic field. For a finite size sample the absorption has to be integrated over the sample volume taking into account the variation of the microwave field inside the sample. The proportionality coefficient between and the decrease of detector output is a priory unknown, it depends on the microwave fields distribution, cavity Q-factor and other technical details. However, it remains the same for each series of experiments. Thus, we have to scale our absorption with a reference data provided by static susceptibility measurements. If the resonance absorption spectrum consists of a single narrow paramagnetic resonance line Kramers-Kroenig relations can be used to scale the integrated intensity of the paramagnetic absorption due to the microwave field perpendicular to the static field with the static susceptibility :
| (1) | |||||
This allows to establish the scaling factor for the given experiment and to calculate the imaginary part of the susceptibility in absolute units. Which, in turn, allows to estimate the amount of paramagnetic centers. Note, that for the case of such a scaling is applicable only to the absorption components excited by the transversely polarised microwaves and not to the ”two-quantum” absorption.
Finally, the intensity of the ESR absorption due to transitions between spin sublevels and () depends on the sublevels populations and matrix element of the transition.
| (2) |
here the integration is performed over the sample volume to take into account the distribution of microwave field polarizations through the sample. Temperature dependence of a selected component intensity is determined by the combination of the Boltzmann exponents.
3 Experimental results.
3.1 ESR on the reference sample %.
The results of ESR investigation of the nominally pure (%) PHCC are reported in detail in [19]: At high temperatures (above 20K) a single resonance absorption component is observed with an anisotropic -factor slightly above 2.0, as it is typical for Cu2+ ions. Below 20K the ESR absorption loses intensity as the magnetic excitations freeze out. As the population of magnetic excitations drops down, their interaction vanishes and the zero-field splitting of the triplet excitations appears.
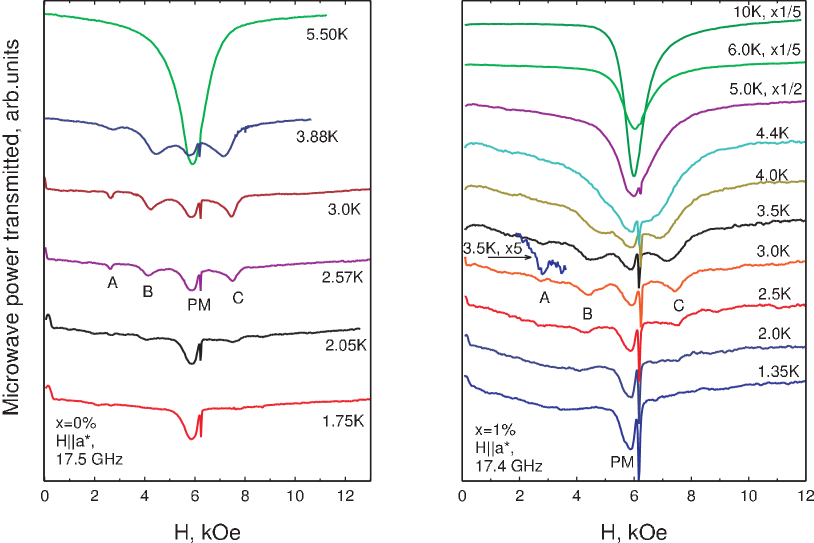
In Figure 2 we present reference data for the % sample taken at the same frequency and orientation as the data for the bromine-diluted samples. As was described above, there is a single component ESR absorption line above 5K. The ESR absorption line splits around 4K into three components: two main components (Fig.2) corresponding to transitions and the weaker component at approximately half of the paramagnetic resonance field corresponding to the transition. We mark these components in the order of increasing resonance field as ”A”, ”B” and ”C” corresponding to the ”two-quantum” transition and the two main components. Splitting of the main components and their relative intensities are related to the parameters of the effective crystal field and to the orientation of the anisotropy axes with respect to the field. Intensity of the ”C” component slightly exceeds the intensity of the ”B” component. Split components continue to lose intensity on cooling and below 2.0K the ESR absorption spectrum mainly consists of the paramagnetic absorption due to the defects and impurities (marked as ”PM”).
3.2 ESR on the sample with low nominal bromine content %.
Temperature evolution of ESR absorption for the sample with low nominal bromine content (%) is qualitatively the same as for the pure sample (Fig.2). On cooling below 10K the ESR absorption loses intensity, the ESR line broadens and splits at approximately 4K into three components (again labelled as ”A”, ”B” and ”C” on Fig.2). These components freeze out on further cooling and at the lowest temperature the ESR absorption spectrum consists of single line with -factor close to 2.0, which is related to defects and impurities. Thus, the observed ESR absorption in the low-doped sample is mostly due to the triplet excitations, as in the pure sample. As in the case of pure compound, intensity of the ”C” component for the 1% doped sample slightly exceeds that of the ”B” component, which indicates that the effective anisotropy constant is also with the same sign.
3.3 ESR on the samples with high nominal bromine content 5 and 10 %.
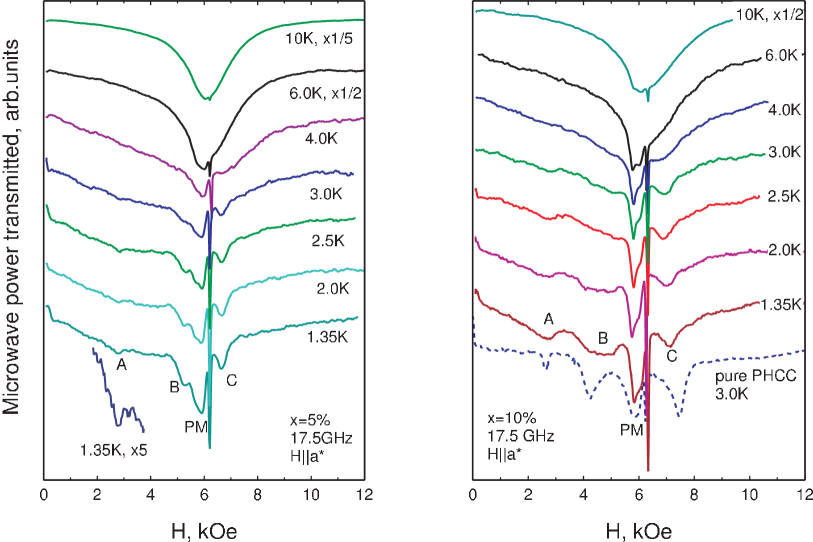
Temperature evolution of ESR absorption in the samples of PHXC with higher nominal bromine concentration 5% and 10% (Fig.3) is qualitatively different from that of the lightly doped sample. At temperatures above 4 K the intensity of absorption decreases with cooling and the splitting of the ESR line into similar components occurs. But the split components remain clearly visible even at the lowest temperatures. Below we will focus our consideration on the sample with %, absorption spectra for the sample with % is qualitatively similar to the % case.
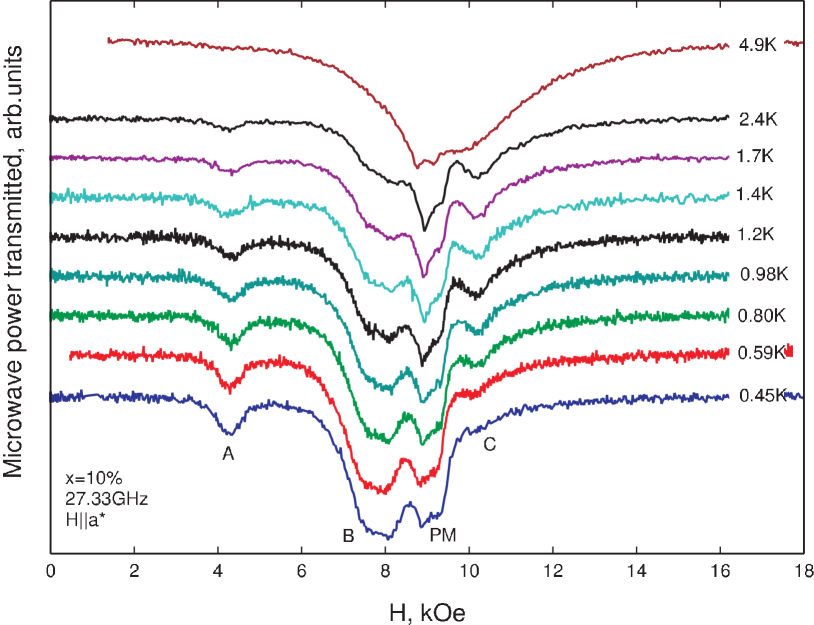
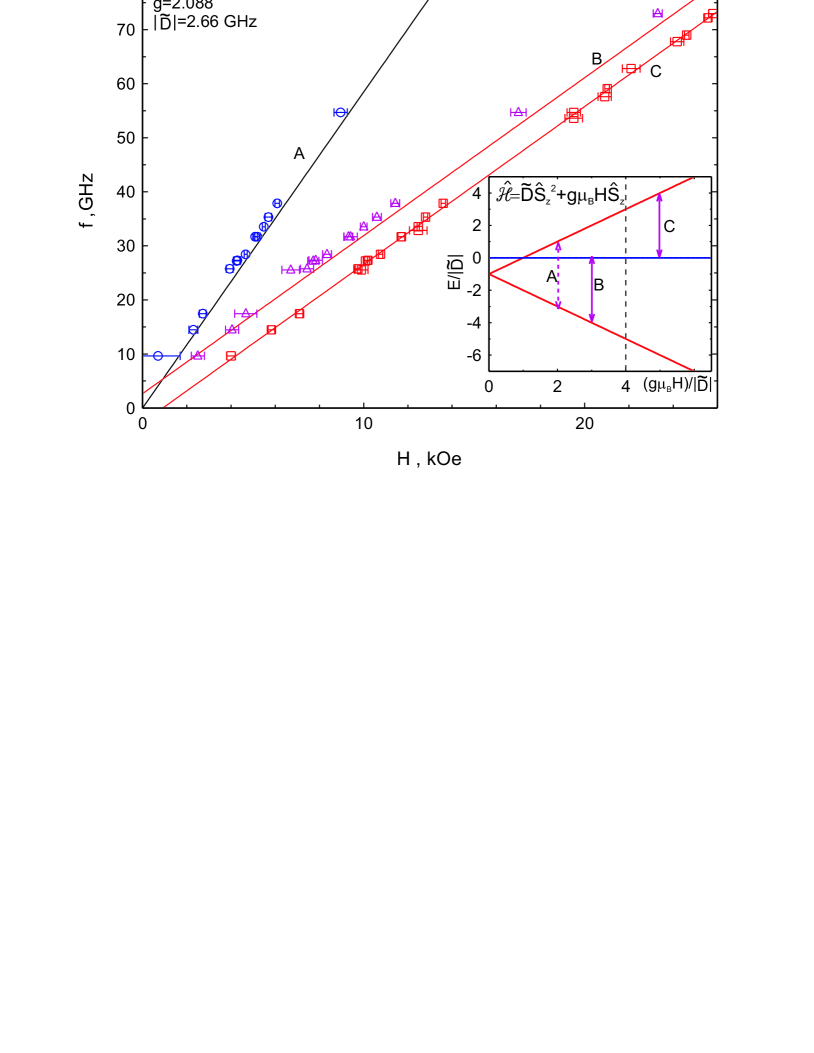
To check whether this absorption signal corresponds to the objects or not and to follow its temperature evolution, we performed measurements at temperatures down to 450mK on the % sample and measured the frequency-field dependence of the observed ESR absorption signal. These data demonstrate (Fig. 4) that ”A” and ”B” components of the split absorption spectrum survive down to the lowest temperatures and gain intensity on cooling, while ”C” component loses intensity below 1K and almost disappears at 450 mK. The frequency-field dependences (Fig. 5) for all three modes are in quantitative agreement with known [24, 25] frequency-field dependences for a object in an axial crystal field with -factor and effective anisotropy constant GHz.
Contrary to the case of pure and low-doped samples, the integrated intensity of ”B” component at K (Fig. 3) slightly exceeds the intensity of the ”C” component, this difference becomes obvious on cooling below 1K (Fig. 4). Thus, the effective anisotropy constant in orientation for the high-doped samples has a different sign from that for the pure or low-doped samples.
4 Discussion.
4.1 Effect of doping on the paramagnetic resonance at K.
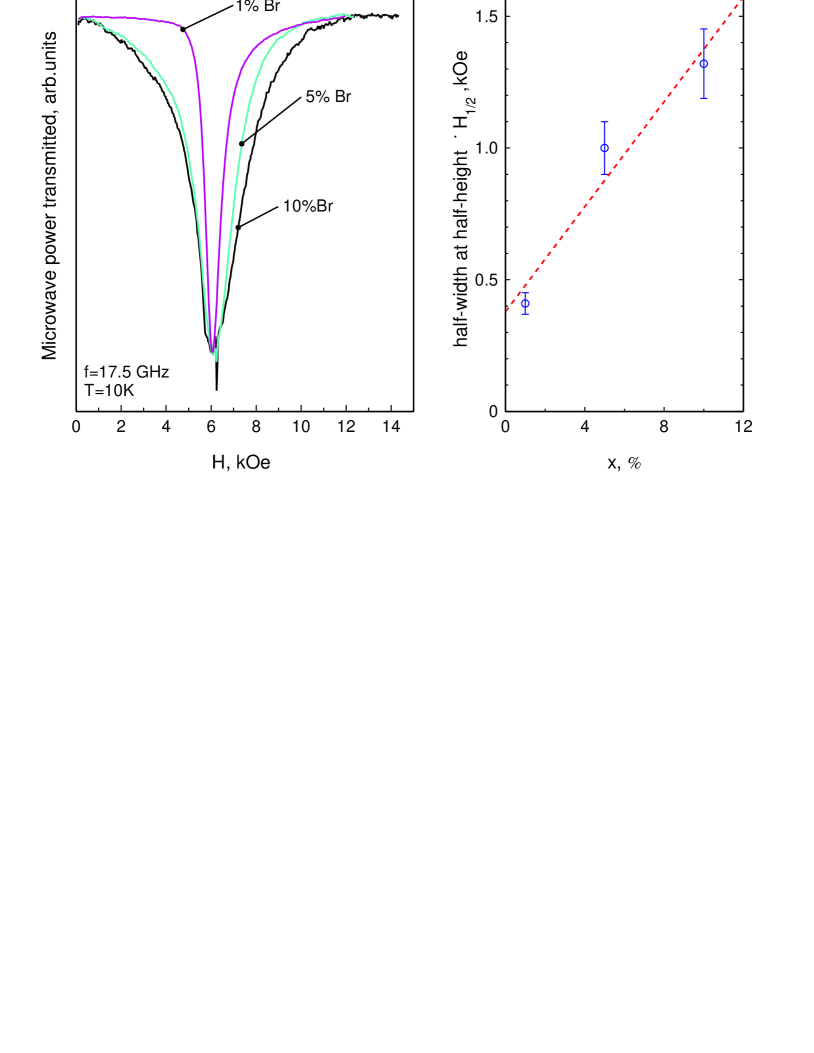
At temperatures above 6K ESR absorption line for all the samples consists of a single component and demonstrates an increase of the intensity on heating. This increase of intensity is in an agreement with the increase of static susceptibility on heating in the same temperature range. Thus, ESR absorption at these temperatures is dominated by the triplet excitations of the spin-gap magnet. Comparison of ESR absorption lines measured at the same temperature K (Figure 6) demonstrates a monotonous increase of linewidth with doping. As ESR linewidth is directly related to the lifetime of the spin precession, i.e. to the lifetime of the triplet excitations, this observation is in qualitative agreement with increase of magnon damping rate observed in neutron scattering experiments. [20, 21]
4.2 Estimation of the amount of paramagnetic defects in doped samples.
The ”PM” mode observed in all samples with -factor close to 2 increases in intensity on cooling and has an irregular lineshape. This allows to interpret it as being related to some uncontrolled paramagnetic defects (e.g., off-site copper ions, paramagnetic impurities etc.). To estimate the concentration of the paramagnetic centers we scale the integral intensity of the ”PM” mode measured at 17.5GHz (Figures 2, 3) at low temperatures (between 1.5K and approximately 3K) with the total intensity of the ESR signal at high temperature (10K). The high temperature total intensity can then be scaled to the measured static magnetization (see Eqn.(1)). Then the concentration of the paramagnetic centers can be estimated from the Curie law. We neglect here anisotropy of the PHCC -factor which would yield insignificant corrections [29].
We have found that the intensity of the ”PM” mode in all the samples corresponds to approximately 0.1% (measured -factor) paramagnetic centers per copper ion (Table 1).
| Nominal Br | Amount of paramagnetic |
|---|---|
| concentration, % | centers contributing to ”PM” |
| component, % per copper | |
| 0 | |
| 1 | |
| 5 | |
| 10 |
Apparent increase of amplitude of the ”PM” mode with increasing bromine concentration in Figures 2,3 is purely visual effect due to broadening of the main absorption line.
Note that the low-temperature magnetization of the doped samples (Figure 1) corresponds to ten-fold higher amount of paramagnetic centers. This discrepancy with ESR observations rules out trivial creation of paramagnetic defects on doping. Additionally, the estimated amount of the paramagnetic defects is much smaller than the nominal Br concentration. This implies that Br substitution indeed affects the magnetic bonds instead of creating additional structural or magnetic defects in agreement with X-ray analysis of Ref.[22].
4.3 Nature of the resonance centers in the samples with high bromine contents.
The ESR absorption spectra measured at the lowest temperatures (Fig. 4) prove that the low-temperature absorption in the high-doped samples is dominated by some other objects affected by the effective crystal field (here we assume ).The magnitude of the constant GHz and the -factor value are determined from the frequency-field dependence , see Figure 5. The negative sign of the is evidenced by the higher relative intensity of the ”B” component as this transition corresponds to the excitation from the lowest sublevel (see insert of Figure 5).
Temperature dependence of the ESR absorption intensity (Figure 7) was determined for components ”A”, ”B” and ”C” by fitting them with a Lorentzian lineshape. Determination of intensity of mode ”A” is the most reliable since this mode is well separated from other absorption components. But mode ”A” can not be used for the determination of the objects concentration because of the unknown excitation conditions for this ”two-quantum” transition. The modes ”B” and ”C” are excited by the conventional transverse polarization and their intensity can be scaled with the static susceptibility data. Closeness of the modes ”B” and ”C” with the defects contributed mode ”PM” complicates fit procedure, leading in particular to the systematic overestimation of the intensity of the weaker mode ”C” located on the shoulder of the ”PM” mode. However, as the scaling with the static magnetization is done at 5K where the ”PM” mode intensity is relatively weak and the low-temperature (below 0.6K) absorption is dominated by the mode ”B”, the absolute value of ESR absorption at low temperatures (which is determined by the concentration of the objects) can be determined reliably. When scaling the ESR absorption with the static susceptibility we neglect the -factor anisotropy which would yield only small (about 5%) correction in our case [29].
To model temperature dependence of the ESR intensity we assumed that these objects are gapless with energy of the field-independent substate being zero. Temperature dependences of ESR intensities can be then deduced from Eqn.2 (see Appendix for details) with known microwave frequency, -factor and anisotropy constant, leaving the scaling factors as the only fitting parameters. Experimentally measured intensities of the ESR modes follow modelled curves well. Best fit is obtained with the concentration of the objects per molecule of PHXC . The results of this fit are shown on Figure 7.
At higher temperatures (above 4K) the observed ESR absorption is dominated by thermally excited triplets. Temperature dependence of the total ESR absorption intensity in the temperature range from 0.45K to 6K can be fitted by a sum of contributions from the objects and a gapped contribution with the gap value fixed to K. The gap value was obtained by extrapolation of the neutronographic data [20, 21] (see dashed line at Figure 7). Also, note that as temperature increases, the dominating ESR component slowly switches from the low-field ”B” component to the higher-field ”C” component. This redistribution of absorption intensities follows crossover from the absorption dominated by gapless triplets at low temperatures to the absorption dominated by triplet excitations at higher temperatures.
The origin of these gapless triplets can not be unambiguously recovered from our data. However, the finding that concentration of these objects is close to 1% per PHXC molecule for the 10% nominal doping suggests the following explanation. The building block of PHCC magnetic subsystem is a Cu2Cl6 dimer. Two of the chlorine ions are responsible for the intradimer coupling and the four remaining chlorines participate in the formation of the inter-dimer couplings. At the bromine doping level of 10% (assuming uniform doping) the probability to find a dimer with both intra-dimer bond-forming halogens being bromine ions is exactly 1%. A detailed structural analysis of [22] suggested that the occupation of the inter-dimer halogen positions (position Cl1 in terms of [22]) is slightly less then the nominal value and is about 7.5%, which makes the probability of the double substitution 0.56% even closer to our estimation of the objects concentration. Thus, dimers with two of the intra-dimer exchange bonds modified by bromine substitution are the possible source of the gapless triplets. These triplets could be interpreted as a localized triplet mode, created by a potential well centered on such a doubly substituted dimer. In the limit of strong localization this localized triplet mode transforms into a ferromagnetically coupled pair of copper spins.
Finally, we would like to note that the contribution of the spin to the susceptibility exceeds that of the spin by the factor of 8/3 (spin enters Curie law as ). Thus, the determined concentration of 0.4% of objects per PHCC molecule (or 0.2% per copper ion) corresponds to the concentration of about 0.5% of centers per copper ion which is reasonably close to the amount estimated from the magnetization data (Figure 1). Additional contribution to the static magnetization of the doped PHXC should also arise from a Van-Vleck-like mechanism suggested in [22].
5 Conclusions.
We have studied the effect of bond-doping on the spin-gap magnet (C4H12N2)(Cu2Cl6). Our experiments show that substitution of chlorine ions by bromine up to 10% nominal doping does not lead to the destruction of the spin gap state. We have shown, that introduction of bromine ions does not lead to formation of structural defects — the concentration of paramagnetic centers remains practically the same (about or below 0.1%) for the full set of samples ranging from pure compound to 10% nominally doped sample.
However, bond-doping does affect thermally excited triplet excitations by shortening their lifetime, as evidenced by increase of ESR linewidth.
Finally, we have established that the low-temperature ESR absorption is dominated by gapless triplets formed with doping.
6 Acknowledgements.
The work was supported by the Russian Foundation for Basic Research (RFBR) projects No.12-02-31220, No.12-02-00557 and No.15-02-05918, Russian Presidential Grant for the Support of the Leading Scientific Schools No.4889.2012.2 and No.5517.2014.2. This work was partially supported by the Swiss National Fund (division 2). This project was partially supported by the Estonian Ministry of Education and Research under grant IUT23-03 and Estonian Research Council grant PUT451.
Appendix A Equations for the temperature dependences of ESR modes intensities
If we assume that the objects responsible for the low-temperature ESR absorption have no energy gap, then, taking energy of the field independent sublevel for zero, energies of the sublevels are . The temperature dependence of the intensity for each of the resonance absorption components is described by the combination of Boltzmann exponents (Eqn.(2)).
For the ”two-quantum” transition ”A” this yields
| (3) |
The main absorption components ”B” and ”C” correspond to the ordinary transitions and are excited by the microwave magnetic field perpendicular to the static field. This allows to analyse the intensities of these modes quantitatively and to estimate the concentration of these gapless objects. The scaling factor between the observed absorption intensity and the static susceptibility was calculated at temperatures from 5 to 6 K, which are the highest temperatures available in our He-3 experimental setup. At these temperatures the intensity of the absorption signal related to the paramagnetic defects is negligible compared to the total intensity. This allows to express the intensities of ”B” and ”C” components in terms of concentration of the objects:
| (4) | |||||
| (5) |
The scaling factor ensures the correct Curie dependence of the total intensity at high temperatures ():
| (6) |
for our data emu/(mole PHXC).
References
- [1] Regnault L P, Aïn M, Hennion B, Dhalenne G and Revcolevschi A, Physical Review B 53, 5579 (1996)
- [2] Oosawa A, Ishi M and Tanaka H, Journal of Physics: Condensed Matter 11, 265 (1999)
- [3] Uchiyama Y, Sasago Y, Tsukada I, Uchinokura K, Zheludev A, Hayashi T, Miura N, and Böni P, Physical Review Letters 83, 632 (1999)
- [4] Zheludev A, Masuda T, Tsukada I, Uchiyama Y, Uchinokura K, Böni P, and Lee S-H, Physical Review B 62, 8921 (2000)
- [5] Affleck Ian, Physical Review B 46, 9002 (1992)
- [6] Schmidiger D, Bouillot P, Guidi T, Bewley R, Kollath C, Giamarchi T and Zheludev A, Physical Review Letters, 111, 107202 (2013)
- [7] Giamarchi T, Ruegg C and Tchernyshyov O, Nature Physics 4, 198 (2008)
- [8] Zapf V, Jaime M and Batista C D, Reviews of Modern Physics 86, 563 (2014)
- [9] Nohadani O, Wessel S and Haas S, Physical Review Letters 95, 227201 (2005)
- [10] Dasgupta C and Ma S, Physical Review B 22, 1305 (1980)
- [11] Fisher D S, Physical Review B 50, 3799 (1994)
- [12] Manaka H, Kolomiets A V and Goto T, Physical Review Letters 101, 077204 (2008)
- [13] Hong T, Zheludev A, Manaka H and Regnault L-P, Physical Review B 81, 060410 (2010)
- [14] Wulf E, . Mühlbauer S, Yankova T and Zheludev A, Physical Review B 84, 174414 (2011)
- [15] Yu R, Yin L, Sullivan N S, Xia J S, Huan C, Paduan-Filho A, Oliveira N F, Haas S, Steppke A, Miclea C F, Weickert F, Movshovich R, Mun E-D, Zapf V S and Roscilde T, Nature 489, 379 (2012) (arXiv:1109.4403v2)
- [16] Stone M B, Broholm C, Reich D H, Schiffer P, Tchernyshyov O, Vorderwisch P and Harrison N, New Journal of Physics 9, 31 (2007)
- [17] Stone M B, Zaliznyak I, Reich D H and Broholm C, Physical Review B 64, 144405 (2001)
- [18] Stone M B, Zaliznyak I A, Hong T, Broholm C L and Reich D H, Nature 440,187 (2006)
- [19] Glazkov V N, Yankova T S, Sichelschmidt J, Hüvonen D and Zheludev A, Physical Review B 85 054415 (2012)
- [20] Hüvonen D, Zhao S, Månsson M, Yankova T, Ressouche E, Niedermayer C, Laver M, Gvasaliya S N and Zheludev A, Physical Review B 85, 100410(R) (2012)
- [21] Hüvonen D, Zhao S, Ehlers G, Månsson M, Gvasaliya S N and Zheludev A, Physical Review B 86, 214408 (2012)
- [22] Hüvonen D, Ballon G and Zheludev A, Physical Review B 88, 094402 (2013)
- [23] Yankova T, Hüvonen D, Mühlbauer S, Schmidiger D, Wulf E, Zhao S, Zheludev A, Hong T, Garlea V O, Custelcean R and Ehlers G, Philosophical Magazine 92, 2629 (2012) (arXiv:1110.6375v1)
- [24] Al’tshuler S A and Kozyrev B M, Electron paramagnetic resonance, Elsevier Inc., 1964
- [25] Abragham A and Bliney B, Electron paramagnetic resonance of transition ions, Clarendon Press, Oxford, 1970
- [26] Regnault L-P, Zaliznyak I A and Meshkov S V, Journal of Physics: Condensed Matter 5, L677 (1993).
- [27] Manaka H and Yamada I, Physical Review B 62, 14279 (2000)
- [28] Kolezhuk A K, Glazkov V N, Tanaka H and Oosawa A, Physical Review B 70, 020403 (2004)
- [29] Static susceptibility was measured for , while the ESR absorption is recorded for . The absorption by thermally activated triplets, ”B”, ”C” and ”PM” modes are excited by the transversely polarized microwaves with the microwave magnetic fields distributed in the -plane. Due to the big sample size, various polarizations are present. Value of the -factor varies in the -plane from 2.05 to 2.14 [19]. Accounting for this -factor variation would give a correction of about 5% for the scaling between the static susceptibility and the integrated ESR absorption , which is much less then the accuracy of the concentration determination.