Continued activity in P/2013 P5 PANSTARRS ††thanks: Based on observations collected at the European Southern Observatory, La Silla, Chile (NTT), program 184.C-1143(H), the Canada France Hawai‘i Telescope, Mauna Kea, Hawai‘i, and the 1.2m telescope on Calar Alto, Spain.
The object P/2013~P5 PANSTARRS was discovered in August 2013, displaying a cometary tail, but its orbital elements indicated that it was a typical member of the inner asteroid Main Belt. We monitored the object from 2013 August 30 until 2013 October 05 using the CFHT 3.6m telescope (Mauna Kea, HI), the NTT (ESO, La Silla), the CA 1.23 m telescope (Calar Alto), the Perkins 1.8m (Lowell) and the 0.6m TRAPPIST telescope (La Silla). We measured its nuclear radius to be km, and its colours and , typical for an S-class asteroid, as expected for an object in the inner asteroid belt and in the vicinity of the Flora collisional family. We failed to detect any rotational light curve with an amplitude mag and a double-peaked rotation period h. The evolution of the tail during the observations was as expected from a dust tail. A detailed Finson-Probstein analysis of deep images acquired with the NTT in early September and with the CFHT in late September indicated that the object was active since at least late January 2013 until the time of the latest observations in 2013 September, with at least two peaks of activity around 2013 June 14 d and 2013 July 22 d. The changes of activity level and the activity peaks were extremely sharp and short, shorter than the temporal resolution of our observations ( d). The dust distribution was similar during these two events, with dust grains covering at least the 1–1000m range. The total mass ejected in grains mm was estimated to be kg and kg around the two activity peaks. Rotational disruption cannot be ruled out as the cause of the dust ejection. We also propose that the components of a contact binary might gently rub and produce the observed emission. Volatile sublimation might also explain what appears as cometary activity over a period of 8 months. However, while Main Belt comets best explained by ice sublimation are found in the outskirts of the Main Belt, where water ice is believed to be able to survive buried in moderately large objects for the age of the solar system deeply, the presence of volatiles in an object smaller than 300 m in radius would be very surprising in the inner asteroid belt.
Key Words.:
Comets: P/2013 P5 (PANSTARRS), Asteroids: P/2013 P5 (PANSTARRS), Techniques: image processing, photometric1 Introduction
Since 1996, a dozen objects have been discover to display dust activity typical of comets, while they are on orbits typical of Main Belt asteroids (see Jewitt, (2012) for a review), including P/2013 P5, which is discussed in this paper. Their semi-major axes are smaller than Jupiter’s, and their Tisserand parameters are larger than 3, indicating that they are dynamically decoupled from Jupiter (Kresak,, 1980). For many of them, orbital integrations indicate that they are long-term residents of the Main Belt (eg. Hsieh et al., (2009) for 238P, Hsieh et al., 2012b for 300163), and simulations even demonstrate that they very likely formed in situ (Haghighipour,, 2009), which rules out a formation in the traditional comet reservoirs of the Oort Cloud or the Kuiper belt.
Long-lasting activity: Some of these objects showed dust emission that extended over periods of months around perihelion —over 60d for 133P (Boehnhardt et al.,, 1998), 100d for 238P (Hsieh et al.,, 2011), 200d for P/2010 R2, (Moreno et al.,, 2011)— suggesting that volatile ice sublimation (traditional cometary activity) is most likely the process responsible for lifting the dust from the object surface. Two objects were found active at consecutive perihelion passages: 133P (Hsieh et al.,, 2004) and 238P (Hsieh et al.,, 2011): this activity pattern also suggests that ice sublimation is the underlying process that drives the activity. Water ice is the only volatile that can survive in Main Belt objects (Prialnik and Rosenberg,, 2009), and that only as crystalline ice and in minute amounts (Meech and Svoren,, 2004). Theoretical considerations (Schorghofer,, 2008) indicate that water should be able to survive for the age of the solar system even in a fairly small asteroid, provided that it is buried under a protective, insulating layer of regolith. The Main Belt comets (MBCs) from this category are all located in the outskirts of the Main Belt, where water ice survival is slightly less challenging (Schorghofer,, 2008).
Until now, no direct spectroscopic signature from any volatile has been detected in MBCs (Snodgrass,, 2013). These non-detections are not constraining, however: most of them targeted the CN emission, where the detection limits were 1–2 orders of magnitude above the expected amount of gas required to lift the observed dust —see for instance Licandro et al., (2011) for observations of 133P and 176P. Furthermore, they relied on the standard CN/H2O ratio for normal comets. Because Main Belt comets are likely to be completely depleted of all volatiles but water, this ratio is at best an optimistic upper limit that makes the non-detection of CN even less constraining for the presence of water.
Short activity: Other active asteroids displayed a very short, impulsive burst of dust, which slowly dispersed under the solar radiation pressure. The activity of P/2012 F5 (Stevenson et al.,, 2012; Moreno et al.,, 2012), 596 (Hsieh et al., 2012a, ; Ishiguro et al., 2011a, ; Ishiguro et al., 2011b, ; Jewitt et al.,, 2011; Moreno et al.,, 2012), and P/2010 A2 (Jewitt et al.,, 2010; Snodgrass et al.,, 2010; Jewitt et al.,, 2011; Hainaut et al., 2012b, ; Kim et al.,, 2012; Kleyna et al.,, 2013) has been interpreted as the effect of impacts by small asteroids.
It must be noted that rotational instability is also considered a possible cause for the dust emission in P/2012 A2 (Agarwal et al.,, 2013) and possibly P/2012 F5 (Agarwal, private com.). For instance, the YORP effect (Lowry et al.,, 2007; Taylor et al.,, 2007; Marzari et al.,, 2011; Jacobson and Scheeres,, 2011) can accelerate the rotation of a small object until it reaches the critical period at which the centrifugal force on the surface is stronger[[[ than the gravity and tensile strength of the body. Rotational light curves of asteroids suggest that objects larger than 150 m in diameter are inside the limit for losing mass at the equator (Pravec et al.,, 2002), which suggests that this process might be in effect. Because P/2012 A2 is a very small object (m radius post-emission, Jewitt et al.,, 2010; Hainaut et al., 2012b, , the matter ejected amounts to a very small change of the radius), this is quite plausible. For completeness, the YORP effect is also believed to be able to cause a catastrophic break-up of the object, a scenario incompatible with these observations.
While some still-unknown processes might play a role, cometary activity in the outer Main Belt, and impacts and possibly rotation break-up elsewhere, seem to satisfactorily explain most of the observed objects. However, there are already some exceptions to this preliminary scheme: 176P, which was discovered while active in the outer Belt, did not show any activity on the next perihelion passage (Hsieh,, 2013), indicating that an extended period of activity does not guarantee cometary behaviour. However, once activated, each MBC is likely to remain active only for a certain period of time until the hypothesised near-surface volatiles are depleted. While 259P was found to be active in the inner Belt, this object is probably has arrived recently on its current orbit (Jewitt et al.,, 2009), which suggests that it is an interloper.
Jewitt, (2012) discussed a list of processes that might cause activity in asteroids: in addition to those already considered, electrostatic levitation and radiation-sweeping could in principle lift small dust grains from small asteroids. However, given the large number of asteroids and the large amount of dust seen for many of the MBCs, the proposal that this mechanism is a plausible cause for activity does not address the question why most of the main belt asteroids show no dust comae. The other processes, thermal fracture and thermal dehydration, are not considered to be relevant for P/2013 P5 because its orbit is not close to the Sun.
1.1 P/2013 P5 (PANSTARRS)
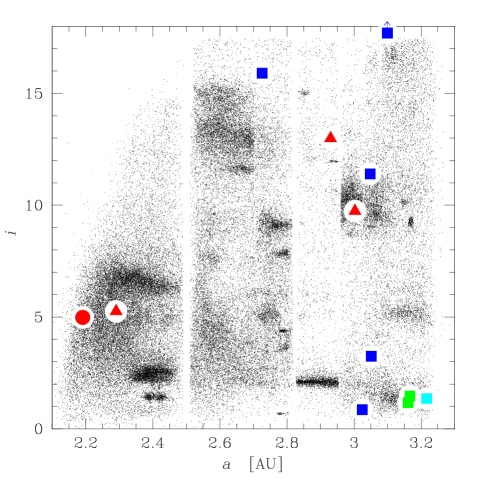
The object P/2013 P5 (PANSTARRS) —hereafter P5— was discovered on 2013 August 15 with the Pan-STARRS1 telescope on Haleakala, Hawai‘i, with a 30′′ tail (Bolin et al.,, 2013). Follow-up observations showed a tail at least long. Its orbital elements ( AU, , , marked in Fig. 1) and its Tisserand parameter place P5 in the inner asteroid belt, at the edge of the region occupied by the Flora family. Judging from its position in the Main Belt, P5 probably is a S-class object. The orbit of P5 has the smallest semi-major axis of all MBCs and also the lowest orbital eccentricity.
2 Observations
| Date1 | Telescope/Instrument | PsAng5 | PsAMV6 | Airm.7 | Exp.T.8 | Filter | |||
|---|---|---|---|---|---|---|---|---|---|
| 2013-Aug-30.367 | CFHT/MegaPrime | 2.127 | 1.128 | 5.3 | 200.4 | 245.2 | 1.182 | 900 | r |
| 2013-Aug-30.380 | CFHT/MegaPrime | 2.127 | 1.128 | 5.3 | 200.4 | 245.2 | 1.139 | 900 | g |
| 2013-Sep-01.153 | NTT/EFOSC2 | 2.125 | 1.124 | 4.7 | 190.9 | 245.1 | 1.247 | 4500 | R |
| 2013-Sep-03.250 | NTT/EFOSC2 | 2.122 | 1.120 | 4.2 | 176.9 | 245.0 | 1.264 | 13500 | R |
| 2013-Sep-05.342 | CFHT/MegaPrime | 2.119 | 1.117 | 4.0 | 159.6 | 245.0 | 1.206 | 1800 | r |
| 2013-Sep-06.204 | NTT/EFOSC2 | 2.118 | 1.116 | 4.0 | 152.3 | 245.0 | 1.234 | 10200 | V |
| 2013-Sep-10.412 | CFHT/MegaPrime | 2.113 | 1.114 | 5.0 | 122.6 | 244.8 | 1.065 | 1800 | r |
| 2013-Sep-11.851 | CA1.23m/DLR-MKIII | 2.111 | 1.115 | 5.4 | 115.5 | 244.8 | 1.720 | 3300 | R |
| 2013-Sep-25.850 | CA1.23m/DLR-MKIII | 2.092 | 1.145 | 12.2 | 86.3 | 244.4 | 1.665 | 2100 | R |
| 2013-Sep-28.264 | CFHT/MegaPrime | 2.089 | 1.154 | 13.3 | 84.3 | 244.4 | 1.218 | 1048 | r |
| 2013-Sep-29.213 | CFHT/MegaPrime | 2.088 | 1.158 | 13.8 | 83.6 | 244.3 | 1.575 | 540 | r |
| 2013-Sep-30.248 | CFHT/MegaPrime | 2.087 | 1.163 | 13.8 | 82.9 | 244.3 | 1.277 | 540 | r |
| 2013-Sep-30.235 | CFHT/MegaPrime | 2.087 | 1.163 | 13.8 | 82.9 | 244.3 | 1.267 | 540 | g |
| 2013-Sep-30.251 | CFHT/MegaPrime | 2.087 | 1.163 | 13.8 | 82.9 | 244.3 | 1.262 | 540 | i |
| 2013-Oct-04.202 | Perkins/PRISM | 2.082 | 1.182 | 16.0 | 80.7 | 244.2 | 1.245 | 3600 | R |
| 2013-Oct-05.125 | TRAPPIST/PL3041-BB | 2.080 | 1.188 | 16.5 | 80.2 | 244.2 | 1.160 | 20880 | Rc |
Notes: 1: UT, mid-exposure; 2 and 3: helio- and geocentric distances [AU]; 4: solar phase angle [degrees]; 5 and 6: position angles of the extended Sun–target radius vector, and the negative of the target’s heliocentric velocity vector, respectively, as seen in the observer’s plane of sky [degrees as measured N to E]; 7: airmass; 8: total exposure time [s].
Table 1 lists the observations, and the telescopes and instruments used are briefly described below. All the observations were acquired as series of short exposures for which the telescope tracked the comet. The telescope was moved between each of the exposures by a small random offset. Twilight exposures were acquired as flat-fields. Zero-second exposures were collected during day-time to characterize the bias level. Some Landolt, (1992) fields were observed, but most of the nights included here were not photometric. Photometric calibration is discussed below.
NTT: The observations were performed at the ESO 3.56m New Technology Telescope (NTT) on La Silla, with the ESO Faint Object Spectrograph and Camera (v.2) instrument (EFOSC2, Buzzoni et al.,, 1984; Snodgrass et al.,, 2008), through Bessel V, and R filters, using the ESO#40 detector, a 2k2k thinned, UV-flooded Loral/Lesser CCD, which was read in a 22 bin mode, resulting in 024 pixels and a 41 field of view.
CFHT: The observations were acquired at the 3.6m Canada France Hawai‘i Telescope (CFHT) on Mauna Kea, with the MegaPrime instrument, using only one of the 36 detectors in the MegaCam mosaic: the Marconi/EEV CCD42-90 named Auguste, with a pixel scale of 0187. The filters used were the Sloan g’, r’, i’.
CA: The 1.23 m telescope on Calar Alto was used with the DLR-KMIII camera equipped with an e2v CCD231-84-NIMO-BI-DD CCD with 4k4k pixels of 15 m. It was used in a 22 bin mode, resulting in a pixel scale of 0628 and a field of view of . It was used with the Johnson_R filter.
Lowell: Observations at the Lowell observatory were made with the Perkins 1.8 m telescope on UT 2013 Oct 4 with the PRISM reimaging camera (SITE 2k2k CCD) through the Bessell R band filters under photometric conditions. The plate scale of the detector is 039/pix.
TRAPPIST: The comet was observed with the robotic 0.60m TRAPPIST (TRAnsiting Planets and PlanetesImals Small Telescope; Jehin et al.,, 2011) located at the ESO La Silla Observatory. The camera was a FLI ProLine PL3041-BB with 2k2k pixels of 15 m. It was used with the Cousin R filter and in 22 bin mode, resulting in a pixel scale of 13 and a field of view of 22′.
3 Data processing
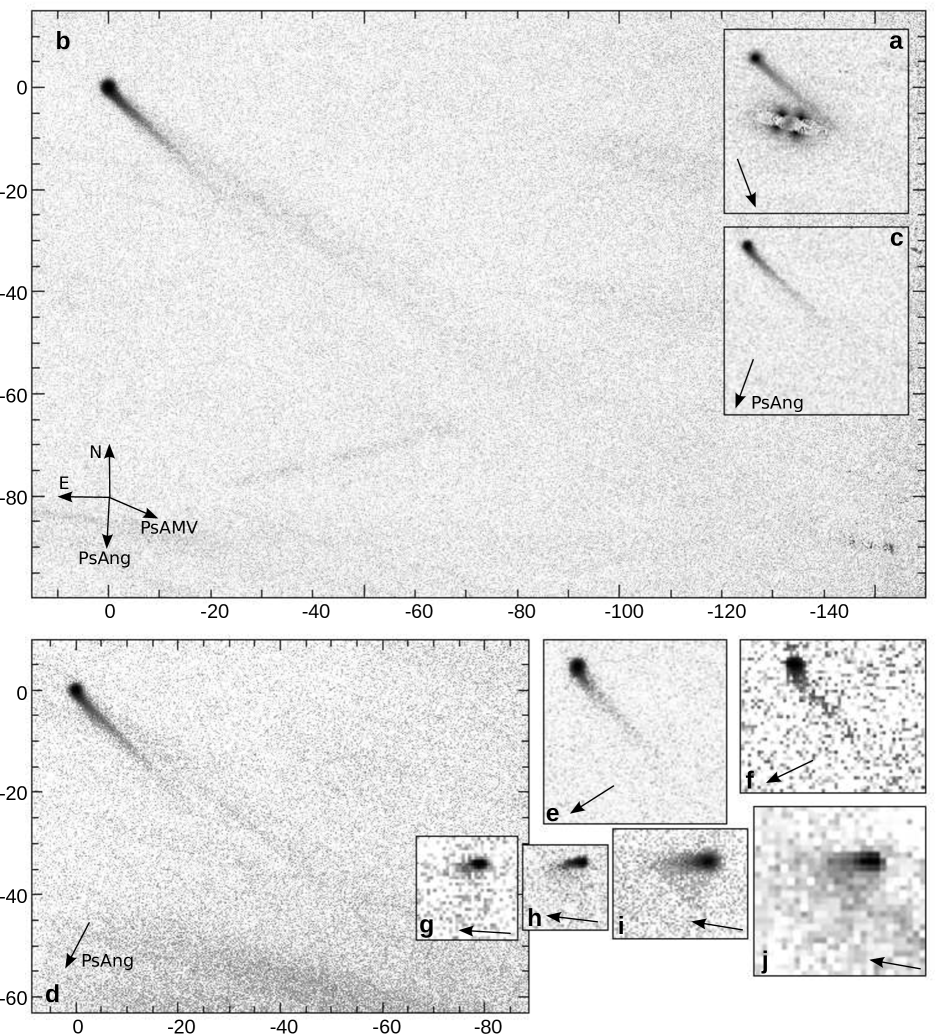
The data were processed using custom scripts in IRAF and ESO-MIDAS. The images were corrected for instrumental signature by subtracting a master bias frame and dividing by a master flat-field frame obtained from twilight sky images. The offsets between images of a same dataset were corrected for using series of field stars, and the images stacked using a median to create a template image of the field, which was astrometrically calibrated using field stars from the USNO catalogue. The motion of the comet was compensated for using the astrometric solution to compute the offsets between expected positions of the comet from JPL’s Horizons ephemerides. The frames were shifted and then combined using either a median combination or an average rejecting the pixels deviating from the median value to remove the stars and background objects as well as detector defects and cosmic-ray hits. For datasets with enough frames for the template not to show residuals from the comet, the field template image was subtracted from the individual frames to remove the background objects. When needed, the resulting images for each dataset were flipped to set them to the standard orientation. These final images are presented in Fig. 2.
4 Analysis
4.1 Object characterization
4.1.1 Light curve
The data from the NTT on 2013 September 03 cover more than 4h 40m and were acquired with a fairly clear sky, even if not photometric; those from TRAPPIST on 2013 October 05 were acquired under photometric conditions and cover 6h. They constitute the best dataset to detect a rotational light curve. The flux of the object and of a series of non-saturated stars visible in most of the frames was measured in a series of concentric apertures centred on the object; the background was estimated from a much wider annulus, rejecting from the average the values of outlying pixels. Comparing the light curves of these reference stars, we decided to pick the 5′′ aperture for the NTT, and 45 (3 pixels) for TRAPPIST. On the NTT, the reference stars show variations of 0.15 mag caused by the variable extinction, while the TRAPPIST data are stable at the percent-level. The magnitude of the object was measured relative to reference stars. For the NTT, a photometric zero point was used, obtained a few nights before the observations. The zero point for the TRAPPIST images was obtained using 79 PPMXL stars in the field, and tied to star 1417242133114009170 ( 22:20:25.256, -1:17:14.64). Fig. 4 displays the light curves. Gaps are present in the light curves at the time intervals when the object was too close to a background object. The light curves were searched for periodic signal in the 0.1 to 3h range using the phase dispersion minimization method implemented in Peranso (CBABelgium.com). The periodograms do not show any significant signal; P5 does not show any sign of any rotational light curve: both datasets are compatible with a sine-wave shaped light curve with a half-amplitude mag (NTT) and mag (TRAPPIST), for light curve periods shorter than twice the time span of the data series. Because most asteroid light curve are double peaked, this corresponds to a rotational period h (NTT) and h (TRAPPIST).
The reason for this lack of rotational signature can be that the amplitude is too small to be detected, either because the cross-section of the nucleus does not change by more than a few percent (either because the nucleus is not very elongated, or because we are seeing it close to pole-on), because of the (fairly constant) contamination by the dust dilutes the nucleus light curve, because the rotation period is longer than the duration of the observations, or because of a combination of these factors.
a. b.
b.
4.1.2 Colours
On 2013 September 30, the CFHT acquired three frames in each of the , , and filters under photometric conditions. The magnitude of the object was measured in the co-added images in each filter using a series of concentric apertures ranging from 1 to 10” in diameter; the residual sky background was estimated as the median value of an aperture wide, manually selected on each frame in a region near the object and free of background sources. To minimize the dust contamination by the coma, the instrumental magnitudes measured in the diameter aperture were kept and corrected for the difference between that aperture and the total flux of an artificial star with the same FWHM as the field stars. The instrumental magnitudes were then converted into standard magnitudes using the conversion listed in the MegaCam manual, including the standard photometric solutions. For reference, the BVRI colours were also computed using the relations in Fukugita et al., (1996). They are listed in Table 2.
| Object or class | ||
|---|---|---|
| P5 | 0.580.05 | 0.230.06 |
| Solar1 | 0.400 | 0.109 |
| C-class1 | 0.432 | 0.114 |
| D-class1 | 0.527 | 0.214 |
| S-class1 | 0.600 | 0.196 |
| Short-period comets2 | 0.658 | 0.222 |
1 Fitzsimmons, (2011); 2 Hainaut et al., 2012a
In the colour table of the taxonomic classes in the ugriz AB magnitude system from Fitzsimmons, (2011), the colours of P5 are compatible with those of the S-class. D-class, which is slightly less red than P5 (see Table 3), is a slightly poorer match. It is also worth noting that 133P and 176P (Licandro et al.,, 2011), and 238P (Hsieh et al.,, 2009), i.e. the Main Belt comets whose activity patterns are compatible with sublimation-driven activity, have colours typical of C-class asteroids (, ), also significantly less red than those of P5. For completeness, the average of short-period comets is redder than those of P5 (Hainaut et al., 2012a, ). The position of P5 in the inner Main Belt supports the hypothesis that it is am member of the S-class.
4.1.3 Nucleus size
The CFHT AB magnitudes were converted into the Vega system using the relations in the MegaCam manual. Together with the NTT magnitude, they were transformed in absolute magnitude using the geometric information from Table 1. The solar magnitudes used were (Ivezić et al.,, 2001) and (Pecaut and Mamajek,, 2013). Using the average albedo for S-class asteroids, (DeMeo and Carry,, 2013), but without correcting for the (unknown) solar phase correction, the absolute magnitudes were converted into nuclear radii and are listed in Table 4. Because the measurements are contaminated by the resolved coma, these are upper limits.
| Dataset | Magnitude | Radius [km] | |
|---|---|---|---|
| 2013-Sep-03 | |||
| 2013-Sep-29 |
4.1.4 Tail
Measurements
Geometry and nature of the tail: Figure 2 shows the evolution of the appearance of P5 during a month around opposition, while the viewing geometry changed dramatically, with the anti-solar direction spanning over 120. Concurrently with that change of geometry, the main tail orientation and opening angle evolved rapidly, overall as would be expected from a dust tail under the effect of radiation pressure.
Furthermore, a hypothetical plasma tail would have had very different appearances in the deep NTT R and V images (Fig. 2b and d, because the main H2O+ band (700–770 nm) is well within the transmission bandwidth of the R filter while it is outside the V pass-band), and the orientation of a plasma tail would project roughly along the north-south direction (that is, perpendicular to the solar wind velocity and opposite to the direction of the interplanetary electric field, see Hansen et al. 2007). We can therefore firmly rule out that the tail of P5 is plasma, and below, we consider only a dust tail.
Identification and measurements of the tail features: We performed a detailed analysis of our deepest images. The first step was to identify and measure recognizable morphological features, such as possible jets, fans, and streamers.
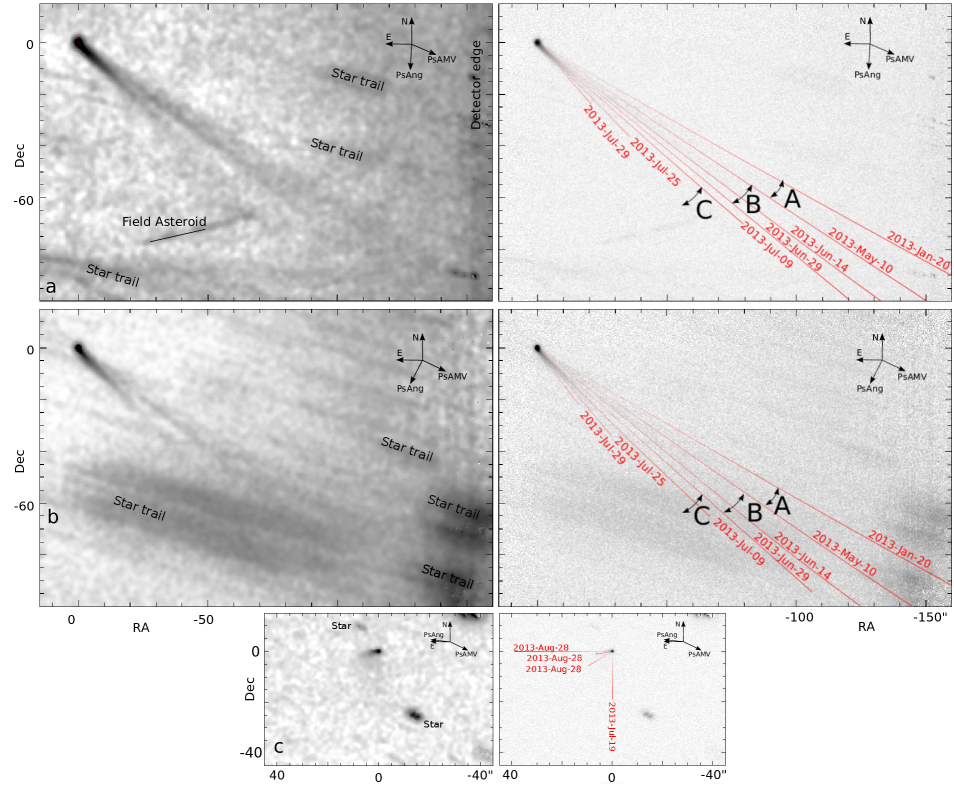
Method: The images were explored visually, adjusting the display look-up table and stretch function to reveal low contrast features. Furthermore, different methods where applied to numerically enhance the very faint surface brightness features: smoothing and spatial median filtering, as well as adaptive smoothing. For the standard smoothing and median filtering, the filter size used ranged from a few to a few tens of pixels. The adaptive filtering used is based on the filter/adaptive command in ESO-MIDAS command, which works as follows: the local signal-to-noise ratio (S/N) is evaluated at different scale-lengths via the Laplace H-transform. The smallest order at which the local S/N reaches a value of 3 sets the local resolution of the filter, and the signal in that filter is kept. In short, this method smooths the image with the variable filter size, ensuring that the S/N of each resulting pixel is 3 or more. Results from the adaptive filtering are displayed in Fig. 3. The composites and their enhanced versions were also converted into polar coordinates, with the pole on the nucleus of P5. In these images, radial features in the comet appear as parallel bands.
Reality of the features: We are confident that all the features listed below are real:
-
•
When a feature was detected in one enhanced version of an image, it was checked for in others, and in the original composite. Only the features that could be confirmed were retained.
-
•
While the surface brightness of some feature is barely above the local background at the pixel level, the total S/N of the streamers is fairly high. For instance, the flux from the faintest streamer of the 2013 September 06 image (streamer B, described below) was integrated in the original composite over a length of 40′′ and over its width, leading to a S/N of 17. The significance of the whole streamer is even higher.
-
•
The features measured on the deep 2013 September 03 composite are recognized also in the deep images of 2013 September 06, in spite of the different geometry.
-
•
As additional a posteriori argument: the Finson-Probstein analysis described below leads to the same dust emission date for a given feature measured in different images. This also further confirms the validity of the hypothesis of the dust nature of the tail.
-
•
A recent article by Jewitt et al., (2013), which became available while the present paper was being reviewed, reported observations of similar streamers in P5 images acquired with HST. While these images are sensitive only to the very inner part of the object, the morphology and position of the streamers are similar to those reported here. This is discussed below in more detail.
Precision of the measurements: The position angle (PA) of the features was measured with respect to the nucleus. Repeating the measurement at various positions on the feature, the precision of the PA is estimated at . The length of the features was also measured; again, repeating the measurements, the precision on the length is estimated at to several arcseconds depending on the feature.
Description of the features:
NTT, 2013 Sep. 3 and 6: P5 displays a wide dust tail, fanning about 20 in the south-west quadrant, about 40–60 from the anti-solar direction. Its length can be traced over 25, and appears shorter at decreasing PA. Three main structures are identified; their lengths () and PAs are listed in Table 5 and are marked in Fig. 3:
-
A
Weak, uniform streamer, with a surface brightness slowly decreasing over PA from 240 to 235. The borderlines are labelled A1 and A2.
-
B
Narrow streamer, brighter than A. It is limited by B1 (=A2) and B2; the brighness peak is Bmax at PA.
-
C
Fairly wide, bright streamer, whose surface brightness steeply decreases at PA. Its maximum is labelled Cmax, and its borderlines are C1 (far from the nucleus) and B2 (close to the nucleus), and C2.
CFHT, 2013 Sep. 28 and 29: The tail is in the general antisolar direction, brightest at PA, and not detected beyond PA; the enhanced image shows a very faint and diffuse tail toward PA. No clear streamer was identified. The visible extension of the tail was measured at various PAs, which are reported in Table 6.
We only measured the orientation of the tail for the other epochs.
| Tail features | 2013-Sep-3.25 | 2013-Sep-6.20 | ||
|---|---|---|---|---|
| d | d | |||
| Borderline and/or Maxima | Measurement | FP analysis | Measurements | FP analysis |
| A1 |
PA
|
PA
d 2013-Jan-20 |
PA
|
PA
d 2013-Jan-20 |
| A2=B1 |
PA
|
PA
d 2013-May-10 |
PA
|
PA
d 2013-May-10 |
|
PA
|
PA
d 2013-Jun-14 |
PA
|
PA
d 2013-Jun-14 |
|
| B2 |
PA
|
PA
d 2013-Jun-29 |
PA
|
PA
d 2013-Jun-29 |
| C1 |
PA
|
PA
d 2013-Jul-09 |
– | |
| Cmax |
PA
|
PA=
d 2013-Jul-22 |
PA
|
PA
d 2013-Jul-22 |
| C2 |
PA
|
PA
d 2013-Jul-29 |
PA
|
PA
d 2013-Jul-29 |
| Borderline and/or Maxima | Measurement | FP analysis |
|---|---|---|
| North borderline | PA |
Youngest dust
d 2013-Sep-27 |
| Brightest line |
PA
|
d 2013-Aug-29 |
| Longest east-ward extension |
PA=
|
PA=
d 2013-Aug-20 |
| Longest south-ward extension |
PA
|
PA
d 2013-Jul-20 |
Analysis
The Finson-Probstein method: We used the Finson and Probstein, (1968) method (hereafter FP) to analyse the position and extent of the tail and of the streamers. The FP method assumes that dust grains are released from the nucleus with zero velocity at an epoch , and computes their position at the time of observations , taking into account the solar radiation pressure and gravity. The ratio of these two forces is , which is related to the size and density of the dust grain by
| (1) |
where is the grain radius [m] and its density [kg m-3]; is the radiation pressure efficiency, whose typical value is 1–2 depending on the material scattering properties (Finson and Probstein,, 1968). This relation is valid only for particles larger than the observation wavelength. In the analysis below, we worked with kg m-3 —the average density of 11 Parthenope and 20 Massalia, two S-type asteroids (Britt et al.,, 2002). Of course, the grains could be porous and therefore have a lower density; the mass estimates below would then need to be scaled down accordingly.
A line connecting grains of different emitted at a given is a synchrone, and a line connecting all grains of a given , emitted at different , is a syndyne. The FP method does not have free parameters: a combination of emission time and force ratio will lead to a unique position in the image plane. Whether a position in the image plane corresponds to a unique combination of and or a multiple one (or no solution) depends on the viewing geometry alone. In the case of P5, we were lucky to have a very favourable geometry that nicely spread the syndynes and synchrones.
Results: For the shallow images, the orientation of the tail is found to evolve quickly from PA to as the object passes through opposition, as expected from the FP models computed for these epochs.
For the deep images, the resulting synchrones appear essentially as straight lines for emission times about a month before observation. The dust grains are sorted linearly —in a very good approximation— along the synchrones according to their ratio. From scanning the values of and , we obtained the value that matched the PA and length of the streamers and the corresponding uncertainty ranges; the best fits are reported in Tables 5 and 6, and the corresponding synchrones are drawn in Fig. 3. It is worth noting that the emission epochs for the various streamers measured in the two independent NTT images perfectly match in spite of the different geometry. Because these epochs are coming straight out of the FP code, without any adjustable parameter, this additionally confirms our hypothesis that the tail is composed of dust grains.
Because the FP method considers dust grains emitted with zero velocity, the resulting tail model is a perfectly flat structure in the orbital plane of the object. The structures in the object’s observed tail are blurred by two phenomena: the atmospheric seeing, which degrades the resolution of the image, and the actual dust grain emission velocity and direction distribution. More observations of the comet when the Earth crosses the orbital plane would give a direct constraint on the out-of-plane velocity of the grains. In the meantime, we can estimate a limit from the dispersion of streamer Cmax, the sharpest feature in the tail of P5, emitted 40 d before the observations. If we consider that its entire width () is caused by dust emission velocity, this leads to a velocity in the plane of sky of 1.2 m s-1. For comparison, the escape velocity (using the radius and density discussed above) is m -1, and a Bobrovnikoff, (1954) ejection velocity, assuming the dust is dragged by sublimating water vapour, is m s-1.
It is noted that in the deep NTT exposure of both epochs of early 2013 Sep., there is a tiny cluster of knots with enhanced brightness seen in streamer B. These knots are at 34, 42 and 53′′ distance from the nucleus on 2013 September 03.25 and on 34, 43, and 54′′ on 2013 September 06.2. These distances are equivalent to = 0.0029, 0.0036 and 0.0045, respectively. Since the area in the images where these knots are found also contains remnant signals from the removal of background objects, it remains open whether or not the knots represent spikes in the distribution of the ratio. At least, the results found for both observing epochs are consistent with each other, allowing the interpretation of spikes in the size distribution of the dust grains. Note that larger chunks —or even sub-nuclei— ejected with velocity would be located very near to the main nucleus. Their presence in this region of the tail would imply a significant ejection velocity, while the whole tail structure is compatible with 0 velocity.
Quantification of the mass-loss: Following the method described in detail in Hainaut et al., 2012b , we estimated the quantity of dust in the streamers, focusing on the regions around the two brightest lines, and . The distance to the nucleus along one of these lines is converted into a value for using the output of the FP program, and into a particle radius assuming a grain density kg m-3 and a radiation pressure efficiency in Eq. 1. The deep image from 2013 September 03 was rotated to align the line that was measured along the -axis of the image, and the flux measured in a series of or apertures covering the line ( covers most of the bright region along and , was used to include the full B streamer). The flux in each box was converted into a number of particles, using , , , and the geometric parameters from Table 1. Figure 5 shows the resulting distributions along and , together with a linear fit to the part of the distribution with the best signal-to-noise ratio. The left parts of the curves are dominated by the noise in the faintest part of the tail, and the right part is truncated at 2” from the nucleus, because its PSF dominates the flux. The smaller dust grains of B have left the field of view, while the large grains of C are lost in the glare of the PSF of the nucleus. The deviation of the left part of the curve from a line can be fully accounted for by background objects and variations in the sky background. Moreover, this is in the range of sizes as small as the wavelength of observations, so Eq. 1 will not be reliable anymore. While the absolute number of particles in each streamer is different, their slopes are very similar, suggesting that the same grain distribution was emitted in the B and C streamers.
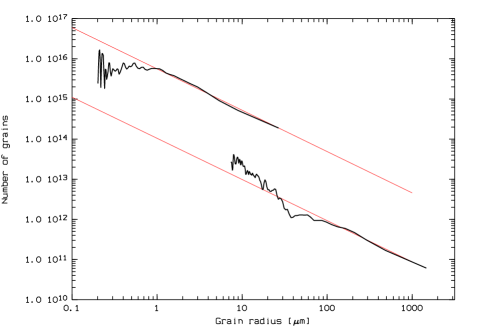
Integrating the mass of the dust grains in leads to a total mass kg, for grains smaller than 1.5 mm. Integrating over the similar distribution measured on the full streamer (with a wider aperture) leads to kg. As the integrated area corresponds to about 50 days of activity, this leads to an average mass loss rate of 0.7 kg s-1.
Similarly, integrating the visible grains over give kg. As the slopes of the two distributions are very similar over their different ranges, it is reasonable to consider the C streamer extends similarly to grains of 1.5 mm; the mass for grain smaller than 1.5 mm would then scale to kg. The peak of activity lasted less than 20 d, so the mass loss rate was at least 15 kg s-1.
Interpretation – activity scenario: In the NTT images from early 2013 Sep., the FP analysis indicates that P5 released dust since late Jan. 2013 (A1) until at least a few days before the observations (dust extending beyond C2), with a peak on 2013 June 14 (Bmax), and a second peak on 2013 July 22 (Cmax). The CFHT images from late Sep. also confirm the dust production extends until that epoch. Because of the completely changed geometry during the CFHT observations, and because the images do not reach very low surface-brightness levels, the streamers detected on the NTT images are diluted over a larger area and too faint to be detected. The brightest C streamer appears as the longest extension of the tail in the CFHT data. This also explains why the ratios measured on the CFHT images are lower than those from the NTT data.
Based on the FP analysis of the tail and the streamers in the tail, we conclude that
-
•
The dust emission started —or increased from an undetectable level— around 2013 January 20 (marked by A1), 450 d before perihelion, at AU; based on the angular width of the A1 borderline, this increase happened within less than 20 d. This period of dust emission lasted for about 110 d (until A2). The fairly constant surface-brightness of the streamer between A1 and A2 suggests a fairly stable dust release rate. Only grains larger than m are visible (for a density kg m-2); smaller grains have been pushed beyond the field of view.
-
•
Around 2013 May 10 (B1), the activity started to increase toward a maximum that took place on 2013 June 14 (AU, marked by Bmax), and then dropped until 2013 July 09 (B2 borderline); during this phase, the object ejected grains with up to 0.008 (about 10m).
-
•
During the period from 2013 June 29 (B2) until 9 July (C1), the surface brightness was much lower, suggesting a lower dust release rate.
-
•
The activity then increased rapidly, reaching a peak on 2013 July 22 (AU, Cmax), i.e. a few weeks before the object was discovered. This last streamer is fully within the FoV, with up to 0.023, ie micron-sized grains. The C streamer is only marginally resolved in width, suggesting this emission episode was short. We suggest that this brutal increase contributed to the discovery of the object.
-
•
Both the NTT and CFHT data indicate that the dust release continued well into the respective observing epoch, i.e. for CFHT until late 2013 Sep.
All the changes of activity level are sharp, unresolved in our data, suggesting that they occurred during short periods of time.
In conclusion, P5 was continuously releasing dust during at least the 8 months after late Jan. 2013 showing —until now— three to four short episodes of higher dust emission. Its activity still continued at the time of the last observations, on 2013 September 29. It has released dust grains in the 1–1000 m range (assuming a density kg m-3), at low velocities ( m s-1).
During the refereeing process of this paper, Jewitt et al., (2013) published a report of P5 observations acquired with the Hubble Space Telescope (HST) on 2013 September 10 and 23. The spatial resolution of the HST images is much finer than that of our images, which made the Hubble data much more sensitive to unresolved sources —such as very narrow streamers. However, the collecting power of the NTT and CFHT, combined with the very long total exposure time of our observations allowed us to reach fainter surface brightnesses for extended objects, for which high resolution is of no benefit. In summary, the two data-sets are complementary. The HST images reveal a set of narrow streamers that Jewitt et al. analysed with a method similar to that exposed here; they also concluded that each streamer might be associated with a single date of dust ejection. The first streamer they detected corresponds to mid-April 2013, i.e. HST failed to detect the earlier late-January emission of our streamer A. They also reported a set of two streamers with emission dates on 2013 July 18 and 24, which we observe, blended, as the peak of streamer B. Overall, our observations are fully compatible, our deep NTT images extending the beginning of the dust emission to an earlier time than HST’s, and Hubble’s high resolution shows that the streamers and their edges are even sharper than visible on our images.
5 Discussion
Which process is responsible for lifting the dust from the nucleus of P5?
An impact, by definition extremely short-lived, cannot reproduce the observed dust release extending over months, with its increasing dust production and intermediate maxima. Moreover, the dust morphology is very different from that of impact-triggered emissions, such as that in P/2010 A2 (Hainaut et al., 2012b, ) or in (596) Scheila (Ishiguro et al., 2011a, ). We consider a series of impacts hitting P5 several times during 2013 as implausible. A collision could have exposed a hypothetical underlying ice layer whose sublimation would continue the dust-lifting after the impact. However, a dust production maximum would be expected at the beginning of the sequence, which is not observed. More importantly, the presence of volatile ice would be needed in this scenario; this is discussed below.
This object has the lowest semi-major axis of all Main Belt active asteroids. Its radius is smaller than 300 m. Thermal models developed for the study of P/2010 A2 (on a similar orbit, but with a radius of about 100 m, Hainaut et al., 2012b, ) showed that an S-class object would be fully depleted of water ice within a few years. Furthermore, P5 might be a member of the Flora collisional family and an S-type asteroid; as noted by Jewitt et al., (2013), these objects reflect metamorphism to temperatures in the 800 to 960C range. The presence of water ice is therefore unlikely.
The eccentricity of P5 is the lowest of all the Main Belt comets, so that the incident solar radiation at perihelion is only 60% higher than at aphelion. While the dependency of the sublimation rate is very steep with temperature (Meech and Svoren,, 2004), Fig. 5 from Jewitt, (2012) suggests that the change in dust production rate is only of the order of 2.
Nevertheless, volatile sublimation (if present) might explain the observed dust release: the activity started as the comet moved closer to the sun, with some irregularity and short outbursts, but with an overall increase. The size and distribution of the lifted particles is also as expected for cometary activity.
Electrostatic processes and radiation-sweeping would not be able to lift the large dust grains observed: Jewitt, (2012) indicated a of about 1m for an object with the characteristics of P5 (see his Fig. 5), i.e. much smaller the size of the observed dust grains.
Rotational disruption is a possible explanation, too: while the rotation of P5 was not detected, a fast rotating object cannot be ruled out. Furthermore, the object is small, i.e. in the range that can be efficiently spun up by the YORP effect —although the efficiency of the YORP effect is also strongly tied to the shape of the object, which is unknown. It is possible that it reached its critical rotation frequency, causing shedding of particles from its equator and in a plane, which would mark the beginning of the activity period. Observations from different geometries (before and after orbital-plane crossing) may be able to constrain the 3D geometry of the tails. Since the YORP effect also drives small asteroids towards preferred pole directions, this can be considered. Together with a pole reconstruction from future nucleus light curves, this could prove or dispute this theory. Of course, these light curves should also reveal the rotation rate of the nucleus directly, which will also prove or dispute it. For a spherical object, the critical spin can be estimated by setting the equatorial velocity at the escape velocity , leading to –2.3 h for a density in the 1000–3000 kg m-3 range. The initial ejection of material can be followed by a landslide-like re-organization of the rubble pile, leading to further dust release (see Richardson et al.,, 2005, for numerical simulations). While there is, to our knowledge, no information on the duration of such a rubble-pile re-organization, it seems reasonable that it would last much longer than an impact, but 8 months seems a long time. The initial YORP-induced disruption could have induced movement leading to exposed sub-surface ices whose sublimation could have taken over the extended activity —this last scenario would again imply the presence of volatile ice in the object.
Alternatively, the observed dust emission pattern might be
caused by the two components of a contact or near-contact binary
object gently rubbing each other. In this scenario, we are
witnessing the formation of a bilobate asteroid from the low-speed
merger of a binary pair, as described in recent analytical solutions
by Taylor and Margot, (2013): before contact is firmly established between the
components, they are expected to wobble slightly around their
elongation axis. As the orbit decays, there will be a time when the
extremities of the two objects come into contact, at very low
velocity. This would cause some surface break-up and liberation of
dust. Once the contact is established, it is also likely that the
two components will settle over an extended period of time, also
releasing dust. Considering that the total photometric cross-section
of the object is caused by two spherical objects, they would have
radii m. Setting the object on contact
orbit, Kepler’s third law indicates the rotation/revolution period
of the system would be in the range of 6.7–11.6 h (for a density in
the range of 1000-3000 kg m-3); prolate objects will have a slower
revolution. The total volume of dust ejected (around m3
from the above-discussed mass estimate) would correspond to the
shaving of a 3 m cap from the 180 m radius objects.
Furthermore, because the system is very elongated, the light curve would
be expected to have a very large amplitude. As discussed in Section
4.1.1., the light curves presented in here do not show any variation,
but this can be explained by the strong contamination by the dust.
Again, future nucleus light curves may be able to prove or dispute this theory.
In summary, our observations of P/2013 P5, from late August until late 2013 September, indicate that the object has emitted dust at least since late 2013 January, i.e. 450 d before perihelion. While the activity seems continuous and overall increasing, there were at least two episodes of more intense activity, around 2013 June 14 and July 22. The dust size distribution appears to be similar during these events, with dust grains at least in the range from 1 m to 1 mm (larger grains may be present, but cannot be measured in our data). The dust mass ejected during these two peaks of activity amounted to kg and kg, which corresponds to average mass-loss rates of 0.7 and 15 kg s-1.
Rotational disruption and a rubbing contact binary are plausible processes to explain the observed dust release; future observations can either prove or disprove this. While the presence of volatile ice in P5 would be challenging, theoretical studies and models suggest that some water could have survived even in the inner asteroid belt. With the discovery of the Main Belt comets, models to explain activity for objects occupying the outer belt initially suggested that ice could remain buried deep, and that having a high obliquity would support volatile survival.
As more of these enigmatic objects are discovered, it seems more likely that not only were there many volatiles in many areas of the asteroid belt in the early solar system, but that they may still be there. The dynamical landscape of the young solar system is changing as new models try to explain the architecture of our solar system (Tsinganis et al.,, 2005; Walsh et al.,, 2011) and as disk models and observations try to refine the location of the water-ice line during the epoch of planet building. Additionally, new dust-releasing processes are being uncovered and explored. It is clear that only a detailed study of these interesting objects coupled with dynamical models and other constraints will help us understand the conditions in the early solar system.
Acknowledgements.
Based on observations obtained with MegaPrime MegaCam, a joint project of CFHT and CEA/DAPNIA, at the Canada-France-Hawaii Telescope (CFHT) which is operated by the National Research Council (NRC) of Canada, the Institut National des Science de l’Univers of the Centre National de la Recherche Scientifique (CNRS) of France, and the University of Hawaii. Based on observations made with ESO Telescopes at the La Silla Paranal Observatory under programme ID 184.C-1143(H). The German-Spanish Astronomical Center at Calar Alto is operated jointly by the Max-Planck-Institut für Astronomie (MPIA) in Heidelberg, Germany, and the Instituto de Astrofísica de Andalucía (CSIC) in Granada/Spain. TRAPPIST is a project funded by the Belgian Fund for Scientific Research (Fonds de la Recherche Scientifique, F.R.S FNRS) under grant FRFC 2.5.594.09.F, with the participation of the Swiss National Science Fundation (SNF). E. Jehin and M. Gillon are FNRS Research Associates, J. Manfroid is Research Director FNRS. C. Opitom thanks the Belgian FNRS for funding her PhD thesis. This material is based upon work supported by the National Aeronautics and Space Administration through the NASA Astrobiology Institute under Cooperative Agreement No. NNA09DA77A issued through the Office of Space Science, and is in addition supported by grant # 1010059 from the National Science Foundation. CS received funding from the European Union Seventh Framework Programme (FP7/2007-2013) under grant agreement no. 268421. Image processing in this paper has been performed, in part, using IRAF Tody, (1986). This software is distributed by the National Optical Astronomy Observatories, which is operated by the Association of Universities for Research in Astronomy, Inc., under cooperative agreement with the National Science Foundation, USA. Image processing in this paper has been performed, in part, using ESO-MIDAS (version 10SEPpl1). This software was developed and is distributed by the European Southern Observatory. We wish the anonymous referee a prompt recovery from his long and debilitating illness.References
- Agarwal et al., (2013) Agarwal, J., Jewitt, D., and Weaver, H. (2013). Dynamics of Large Fragments in the Tail of Active Asteroid P/2010 A2. ApJ, 769:46.
- Bobrovnikoff, (1954) Bobrovnikoff, N. T. (1954). Reports of observations 1953-1954: Perkins Observatory-Physical properties of comets. AJ, 59:356–358.
- Boehnhardt et al., (1998) Boehnhardt, H., Sekanina, Z., Fiedler, A., Rauer, H., Schulz, R., and Tozzi, G. (1998). Impact-Induced Activity of the Asteroid-Comet P/1996N2 Elst-Pizarro: Yes or No? Highlights of Astronomy, 11:233.
- Bolin et al., (2013) Bolin, B., Denneau, L., Micheli, L., Winscoat, W., Tholen, D. J., , Lister, T., and Williams, G. V. (2013). Comet P/2013 P5 (Panstarrs). Central Bureau Electronic Telegrams, 3639:1.
- Britt et al., (2002) Britt, D. T., Yeomans, D., Housen, K., and Consolmagno, G. (2002). Asteroid Density, Porosity, and Structure. Asteroids III, pages 485–500.
- Buzzoni et al., (1984) Buzzoni, B., Delabre, B., Dekker, H., Dodorico, S., Enard, D., Focardi, P., Gustafsson, B., Nees, W., Paureau, J., and Reiss, R. (1984). The ESO Faint Object Spectrograph and Camera (EFOSC). The Messenger, 38:9–13.
- DeMeo and Carry, (2013) DeMeo, F. E. and Carry, B. (2013). The taxonomic distribution of asteroids from multi-filter all-sky photometric surveys. Icarus, 226:723–741.
- Finson and Probstein, (1968) Finson, M. and Probstein, R. (1968). A theory of dust comets. 1. Model and equations. ApJ, 154:327–380.
- Fitzsimmons, (2011) Fitzsimmons, A. (2011). Asteroid colours in the ps1 photometric system. PS1 technical report, Pan-STARRS, pages http://ps1sc.ifa.hawaii.edu/ PS1wiki/ images/ Fitzsimmons.TheoreticalAsteroidColours–v3.pdf.
- Fukugita et al., (1996) Fukugita, M., Ichikawa, T., Gunn, J. E., Doi, M., Shimasaku, K., and Schneider, D. P. (1996). The Sloan Digital Sky Survey Photometric System. AJ, 111:1748–+.
- Haghighipour, (2009) Haghighipour, N. (2009). Dynamics, Origin, and Activation of Main Belt Comets. In “Icy Bodies of the Solar System,” Proc. IAU Symp. 263, J. Fernandez et al., Ed.
- (12) Hainaut, O. R., Boehnhardt, H., and Protopapa, S. (2012a). Colours of minor bodies in the outer solar system. II. A statistical analysis revisited. A&A, 546:A115.
- (13) Hainaut, O. R., Kleyna, J., Sarid, G., Hermalyn, B., Zenn, A., Meech, K. J., Schultz, P. H., Hsieh, H., Trancho, G., Pittichová, J., and Yang, B. (2012b). P/2010 A2 LINEAR. I. An impact in the asteroid main belt. A&A, 537:A69.
- Hsieh, (2013) Hsieh, H. H. (2013). Search for the Return of Activity in Active Asteroid 176P/LINEAR. In AAS/Division for Planetary Sciences Meeting Abstracts, volume 45 of AAS/Division for Planetary Sciences Meeting Abstracts, page 413.30.
- Hsieh et al., (2009) Hsieh, H. H., Jewitt, D., and Fernández, Y. R. (2009). Albedos of Main-Belt Comets 133P/Elst-Pizarro and 176P/LINEAR. ApJ, 694:L111–L114.
- Hsieh et al., (2004) Hsieh, H. H., Jewitt, D. C., and Fernández, Y. R. (2004). The Strange Case of 133P/Elst-Pizarro: A Comet among the Asteroids. AJ, 127:2997–3017.
- Hsieh et al., (2011) Hsieh, H. H., Meech, K. J., and Pittichová, J. (2011). Main-belt Comet 238P/Read Revisited. ApJ, 736:L18.
- (18) Hsieh, H. H., Yang, B., and Haghighipour, N. (2012a). Optical and Dynamical Characterization of Comet-like Main-belt Asteroid (596) Scheila. ApJ, 744:9.
- (19) Hsieh, H. H., Yang, B., Haghighipour, N., Kaluna, H. M., Fitzsimmons, A., Denneau, L., Novaković, B., Jedicke, R., Wainscoat, R. J., Armstrong, J. D., Duddy, S. R., Lowry, S. C., Trujillo, C. A., Micheli, M., Keane, J. V., Urban, L., Riesen, T., Meech, K. J., Abe, S., Cheng, Y.-C., Chen, W.-P., Granvik, M., Grav, T., Ip, W.-H., Kinoshita, D., Kleyna, J., Lacerda, P., Lister, T., Milani, A., Tholen, D. J., Vereš, P., Lisse, C. M., Kelley, M. S., Fernández, Y. R., Bhatt, B. C., Sahu, D. K., Kaiser, N., Chambers, K. C., Hodapp, K. W., Magnier, E. A., Price, P. A., and Tonry, J. L. (2012b). Discovery of Main-belt Comet P/2006 VW139 by Pan-STARRS1. ApJ, 748:L15.
- (20) Ishiguro, M., Hanayama, H., Hasegawa, S., Sarugaku, Y., Watanabe, J.-i., Fujiwara, H., Terada, H., Hsieh, H. H., Vaubaillon, J. J., Kawai, N., Yanagisawa, K., Kuroda, D., Miyaji, T., Fukushima, H., Ohta, K., Hamanowa, H., Kim, J., Pyo, J., and Nakamura, A. M. (2011a). Observational Evidence for an Impact on the Main-belt Asteroid (596) Scheila. ApJ, 740:L11.
- (21) Ishiguro, M., Hanayama, H., Hasegawa, S., Sarugaku, Y., Watanabe, J.-i., Fujiwara, H., Terada, H., Hsieh, H. H., Vaubaillon, J. J., Kawai, N., Yanagisawa, K., Kuroda, D., Miyaji, T., Fukushima, H., Ohta, K., Hamanowa, H., Kim, J., Pyo, J., and Nakamura, A. M. (2011b). Interpretation of (596) Scheila’s Triple Dust Tails. ApJ, 741:L24.
- Ivezić et al., (2001) Ivezić, Ž., Tabachnik, S., Rafikov, R., Lupton, R. H., Quinn, T., Hammergren, M., Eyer, L., Chu, J., Armstrong, J. C., Fan, X., Finlator, K., Geballe, T. R., Gunn, J. E., Hennessy, G. S., Knapp, G. R., Leggett, S. K., Munn, J. A., Pier, J. R., Rockosi, C. M., Schneider, D. P., Strauss, M. A., Yanny, B., Brinkmann, J., Csabai, I., Hindsley, R. B., Kent, S., Lamb, D. Q., Margon, B., McKay, T. A., Smith, J. A., Waddel, P., York, D. G., and the SDSS Collaboration (2001). Solar System Objects Observed in the Sloan Digital Sky Survey Commissioning Data. AJ, 122:2749–2784.
- Jacobson and Scheeres, (2011) Jacobson, S. A. and Scheeres, D. J. (2011). Dynamics of rotationally fissioned asteroids: Source of observed small asteroid systems. Icarus, 214:161–178.
- Jehin et al., (2011) Jehin, E., Gillon, M., Queloz, D., Magain, P., Manfroid, J., Chantry, V., Lendl, M., Hutsemékers, D., and Udry, S. (2011). TRAPPIST: TRAnsiting Planets and PlanetesImals Small Telescope. The Messenger, 145:2–6.
- Jewitt, (2012) Jewitt, D. (2012). The Active Asteroids. AJ, 143:66.
- Jewitt et al., (2013) Jewitt, D., Agarwal, J., Weaver, H., Mutchler, M., and Larson, S. (2013). The Extraordinary Multi-tailed Main-belt Comet P/2013 P5. ApJ, 778:L21.
- Jewitt et al., (2011) Jewitt, D., Stuart, J. S., and Li, J. (2011). Pre-discovery Observations of Disrupting Asteroid P/2010 A2. AJ, 142:28.
- Jewitt et al., (2010) Jewitt, D., Weaver, H., Agarwal, J., Mutchler, M., and Drahus, M. (2010). A recent disruption of the main-belt asteroid P/2010A2. Nature, 467:817–819.
- Jewitt et al., (2009) Jewitt, D., Yang, B., and Haghighipour, N. (2009). Main-Belt Comet P/2008 R1 (Garradd). AJ, 137:4313–4321.
- Kim et al., (2012) Kim, J., Ishiguro, M., Hanayama, H., Hasegawa, S., Usui, F., Yanagisawa, K., Sarugaku, Y., Watanabe, J.-i., and Yoshida, M. (2012). Multiband Optical Observation of the P/2010 A2 Dust Tail. ApJ, 746:L11.
- Kleyna et al., (2013) Kleyna, J., Hainaut, O. R., and Meech, K. J. (2013). P/2010 A2 LINEAR. II. Dynamical dust modelling. A&A, 549:A13.
- Kresak, (1980) Kresak, L. (1980). Dynamics, interrelations and evolution of the systems of asteroids and comets. Moon and Planets, 22:83–98.
- Landolt, (1992) Landolt, A. (1992). Ubvri photometric standard stars in the magnitude range 11.5 v 16.0 around the celestial equator. Astrophys. J., 104:340–371.
- Licandro et al., (2011) Licandro, J., Campins, H., Tozzi, G. P., de León, J., Pinilla-Alonso, N., Boehnhardt, H., and Hainaut, O. R. (2011). Testing the comet nature of main belt comets. The spectra of 133P/Elst-Pizarro and 176P/LINEAR. A&A, 532:A65.
- Lowry et al., (2007) Lowry, S. C., Fitzsimmons, A., Pravec, P., Vokrouhlický, D., Boehnhardt, H., Taylor, P. A., Margot, J.-L., Galád, A., Irwin, M., Irwin, J., and Kusnirák, P. (2007). Direct Detection of the Asteroidal YORP Effect. Science, 316:272–.
- Marzari et al., (2011) Marzari, F., Rossi, A., and Scheeres, D. J. (2011). Combined effect of YORP and collisions on the rotation rate of small Main Belt asteroids. Icarus, 214:622–631.
- Meech and Svoren, (2004) Meech, K. J. and Svoren, J. (2004). Using cometary activity to trace the physical and chemical evolution of cometary nuclei, pages 317–335. Festou, M. C., Keller, H. U., & Weaver, H. A.
- Moreno et al., (2011) Moreno, F., Lara, L. M., Licandro, J., Ortiz, J. L., de León, J., Alí-Lagoa, V., Agís-González, B., and Molina, A. (2011). The Dust Environment of Main-Belt Comet P/2010 R2 (La Sagra). ApJ, 738:L16.
- Moreno et al., (2012) Moreno, F., Licandro, J., and Cabrera-Lavers, A. (2012). A Short-duration Event as the Cause of Dust Ejection from Main-Belt Comet P/2012 F5 (Gibbs). ApJ, 761:L12.
- Pecaut and Mamajek, (2013) Pecaut, M. J. and Mamajek, E. E. (2013). Intrinsic Colors, Temperatures, and Bolometric Corrections of Pre-main-sequence Stars. ApJS, 208:9.
- Pravec et al., (2002) Pravec, P., Harris, A. W., and Michalowski, T. (2002). Asteroid Rotations. Asteroids III, pages 113–122.
- Prialnik and Rosenberg, (2009) Prialnik, D. and Rosenberg, E. D. (2009). Can ice survive in main-belt comets? Long-term evolution models of comet 133P/Elst-Pizarro. MNRAS, 399:L79–L83.
- Richardson et al., (2005) Richardson, D. C., Elankumaran, P., and Sanderson, R. E. (2005). Numerical experiments with rubble piles: equilibrium shapes and spins. Icarus, 173:349–361.
- Schorghofer, (2008) Schorghofer, N. (2008). The Lifetime of Ice on Main Belt Asteroids. ApJ, 682:697–705.
- Snodgrass, (2013) Snodgrass, C. (2013). Are Main Belt Comets driven by water ice sublimation? EPSC Abstracts, 8:EPSC2013–927.
- Snodgrass et al., (2008) Snodgrass, C., Saviane, I., Monaco, L., and Sinclaire, P. (2008). EFOSC2 Episode IV: A New Hope. The Messenger, 132:18–19.
- Snodgrass et al., (2010) Snodgrass, C., Tubiana, C., Vincent, J.-B., Sierks, H., Hviid, S., Moissi, R., Boehnhardt, H., Barbieri, C., Koschny, D., Lamy, P., Rickman, H., Rodrigo, R., Carry, B., Lowry, S. C., Laird, R. J. M., Weissman, P. R., Fitzsimmons, A., Marchi, S., and OSIRIS Team (2010). A collision in 2009 as the origin of the debris trail of asteroid P/2010A2. Nature, 467:814–816.
- Stevenson et al., (2012) Stevenson, R., Kramer, E. A., Bauer, J. M., Masiero, J. R., and Mainzer, A. K. (2012). Characterization of Active Main Belt Object P/2012 F5 (Gibbs): A Possible Impacted Asteroid. ApJ, 759:142.
- Taylor and Margot, (2013) Taylor, P. A. and Margot, J.-L. (2013). Tidal End States of Binary Asteroid Systems with a Nonspherical Component. ArXiv e-prints.
- Taylor et al., (2007) Taylor, P. A., Margot, J.-L., Vokrouhlický, D., Scheeres, D. J., Pravec, P., Lowry, S. C., Fitzsimmons, A., Nolan, M. C., Ostro, S. J., Benner, L. A. M., Giorgini, J. D., and Magri, C. (2007). Spin Rate of Asteroid (54509) 2000 PH5 Increasing Due to the YORP Effect. Science, 316:274–.
- Tody, (1986) Tody, D. (1986). The IRAF data reduction and analysis system. In “SPIE Instrumentation in Astronomy VI,” Ed. D. L. Crawford, volume 627, pages 733–748.
- Tsinganis et al., (2005) Tsinganis, K., Gomes, R., Morbidelli, A., and Levison, H. (2005). Origin of the Orbital Architecture of the Giant Planets of the Solar System. Nature, 435:459–61.
- Walsh et al., (2011) Walsh, K., Morbidelli, A., Raymond, S., O’Brien, D. P., and Mandell, A. M. (2011). A Low Mass for Mars From Jupiter’s Early Gas-Driven Migration. Nature, 475:206–209.