HerMES: Spectral Energy Distributions of Submillimeter Galaxies at 4††thanks: Herschel is an ESA space observatory with science instruments provided by European-led Principal Investigator consortia and with important participation from NASA
Abstract
We present a study of the infrared properties for a sample of seven spectroscopically confirmed submillimeter galaxies at 4.0. By combining ground-based near-infrared, Spitzer IRAC and MIPS, Herschel SPIRE, and ground-based submillimeter/millimeter photometry, we construct their Spectral Energy Distributions (SED) and a composite model to fit the SEDs. The model includes a stellar emission component at 3.5m; a hot dust component peaking at 5m; and cold dust component which becomes significant for 50m. Six objects in the sample are detected at 250 and 350m. The dust temperatures for the sources in this sample are in the range of 4080 K, and their 1013 L⊙ qualifies them as HyperLuminous Infrared Galaxies (HyperLIRGs). The mean FIR-radio index for this sample is around indicating no radio excess in their radio emission. Most sources in the sample have 24m detections corresponding to a rest-frame 4.5m luminosity of Log10(L4.5/L⊙) = 11 11.5. Their L4.5/ ratios are very similar to those of starburst dominated submillimeter galaxies at 2. The relation for this sample is consistent with that determined for local ULIRGs and SMGs at 2. We conclude that submillimeter galaxies at 4 are hotter and more luminous in the FIR, but otherwise very similar to those at 2. None of these sources show any sign of the strong QSO phase being triggered.
1 Introduction
Submillimeter observations provide a very effective way of detecting luminous galaxies at high redshifts. The well-known negative Kcorrection for galaxies in the FIR and submillimeter bands compensates the distance effect, making submillimeter observations equally sensitive to infrared luminous galaxies in a very wide redshift range of 2 10 (Blain et al., 2002). Most SubMillimeter Galaxies (SMGs) are known to be Ultra-Luminous InfraRed Galaxies (ULIRGs, 1012 L⊙ 1013 L⊙) or Hyper-luminous Infrared Galaxies (HyperLIRGs, 1013 L⊙), implying very intense star forming activity with SFR 100 M⊙/yr. Theoretical studies (Chakrabarti et al., 2008; Narayanan et al., 2010) suggested that galaxy-galaxy major mergers can produce such an intensive star forming activity. The major-merger scenario for ULIRGs predicts that a massive black-hole is also formed during merging. A ULIRG will eventually turn into a classical QSO after feedback from the central massive black hole repels most of its gas in the system and quenches star formation. A large spectroscopic survey for SMGs with radio detection obtained the first SMG redshift sample at (e.g. Chapman et al. 2003). Reproducing number densities and FIR flux densities for this population has been a major challenge in the current theoretical CDM frame (Baugh et al., 2005; Swinbank et al., 2008). Swinbank et al. (2008) proposed to adopt a flat Initial Mass Function (IMF) for SMGs to match their redshift distribution and number counts.
Understanding the formation of higher redshift SMGs () is even more challenging. High-redshift SMGs appear to be more luminous, for example, SMG GN20, the brightest source at 850m in the GOODS North field, has a spectroscopic redshift of . All detected SMGs at have millimeter flux densities of 5-10Jy (Younger et al., 2007b). At this redshift the millimeter band samples the same rest-frame wavelength as the submillimeter band for SMGs at 2. These SMGs would then have = 10 20mJy if they were at 2. The probability to find such a halo at 4 is much lower that at 2. Yet more and more high-redshift SMGs have been identified through multi-wavelength photometry, permitting studies of their formation mechanism through their SEDs and other observed properties.
Observational identification of SMG counterparts at high redshifts has been very difficult. A definite breakthrough was made with submillimeter and millimeter interferometric observations. Iono et al. (2006), Younger et al. (2007b) and Wang et al. (2007) used the SubMillimeter Array (SMA) to detect radio-quiet millimeter sources in both GOODS-N and COSMOS fields with a 2″ angular resolution. The high resolution submillimeter observations of these sources permit identification of their optical and infrared counterparts. These sources are found to be Bband dropouts and have much fainter IRAC flux densities than 2 SMGs in Chapman et al. (2003), in agreement with these source being at 4. Wang et al. (2009) performed ultra-deep HST Hband observations of GN10, an SMG in the GOODS-North region, and yet did not detect any H-band counterpart. With such an extremely red color of H [3.6] 4.0, Wang et al. (2009) argued that GN10 must be at 4.
The SMGs in this study are all spectroscopically identified in 4 5.3. The first high redshift SMG, GN20, was identified at through observations of the CO[43] transition using the Plateau de Bure interferometer (Daddi et al., 2009b). A nearby radio source, GN20.2, was subsequently identified at through detection of the same CO transition. Finally, the extremely red SMG, GN10, was also found to be at through the CO[43] line (Daddi et al., 2009a). There was also substantial effort in performing deep optical spectroscopy for optically faint millimeter sources in the COSMOS field using the Keck telescopes by Capak et al. (2008, 2011); Smolcic et al. (2010), and obtained optical spectroscopic redshifts for Capak4.55, AzTEC1 and AzTEC3 at , 4.64 and 5.3, respectively. Subsequent millimeter spectroscopic observations detect of the CO[43] line from Capak4.55 (Schinnerer et al., 2008) and CO[21], CO[54], and CO[65] lines from AzTEC3 (Riechers et al., 2010), confirming their optical spectroscopic redshifts. There was no CO detection from AzTEC1 in the band inferred from its optical spectroscopic redshift (Smolcic et al., 2010). AzTEC1 shows only UV absorption lines in its optical spectrum. Additionally, AzTEC1 is a Bband dropout and has a very low radio-to-submillimeter flux density ratio, both of which are consistent with the source being at 4 (Younger et al., 2007b). Finally, another SMG, LESS J033229.4-275619, in the GOODS-S field was identified at with both optical spectroscopy and millimeter CO[2-1] line followup observations(Coppin et al., 2009).
Before the advent of the Herschel Space Observatory (hereafter Herschel), our knowledge of the shape of the FIR SED from these galaxies was only based on the available submillimeter and millimeter bands (m). Additional FIR photometry at shorter wavelengths is required together with submillimeter and millimeter photometry for the measurement of important physical parameters, such as dust temperature, dust mass and FIR luminosities. It is, however, extremely difficult to perform 350 or 450m observations from ground-based submillimeter telescopes. Kovacs et al. (2006) carried out 350m observations for a small sample of SMGs at 1 3 and obtained a mean dust temperature of 34 K and a mean radio-to-FIR ratio of . They concluded that SMGs in their sample are star-burst dominated ULIRGs with no significant AGN contributions.
Herschel carries out effective observations in the FIR bands up to 500m. The Spectral and Photometric Imaging REceiver(Griffin et al., 2010, SPIRE) on board Herschel (Pilbratt et al., 2010) can perform imaging and spectroscopy in 250-500m bands, which probes the peak of galaxy FIR SED at 3. This is the first time that we are able to carry out surveys at 250, 350 and 500m. A large number of FIR selected galaxies have been obtained through the Herschel Multi-tiered Extragalactic Survey (HerMES, Oliver et al. 2012, 2010111hermes.sussex.ac.uk). Magdis et al. (2010) showed that SPIRE can easily detect ULIRGs at 2. At these redshifts galaxies with faint MIPS 24m emission are subject to the effects of confusion and require very careful work in extracting photometry from the Herschel SPIRE images (Rigopoulou et al., 2010). Magnelli et al. (2012) performed a FIR study for a large sample of 61 SMGs in a wide redshift range. These studies confirm that Herschel SPIRE is very sensitive in detecting galaxies at higher redshifts.
In this paper, we present a multi-wavelength study of SEDs for a sample of SMGs at in the HerMES fields with available full optical and IR SEDs and high resolution interferometric measurements which are used to refine the photometry and break the confusion. In §2, we describe the procedure used to measure flux densities for the 4 sources from the Herschel 250, 350, and 500m images for the SMG sample. We present SEDs and derive FIR physical parameters for the sample in §3 and conclusions in §4. We adopt a standard cosmological geometry of h = 0.7, = 0.3, and = 0.7 throughout this paper.
2 Spitzer and Herschel Observations of High Redshift SMGs
2.1 Spitzer Deep Imaging of High Redshift SMGs
Most studies of high redshift SMGs (Younger et al., 2007b) relied on their mid- infrared (mid-IR) SEDs to determine their properties and photometric redshifts. Several groups (Huang et al., 2004; Farrah et al., 2008; Huang et al., 2009; Desai et al., 2009) successfully used the 4 IRAC bands to identify ULIRGs, so-called ”bumpers”, at 2 based on the 1.6m bump shifting in either the 4.5 or 5.8m band. At 4, the 1.6m bump shifts beyond the 8m band. Similarly, we can use 5.8, 8.0, and 16m photometry to classify SEDs for SMGs at 4.
The present sample consists of 7 SMGs at 4 located in the GOODS-N, GOODS-S, and COSMOS fields. There are ultra-deep IRAC, IRS-peakup 16m, and MIPS 24m images in the GOODS-N and GOODS-S fields. In addition to the existing deep IRAC imaging in both GOODS fields, the Spitzer Extended Deep Survey (SEDS) carried out in the Spitzer post-cryo mission, covers the GOODS fields at 3.6 and 4.5m with exposure time of 12 hours per pointing. Ashby et al. (2012) combined all IRAC data available in the GOODS-N field including GOODS, SEDS, Spitzer GTO0008, and GO20218 programs to achieve better sensitivity and more accurate photometry. Teplitz et al. (2006) performed a deep 16m imaging in the GOODS-N and GOODS-S field reaching down to a 3 limiting flux density of 50Jy. The MIPS 24m image for the GOODS-N includes data from both GOODS and FIDEL with a total exposure time per position of 10 hours and reaching down to a 3 limiting flux density of 30Jy. The Spitzer-COSMOS project (Sanders et al., 2007, SCOSMOS) includes both IRAC and MIPS images (Sanders et al., 2007), but these are too shallow to detect the IR counterparts of the sources in this sample. Subsequently, we were awarded a total of 37.4 hours with a Spitzer GO program (ID:40801) to carry out deep mid-IR imaging for 4 sources in the COSMOS field. The exposure times for each object are 4.5 hours in the 4 IRAC bands, 3.2 hours in the IRS peakup 16m band, and 3.8 hours in the MIPS 24m band.
All objects in our sample have been detected in submillimeter or radio interferometric observations: five were detected by SMA (Iono et al., 2006; Younger et al., 2007b; Wang et al., 2009); while the remaining two objects are also detected at 1.4 GHz. Their accurate positions in submillimeter or radio bands (Table 1) permit identification of their counterparts in shorter wavelength bands. All objects are detected at IRAC 3.68m and MIPS 24m bands. Although, 16m observations are critical in differentiating between AGN and starburst SEDs for galaxies at 4, only one object, AzTEC1, has a firm 16m detection. The 16m limiting flux densities were used to constrain SEDs for the remaining objects. Finally, deep NIR images are also available in the COSMOS and GOODS-N fields (McCracken et al., 2010; Wang et al., 2009). All objects in our sample are detected in the NIR bands except GN10, which is not detected in the deepest available H-band image in the GOODS-N field (Wang et al., 2009). The near-IR and mid-IR photometry data for all objects in the sample are shown in Table 2.
2.2 Herschel SPIRE Photometry of High Redshift SMGs
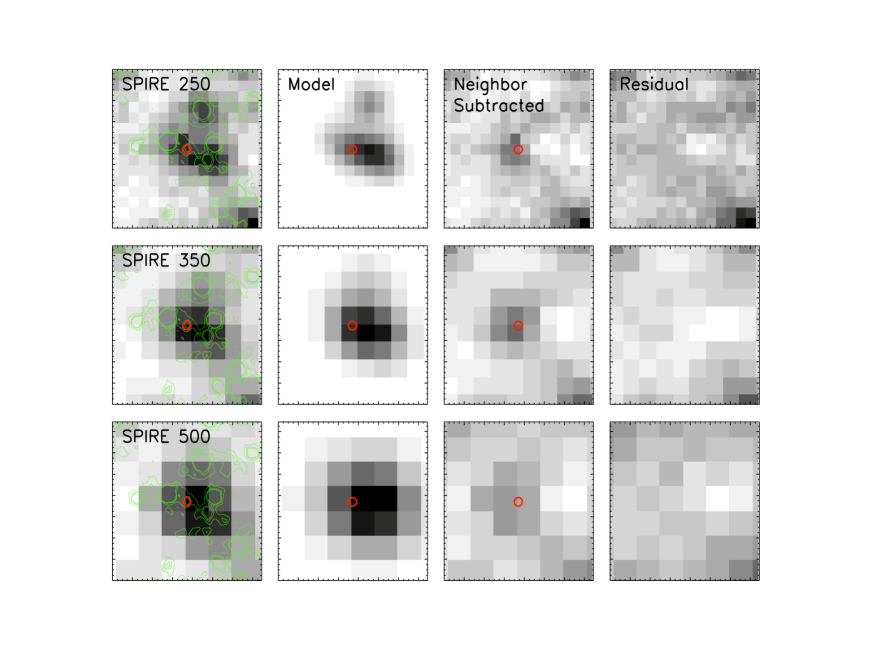
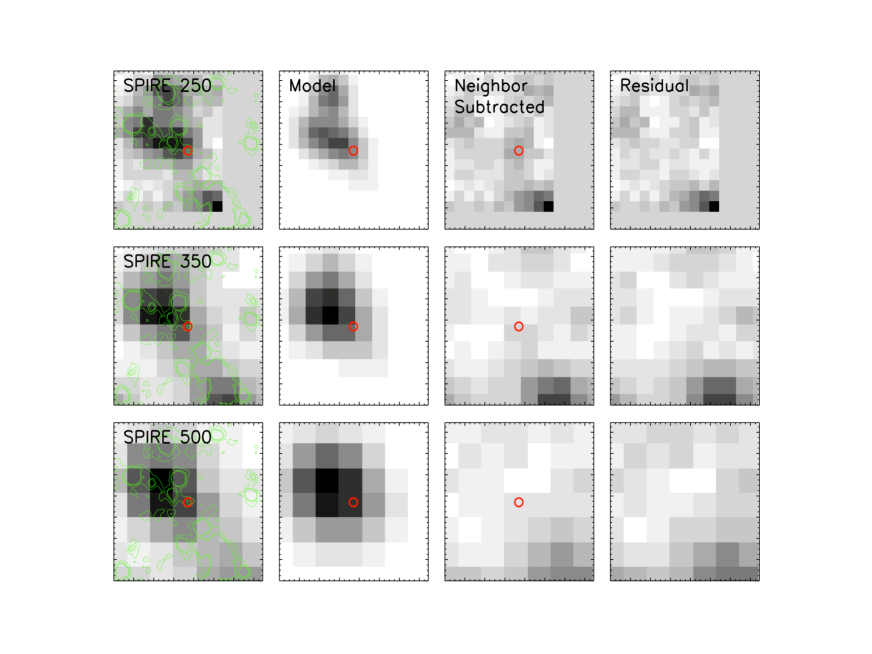
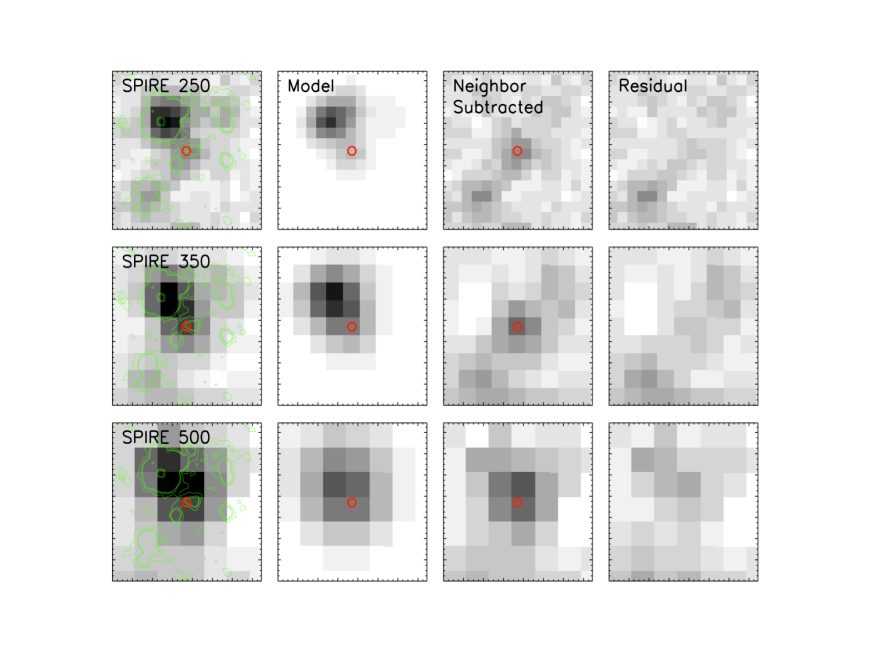
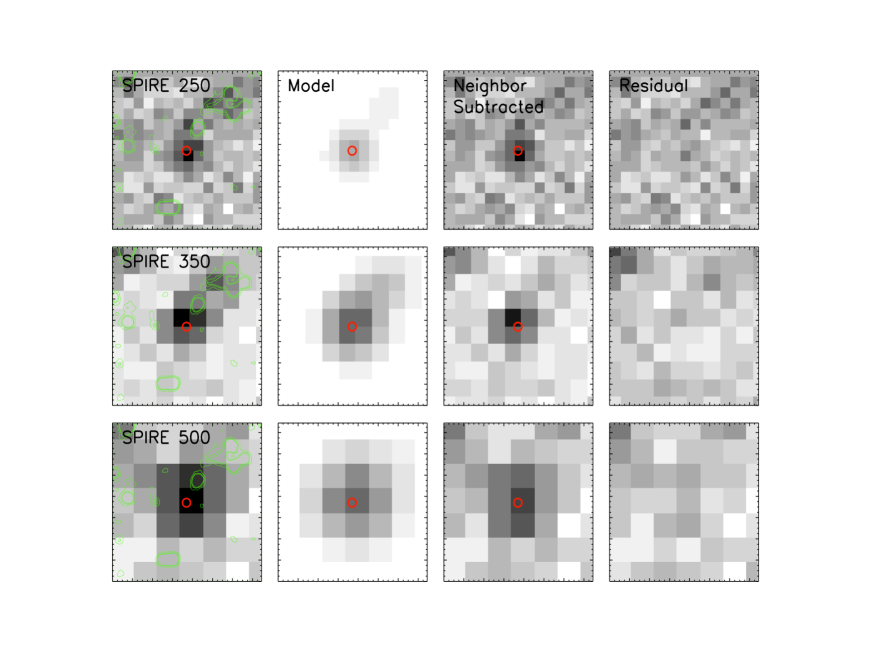
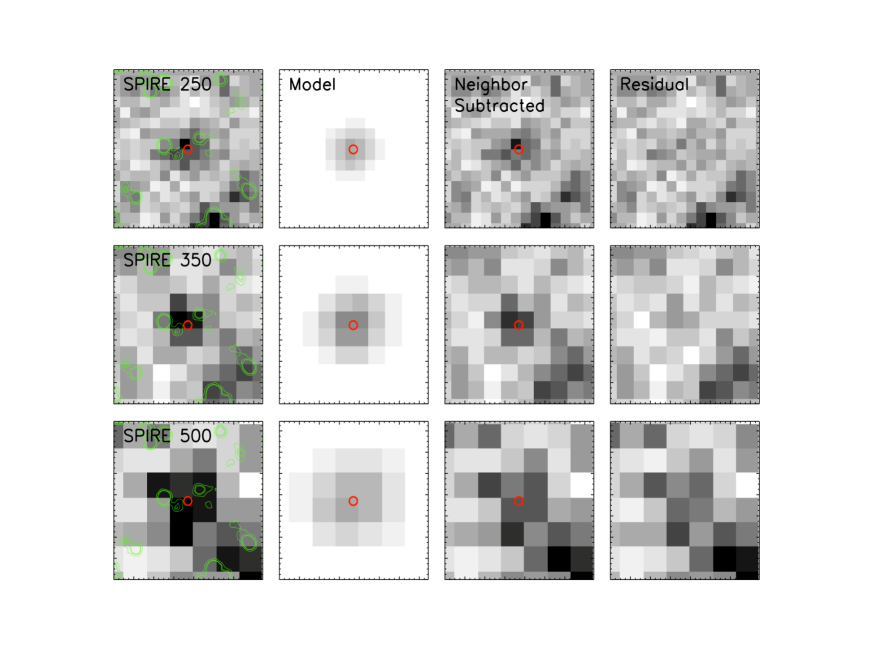
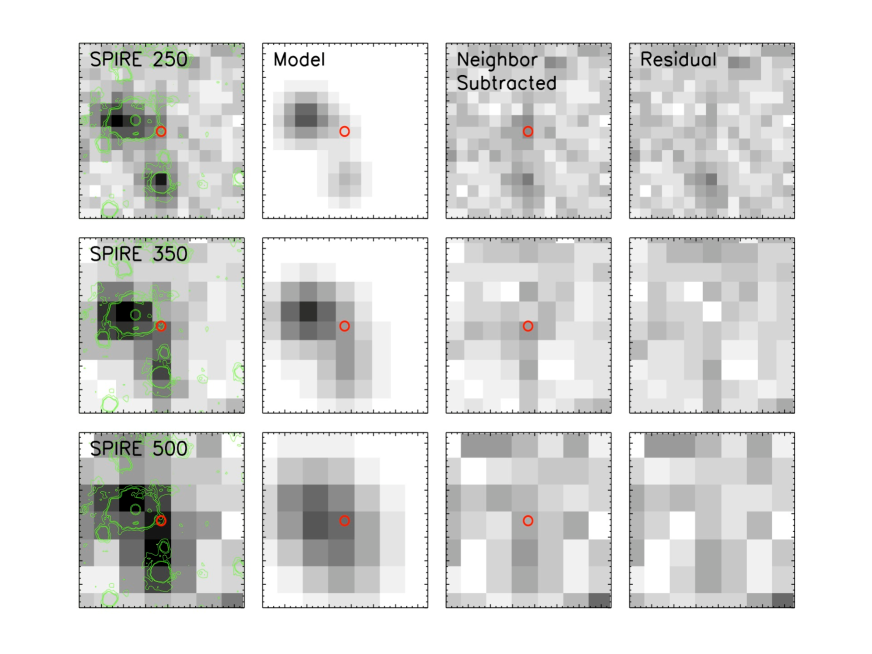
The SPIRE imaging for GOODS-N, GOODS-S and COSMOS are amongst the deepest observations in HerMES. The 1 confusion level is 6mJy for all three SPIRE bands, and the confusion limit is 10, 12, and 20mJy at 250, 350 and 500m (Nguyen et al., 2010). First we performed a visual inspection of the SPIRE images. Six SMGs appear to be detected by SPIRE, while no detection is found for LESS J033229.4-275619 in the ECDFS. The SPIRE stamp images are shown in Figures 1-6. Subsequent analysis to break the confusion and extract accurate flux densities for each source is thus necessary.
Blind source extraction results in single-band catalogs (Smith et al., 2010) but is not sensitive to very faint sources. Prior-based catalogs (Roseboom et al., 2010) use MIPS 24m source positions to guide the SPIRE photometry. The HerMES team has adopted this method to produce multi-wavelength catalogs, the so-called XID catalogs (Roseboom et al., 2010). Depth and photometric accuracy for the XID catalogs critically depends on depth of the input MIPS 24m catalogs (Roseboom et al., 2010). Several studies of high redshift SMGs use SPIRE photometry based on the HerMES XID catalogs (Magdis et al., 2011, 2012; Magnelli et al., 2012). We argue that the existing HerMES XID catalogs in the COSMOS and GOODS-N fields are, however, not optimized for our sample. First, the MIPS 24m catalog used for the XID catalog in the GOODS-N field is much deeper than that used in the COSMOS field, which is likely to cause systematic differences in the SPIRE photometry for the sources in each fields. Second, some SMGs have either very weak or absent MIPS 24m detections, therefore they are not included in the XID catalogs. For example AzTEC1 and AzTEC3 are not detected at 24m in SCOMOS(Sanders et al., 2007), however, the submillimeter/millimeter observations can be used to guide source identification in the Herschel SPIRE bands for these sources. We took advantage of our own ultra-deep MIPS 24m images for the sources in the COSMOS field and the FIDELS MIPS 24m image in the GOODS-N field, and developed a very similar source extraction and photometry method to the one described in Roseboom et al. (2010), but using submillimeter positions as priors for the sources of interest ( 4 SMGs) and MIPS 24m positions for their neighbouring sources. Our method proceeds as follows: We first model the Herschel flux distribution for each SMG and its unresolved neighboring objects in each stamp image. We use the SPIRE Point-Spread-Function (PSF) to re-construct the flux distribution in each stamp image with the SMA or radio position for each SMG and MIPS 24m positions for the neighboring objects. We fit the model image to each observed stamp image with the flux density of each model object as free input parameter. The flux density for each object is then found from the best fits. Figure 1-6 show the source extraction process for each object in the present sample. Our method yields very similar photometry for GN20 as that in Magdis et al. (2011) and in Roseboom et al. (2012). Yet our 500m flux density for GN20 is lower than in Magdis et al. (2011). Roseboom et al. (2010) found that the XID catalogs may under-estimate 500m photometry for high-redshift sources by assigning their flux densities to their neighbors. Our photometry in 500m band may suffer the same problem, such a bias becomes worse when there are a number of neighboring sources in deep MIPS 24m images.
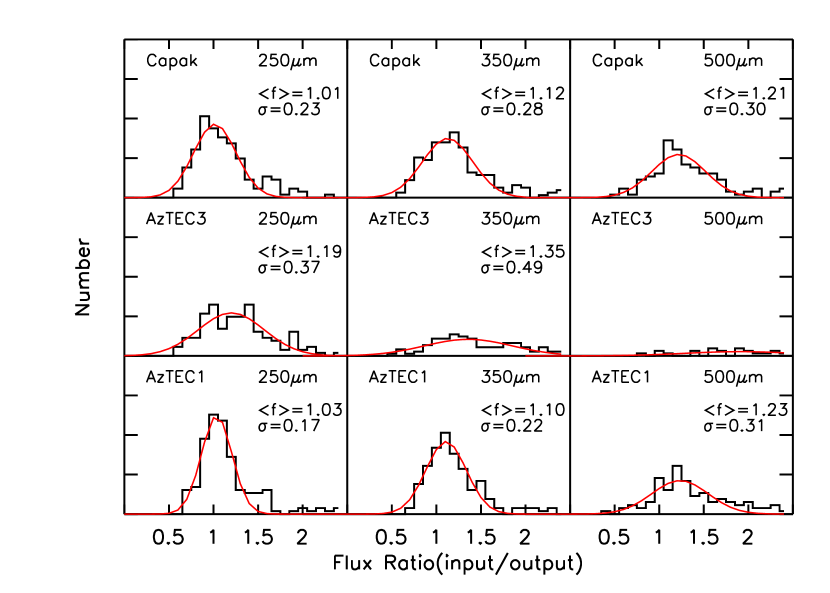
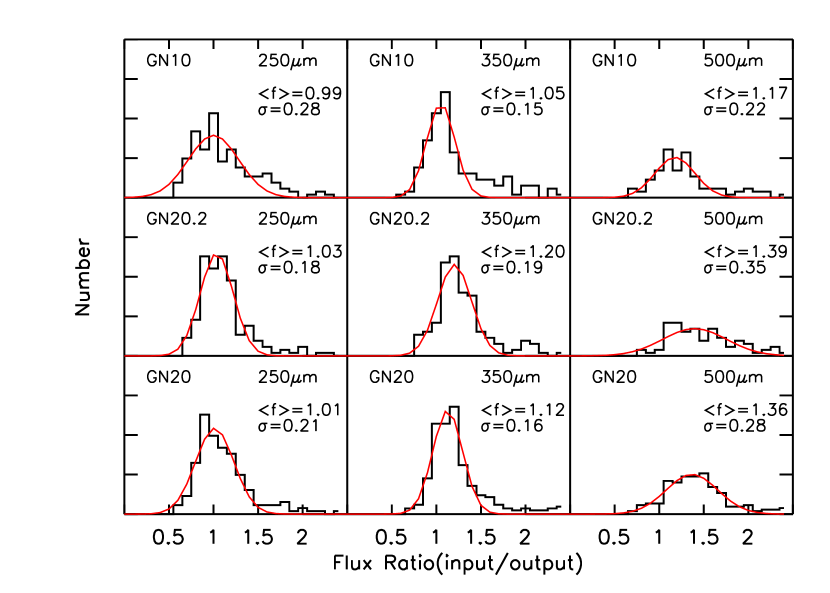
We asses the reliability of our SPIRE photometry through Monte-Carlo simulations. The photometry derived for each target is critically dependent on its neighbor object distribution. Because our fitting is based on well-determined SMA or MIPS 24m positions, source positions are fixed in the simulation. We only randomized the flux densities and background counts according to their measured standard deviation. A total of 1000 simulated stamp images were created for each target in each SPIRE band. We then run our photometry software on each of them and compare the measured flux densities with the input ones. In Figure 7, we show the histogram of flux ratio between input and measured flux density in the simulation for all six objects at 250, 350 and 500m. The mean flux ratio of / indicates a possible bias of our actual photometry. This simulation shows that the distribution of / for the 250m photometry is gaussian centered around unity, suggesting that the 250m photometry for most sources is very robust. The 350m histogram also shows a gaussian shape centering around unity, but with a few measurements much lower than input flux densities. We argue that the 350m photometry is reasonably reliable except for AzTEC3. We do not apply the bias measured in the / to the 250 and 350m photometry for the sources in the sample, because this bias is smaller than its standard deviation for most sources. The / ratios for the simulated 500m photometry show a much wide distribution. A lot of measured flux densities are much lower than the input ones in the simulation, and their ratios are much larger and beyond the range in Figure 7. This means that our 500m photometry may be well underestimated. Thus the measured 500m flux densities are not reliable and will not be used in the following analysis.
3 SEDs and FIR Properties for the SMGs at 4
3.1 Mid-IR SEDs
The rest-frame near-Infrared (near-IR) SEDs can be used to infer the energy source that powers infrared galaxies. In ULIRGs and HyperLIRGs both stellar light and AGN-heated dust light can contribute to the rest-frame NIR band. Several groups (Houck et al., 2005; Yan et al., 2007; Dey et al., 2008; Huang et al., 2009) used IRAC photometry to classify SEDs for ULIRGs and HyperLIRGs at 2. There are two types of SEDs for these IR galaxies: those dominated by stellar emission with the 1.6m bump shifting into the IRAC bands, known as “bumpers” (Farrah et al., 2008; Huang et al., 2009); and those having strong power-law dust emission in near-IR/mid-IR and subject to severe dust extinction in the optical band, known as Dust Obscured Galaxies (Houck et al., 2005; Yan et al., 2007; Dey et al., 2008, DOGS). Spitzer IRS spectroscopic studies show different spectra in the rest 6m 20m for bumpers and DOGs: bumpers have strong PAH emissions at 6.2, 7.7, 8.6 and 11.3m; DOGs have power-law continuum with no PAH emission features but strong silicate absorption at 9.6m. The mid-IR spectroscopy of SMGs at 2 (Lutz et al., 2005; valiante et al., 2007; Pope et al., 2008; Men ndez-Delmestre et al., 2009) also shows strong PAH emission features in their mid-IR spectra.
At 4 the strong PAH features at 7.7, 8.6 and 11.3m shift out of the IRS effective wavelength coverage, while the PAH features at 3.3 and 6.2m are too faint to be detected (see however Riechers et al. 2013 for a detection of weak PAH emission in GN20). We have to use the shape of the rest-frame near-IR SEDs to investigate the energy sources for SMGs at 4. SEDs of SMGs in the present sample show a power-law shape in the IRAC bands with [3.6] [8.0] 1.2 (Figure 8 and 9). Yet this does not means that they are pow-lawer objects, since the 1.6m feature shifts beyond the observed 8m band at z4. We need photometry at 16 and 24m to classify SED of the SMGs in this sample. “Bumpers” at z4 should have / 1. On the other hand, galaxies with power-law SEDs always have / 1. All sources in our sample are detected at 8m, yet only one object, AzTEC1, was detected at 16m. The 16m limiting flux densities are used to constrain SEDs for the remaining SMGs.
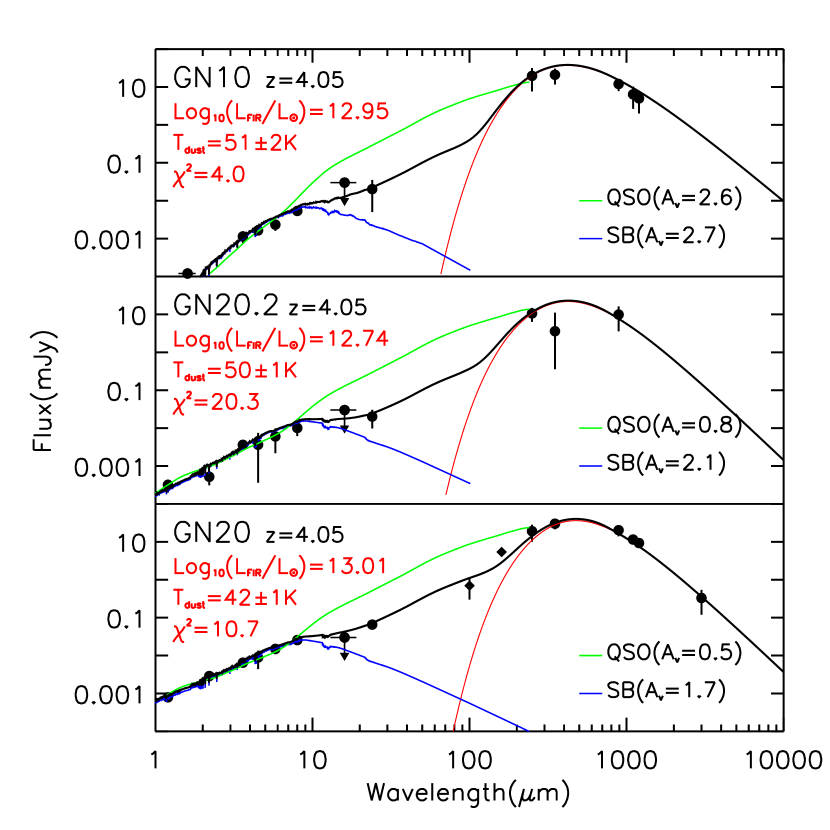
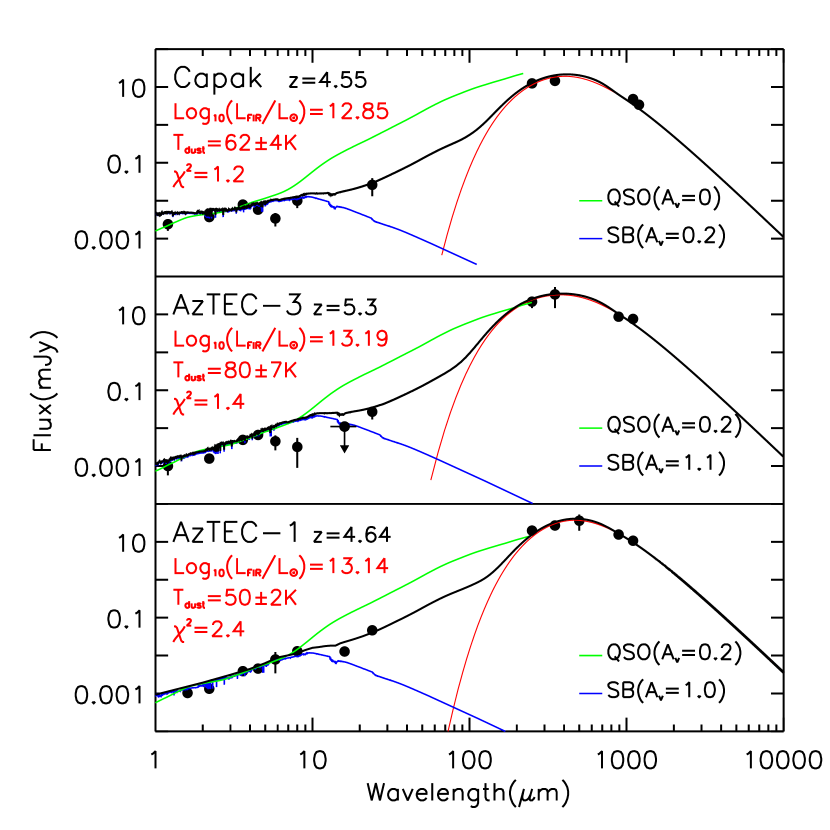
The two types of templates, dusty QSO and dusty Star-Burst(SB), can fit the rest-frame optical-near-IR SEDs of the sample equally well (Figure 8-9). The dusty starburst template with a 25Myr old young stellar population in the BC03 model (Bruzual & Charlot, 2003) and dust extinction in range of 0.2 A 2.0 can fit all objects except GN10. GN10 is extremely red and not detected in the deep HST H-band imaging with H [3.6] 4.5 (Wang et al., 2009; Huang et al., 2011), corresponding to A 8 if we use the same 25Myr old young stellar population. But this extreme dusty model also predicts much redder [3.6] [8.0] color than what is actually observed. Huang et al. (2011) found 4 additional objects with H [3.6] 4.5 in the GOODS-S field and suggested that both dust extinction and presence of an old stellar population component could be responsible for such an extreme color. We fit the SED of GN10 with an 1Gyr constant star formation template and AV = 2.7. The star-forming template fits these SEDs in the 1m 16m reasonably well (Figure 8-9) and their predicted 16m flux densities are consistent with the upper limits for this sample. The QSO template (Elvis et al., 1994) with a small amount of dust extinction can also fit the 1m 8m SEDs for AzTEC1, GN20 and GN20.2, but predicts slightly higher flux densities at 8m for AzTEC3, Capak4.55 and GN10.
Neither the dusty QSO or the SB templates can explain the MIPS 24m emission from these objects. All objects in the sample are detected at MIPS 24m with flux densities much higher than predictions based on the star-forming template, thus indicating the presence of hot dust emission. The dusty QSO template, however, predicts a much higher 24m flux density. On the other hand, it is very challenge to constrain the host dust emission with only 24m photometry. (Blain et al., 2003) suggested a composite model with a modified blackbody in FIR bands and a power-law component in MIR bands to fit SEDs of IR galaxies. Serval groups (Kovacs et al., 2010; Casey et al., 2012; Dai et al., 2012) used this model to yield a good fitting to MIR-to-FIR SEDs of SMGs and Herschel sources at high redshifts. We develop a similar model for the SMGs in our sample. Our full-wavelength-range SED models for this sample includes three components in the infrared SEDs of these SMGs: stellar emission at rest 3m; a power-law component at rest 5m; and cold dust emission at rest 50m. Our SED model suggests that these objects are all significantly reddened in the optical bands, with values ranging from 0.25 to 3.0. We do not include any PAH emission or silicate absorption features in our SED model, because there is no available photometry for our sample in the rest 6m 20m to constrain these features. The MIPS 24m is the only photometry at rest 5m, to which we simply normalize the the power-law template. We discuss modeling the FIR SEDs with this power-law model and the grey-body planck function in next section.
3.2 Dust Temperature Estimates for the SMGs at 4
The FIR and Submm/mm photometry available for the present sample allow us to measure their dust emission properties. We fit their FIR SEDs with a grey-body Planck function
| (1) |
and
| (2) |
where Bp is the blackbody Planck function, is dust temperature and typically = 125m. The parameter has a typical value in 1 2. For most SMGs in previous studies(Kovacs et al., 2006; Yang et al., 2007), Eq.1 can be simplified as following
| (3) |
if their 1 in Eq.1.
A more realistic model should include multi-dust temperature systems in these SMGs. Given only a small number of photometry points available for each object in the sample, it is a fair approximation to use of a single temperature to fit their FIR SEDs. The single temperature model yields temperatures from the coldest gas in these systems. Alternatively, Blain et al. (2003) proposed a composite model to fit a possible multi-temperature system with a single temperature component in long wavelength bands and a power-law component in short wavelength bands. We derived the dust temperatures for our sample using the model of Blain et al. (2003) with the fixed power-law index and unfixed index in both optical thin and thick cases(Table 3). The dust temperatures derived with the optical thick assumption are higher than those with the optical thin assumption. The fitting with unfixed power-law index yields a much large temperature difference between the optical thick and thin cases. We have only one photometry at 24 micron, thus are unable to constrain the power-law SEDs at the short wavelength. In this study, we adopt the model with the fixed power-law index.
The assumption on the FIR optical depth clearly yields difference in resulting dust temperatures. Several studies confirm this difference due to the different optical depth assumptions(Conley et al., 2011; Magdis et al., 2011, 2012). Recently Conley et al. (2011) studied a lensed submm galaxies at z3 with all MIPS(24, 70, 160m), SPIRE(250, 350, 500m), submm, 1-3 mm detections, permitting a better constrain on its dust temperature. They found that the optical thick model provides a better fit to its FIR SED. GN20 in our sample have 8 photometry measurement in FIR arranging from 100 to 3mm, providing a better constrain on the optical depth in the grey-body Planck function model.
We fit the grey-body function to the SED of GN20 with both , and as free parameters. The best fit yields = 1.9, = 42.5 K and = 101m. Figure 10 shows 4 slices of possibility contours as a function of and with = 60, 80, 101, 125m. The fit is robust in measuring against both and , thus permitting a comparison with other objects. Magdis et al. (2011) also fit the FIR SED of GN20 with a single temperature model, and obtain under the optically thin assumption and = 46.3 under the optically thick assumption. Our best fit yields = 101m, thus 1, confirming that the optically thick assumption is valid for GN20. There are only a few FIR/submm photometry data for the rest of objects which cannot constrain all parameters in the grey-body model. We argue that objects in our sample have similar FIR properties based on their similar f250/f850 ratio(Figure 12), thus adopt the single dust temperature model with = 2 and = 100m for all objects in the sample. The adopted dust temperatures and FIR luminosities with the optical thick assumption are reported in Table 4.
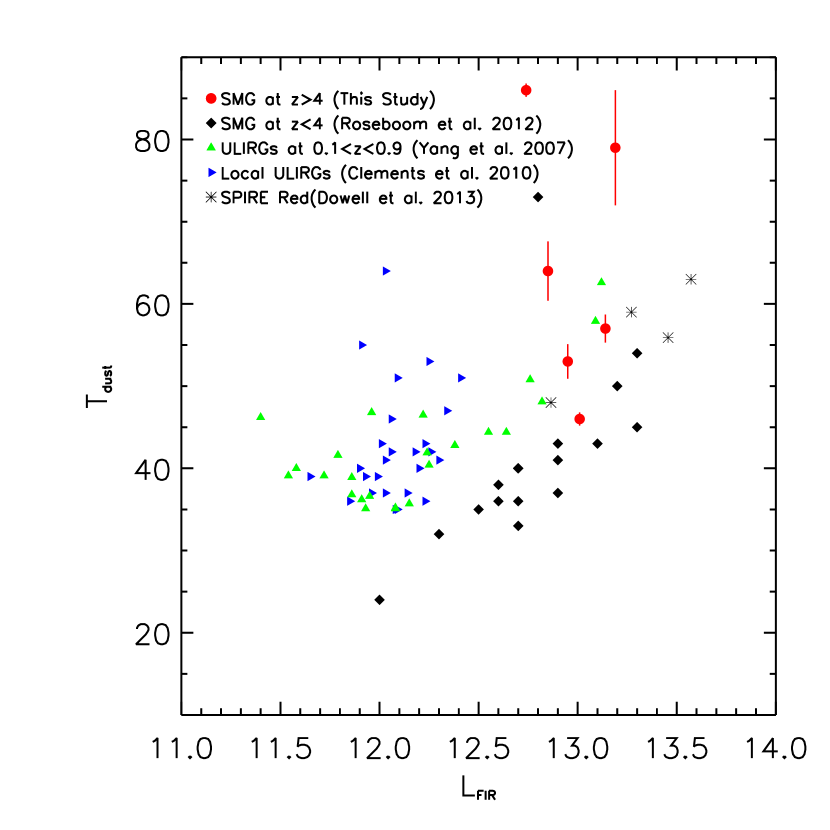
We compare our sample with local ULIRGs and SMGs at lower redshifts in Figure 11. The three populations clearly occupy different regions in the diagram. SMGs at 2 generally have lower dust temperature compared to those of local ULIRGs and SMGs at 4. Kovacs et al. (2006) proposed that there exists a relation for SMGs. The SMGs at 4 are at the high luminosity-high temperature end of the SMG distribution in Figure 11. Lower dust temperature for SMGs at 2 is likely due to a selection effect. At 2, the 850m band samples the rest-frame 280m, and thus, the sensitive to cold dust emission. In contrast, local ULIRGs selected based on IRAS 60m are biased towards systems with hotter dust temperatures. On the other hand, Magdis et al. (2010) measured dust temperatures for a MIPS 24m selected ULIRG sample at 1.9 (Huang et al., 2009), independent of any FIR selection. The dust temperatures for this 24m-selected sample showed no -bias, but cover a full range of 20 K 60 K. At , the 850m band samples the rest-frame wavelength shorter than 170m and, preferentially picks up SMGs with higher dust temperature than those at lower redshifts. The fact that 6 out of 7 SMGs in our sample are detected at 250m confirms that SMGs at z4 have higher dust temperatures due to the 850m selection at high redshifts. It may also be true that those SMGs at higher redshifts may have intrinsic higher dust temperatures. Recently Riechers et al. (2013b) and Dowell et al. (2013) found that Herschel SPIRE red sources in 3.8z6.34 also show to have high dust temperatures, consistent with our sample.
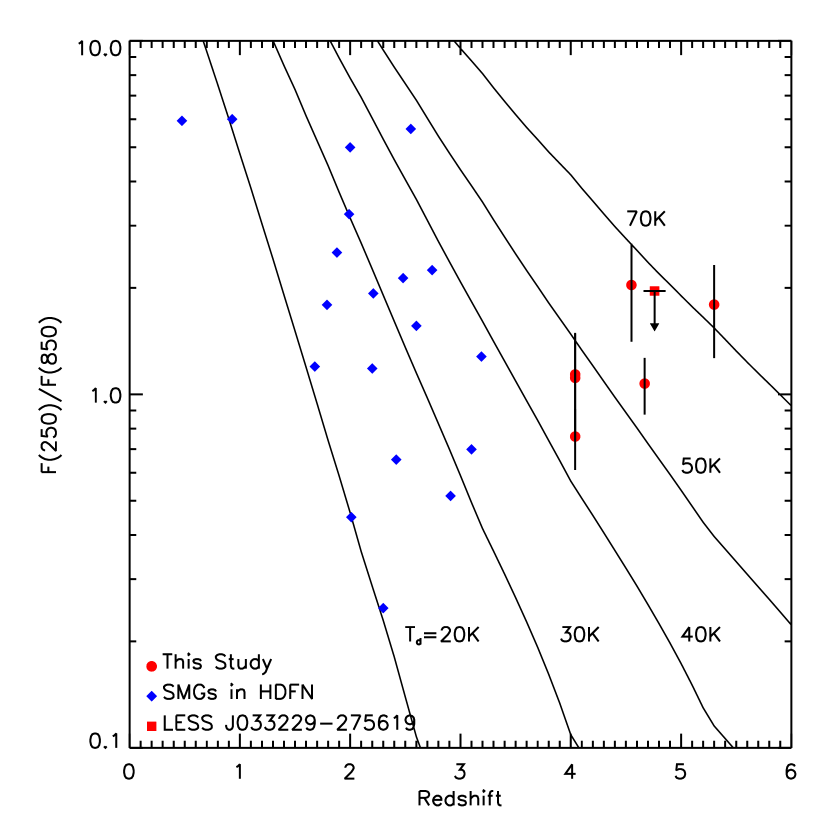
In Figure 12, we plot the 250-to-850m flux density ratio as a function of dust temperature and redshift based on the simple modified blackbody model described earlier. A typical SMG at 4 with a single 30 K and 8 mJy are too faint at 250m to be detected in HerMES. Only one SMG at , LESS J033229, is not detected at 250m. Its 850m flux density is only 5mJy, probably too low to have a strong constraint on the dust temperature with its /.
3.3 AGN Activity in the Sample
Local HyperLIRGs at 1 usually harbor an AGN. The SMGs in our sample have 1013 L⊙. Here we performed a multi-wavelength search for signs of AGN activity in these SMGs employing X-ray, mid-IR and radio observations.
X-ray observations offer a direct way of identifying an AGN. The X-ray imaging in the COSMOS field is too shallow to detect any AGN at high redshifts. X-ray imaging in GOODS-N is very deep with an exposure time of 2Ms, but only GN10 is detected (Laird et al., 2010) with = 1042.93 erg s-1, which corresponds to a star formation rate of 1700 M⊙ yr-1 or 1012.8 L⊙. Laird et al. (2010) argued that intensive star formation in GN10 accounts for both the X-rays and FIR luminosities. On the other hand, GN20 and GN20.2 with a similar as GN10, are not detected in the Chandra 2Ms imaging, and thus they have 1042.6 erg s-1. If the X-ray emission from GN10 were due to intensive star formation, we would expect a similar Lx from GN20 and GN20.2. Both Wang et al. (2009) and Huang et al. (2011) suggested that there is a significant number of old stars in GN10, indicating a late stage of merging. Thus, it is very likely that its central black accretion is switching-on in GN10, but not yet in GN20 and GN20.2. The X-ray luminosity for GN10 is much lower than 1044 erg s-1, suggesting that it has not yet entered in the QSO phase.
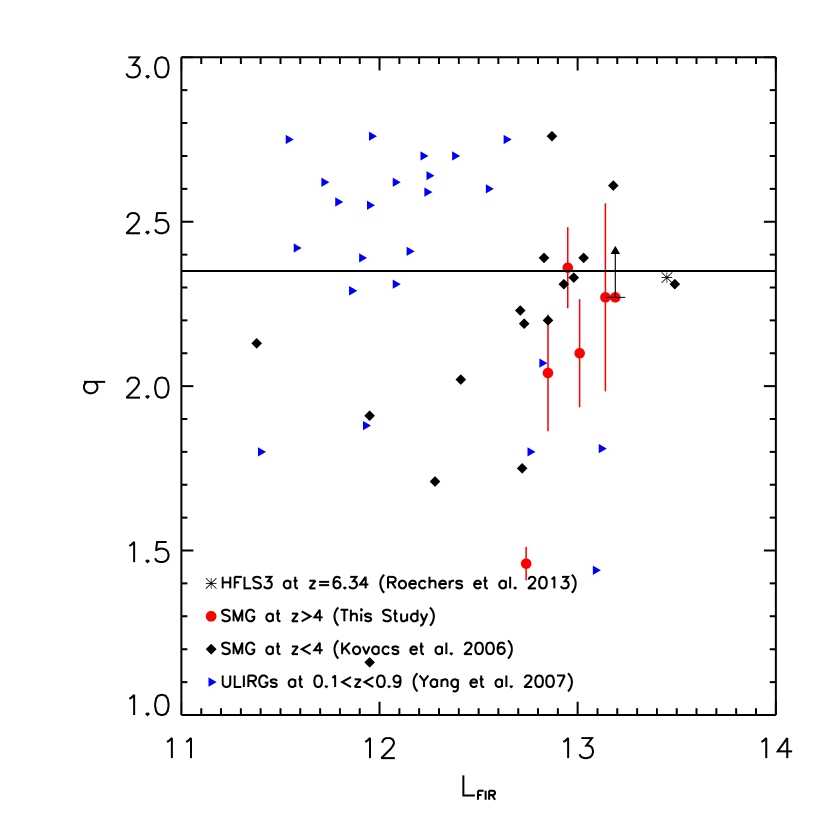
The radio emission can be also used to identify AGN in FIR selected galaxies. The radio emission powered by star formation is strongly correlated with FIR emission with radio-to-FIR flux density ratio around 222, Condon et al. (1982). For radio loud AGN, decreases significantly due to additional non-thermal radio emission contribution from their central black hole. Based on 350m photometry Kovacs et al. (2006) derived FIR luminosities for their SMG sample at 2 and a radio-to-FIR flux density ratio of = 2.14 0.07. We measured a value of 2.2 for all but GN20.2 SMGs in our sample. This value of is similar to that of SMGs at 2 (Figure 13). Recently Riechers et al. (2013b) found a HyperLIRG at z=6.34 with q=2.33, implying such a extreme star-burst system existing at very high redshifts without AGN signature. GN20.2 has a much lower value indicating a strong radio excess, in agreement with Daddi et al. (2009). All HyperLIRGs at 1 in Yang et al. (2007)’s sample have much lower . We conclude that the majority of the SMGs at 4 (except GN20.2), do not have significant non-thermal contribution in their radio emission, thus there is no evidence for the presence of an AGN.
All SMGs in our sample have an excess in addition to stellar photosphere emission in the rest-frame mid-IR bands (4m 5m). It is generally thought that the mid-IR excess emission originates from hot dust heated by an AGN. However, Spitzer IRAC imaging of local star forming regions in our galaxy (Allen et al., 2004) and local star-burst galaxies (Förster Schreiber et al., 2001; Engelbracht et al., 2006), also shows an excess in the continuum emission at 3.6, 4.5 and 5.8m. Huang et al. (2007) found that star forming galaxies with high 8m luminosities have ([3.6] [4.5]) 0 and the ([3.6] [4.5])vega colors are correlated with their 8m luminosities. This indicates that galaxies with high star formation rates may display strong continuum dust emission in the mid-IR bands. The objects in our sample have extremely high star formation rates, thus we need to quantify their and compare it with other types of objects to understand its origin.
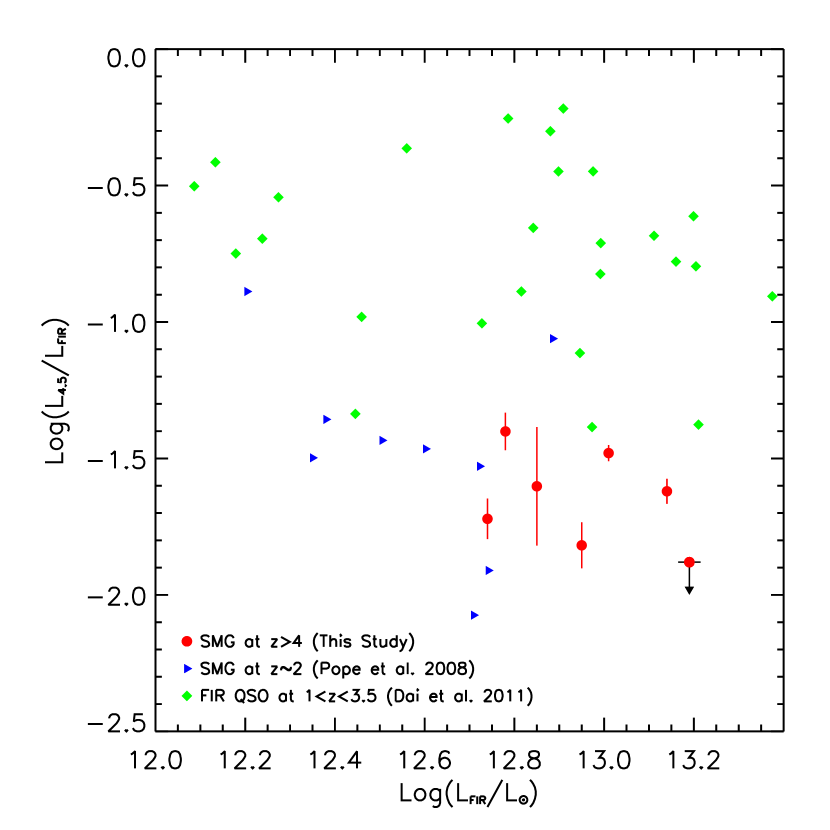
The 4.5m luminosity, , for the SMGs in this sample was calculated based on their observed MIPS 24m flux densities. The MIPS 24m roughly probes the rest 4.5m for the SMGs at 4, thus it is robust in calculating for this sample with their MIPS 24m flux densities. We also calculated L4.5 for QSOs and SMGs at 2 for comparison. Using MIPS 24m flux densities to calculate for SMGs at 2, which probes the rest-frame 8m emission, may introduce a large uncertainty. The IRS spectra of SMGs at 2 show many predominant features such as PAHs emission features at 6.2, 7.7 and 8.6m and the silicate absorption line (Pope et al., 2008; Men ndez-Delmestre et al., 2009). Variation of these features in their spectra may cause a large error for the MIPS 24m K-correction in calculating for SMGs at 2. Fortunately, IRS peak-up 16m images are available in the GOODS-N field, probing the rest-frame 4-5m band. SMGs at 2 in this field are all detected at 16m(Pope et al., 2008). Thus, their can be determined robustly with the measured 16m flux densities (Pope et al., 2008; Huang et al., 2009). The selected QSOs for comparison are in 1 3 and detected by Herschel at 250m, qualifying them to be HyperLIRGs (Hatziminaoglou et al., 2010; Dai et al., 2012). These QSOs have much higher MIPS 24m flux density and typically have power-law SEDs in the mid-IR bands. Their can be easily derived using their MIPS 24m flux densities(Dai et al., 2012). Figure 14 shows a comparison of the between SMGs in this sample with the SMGs at 2 and QSOs in Dai et al. (2012). The SMGs at 2 show very strong PAH emission, indicating a star-burst dominated ULIRGs. The FIR detected QSOs have much higher / than SMGs at both low and high redshifts. The SMGs at 4 have similar / as SMGs at 2. This comparison suggests that the 4.5m emission from SMGs at both low and high redshifts is produced by similar mechanisms, namely intense star formation, although we cannot rule out the AGN contribution with 100% confidence. We conclude that these SMGs with 1013 L⊙ are not in the QSO phase.
3.4 Cold Gas in SMGs at 4
SMGs experiencing intense star forming activity requires a vast cold gas reservoir. The cold gas is typically traced by molecular CO emission. All SMGs but AzTEC-1 have CO detections, indicating that they have cold gas of 2-5 1010 M⊙ (Schinnerer et al., 2008; Daddi et al., 2009a, b; Coppin et al., 2009; Riechers et al., 2010). Similar amount of cold gas is found in similar types of objects: 3 1010 M⊙ for SMGs at 2(Greve et al., 2005); 3.4 1010 M⊙ for QSOs at 2 (Coppin et al., 2008); 1.44 1010 M⊙ for QSO at 6 (Wang et al., 2011); and 1.4 1010 M⊙ for MIPS24 selected ULIRGs at 2 (Yan et al., 2010). With the measurement of dust temperature, we are also able to derive the dust mass in these galaxies, their dust masses are which are in the range of 1 109 M 6 109 M⊙ (Table 3). For the derivation of the dust masses we have adopted a dust mass absorption coefficient of cm2 g-1 (Li & Draine 2001). The dust-to-gas ratio for this sample is in the range of / 10. AzTEC-1 has a dust mass of 3.65 109 M⊙, implying that it has a reservoir of 4 1010 M⊙ cold gas.
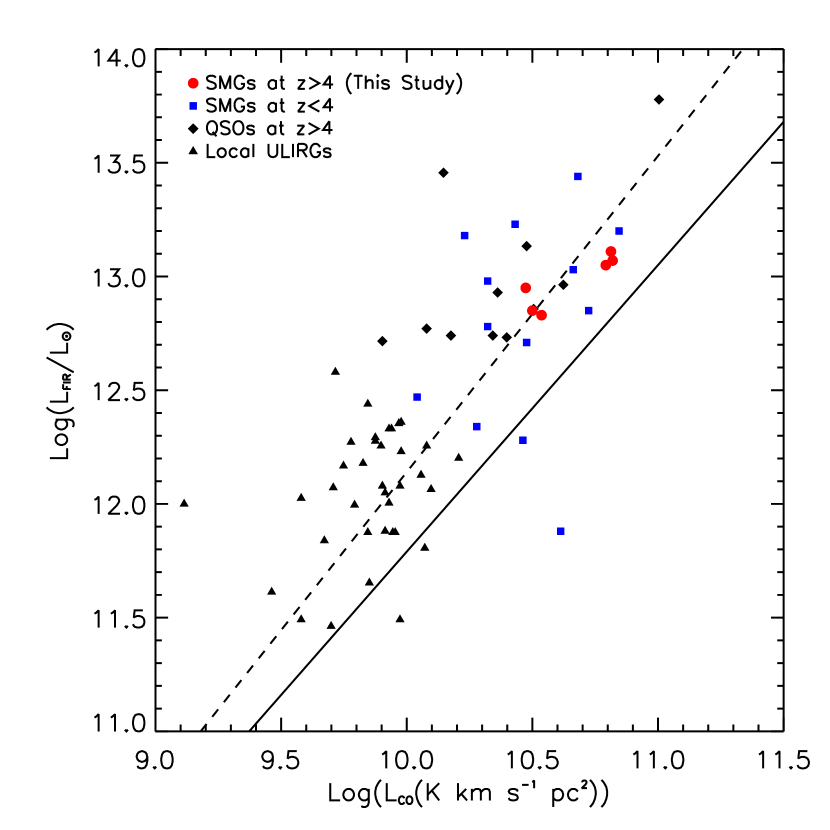
We study the relation for this sample with more accurate and compare it with other populations. We convert CO luminosities from different J-transitions to , assuming unity line ratio. While this assumption is not striclty correct, given the uncertainties linked with this conversion factor, it is a valid simplification in order to derive lower limits for . We stress that this assumption typically leads to a factor of underprediction of the (e.g., Riechers et al. 2011, Ivison et al. 2011, Carilli et al. 2010, Hodge et al. 2013). The SMGs at 4 are located in the same region in the diagram (Figure 15) as SMGs at 2, consistent with the relation determined by local ULIRGs and lower redshift SMGs (Downes & Solomon, 1998; Solomon & Vanden Bout, 2005; Daddi et al., 2010; Genzel et al., 2010). This indicates that the SMGs at 4 have similar star formation efficiency as those at 2.
4 Summary
We have performed the first multi-wavelength study of a sample of seven SMGs at 4.0. The mid-IR photometric data, including ultra-deep IRS peakup imaging and MIPS 24m imaging for a part of this sample, were obtained in the Spitzer cryogenic mission. The FIR photometry of this sample comes from the recent Herschel SPIRE survey (HerMES). Six objects in the sample are detected in the SPIRE 250 and 350m bands. We combine ground-based near-IR, Spitzer IRAC and MIPS, Herschel SPIRE and ground-based submillimeter and millimeter photometry and obtain SEDs for this sample in the full IR wavelength range. We are able to fit the rest optical-NIR SEDs of this sample with both dusty starburst and QSO templates. The dusty QSO templates underestimate the measured MIPS 24m flux densities for all objects in the sample. The deep 16m imaging place a strong constrain on the origin of the optical-NIR part of the SED. We find that stellar emission with little or no contribution from hot dust can explain the SED up to the observed 16m. The dust extinction values for this sample are in the range 0.2A3.0. We suggest a three-component composite model to fit the full SED of these objects: a stellar emission component at 16m; a hot dust emission at 24m; and a cold dust emission at 250m.
At 4, the 850m band selects SMGs with higher dust temperatures and higher FIR luminosities than those at z2. Our analysis shows that a typical SMG with 40 K will have too low a 250m flux density to be detected in the HerMES survey. A high percentage of SMGs at high redshifts are detected at 250m, suggesting their high dust temperatures. Fitting modified Planck functions to the FIR SEDs yield dust temperature of 40K-80K and of 1013 L⊙ for this sample.
We searched for the presence of AGN signatures in this sample but found rather weak evidence. Only GN10 is detected in X-ray with = 1042.93 erg s-1. GN20.2 has an excess radio emission with radio-to-FIR ratio of . All remaining objects have q 2.2, suggesting that their radio emission is powered by intense star formation. Almost all objects are detected at MIPS 24m, thus have rest-4.5m luminosities of 1011.5L⊙. The 4.5m luminosities of these objects are much lower than those of QSO. We suggest that these SMGs show absent or weak AGN features in X-ray, mid-IR and radio bands, but the QSO phase has not yet appeared in these SMGs. The relation for this sample is also consistent with that determined for local ULIRGs and starburst-dominated SMGs at 2. These submillimeter galaxies at 4 are hotter and more luminous in FIR, but otherwise very similar to those at 2. We conclude that, even though these SMGs are HyperLIRGs and may harbor weak AGNs, their QSO phase has yet to be triggered.
References
- Alexander et al. (2005) Alexander, D., et al. 2005, Nature, 434, 738
- Allen et al. (2004) Allen, L., et al. 2004, ApJS, 154, 363
- Ashby et al. (2012) Ashby, M., et al. 2012, in preparation.
- Baugh et al. (2005) Baugh, C. M., et al. 2005, MNRAS, 356, 1191
- Beelen et al. (2006) Beelen, A., et al. 2006, ApJ, 642,694
- Blain et al. (2002) Blain, A. W., Smail, I., Ivison, R. J., Kneib, J.-P., & Frayer, D. T. 2002, PhR, 369,111
- Blain et al. (2003) Blain, A. W., Barnard, V. E., Chapman, S. C. 2003, MNRAS, 338, 733
- Blain et al. (2004) Blain, A. W., et al. 2004, ApJ, 611, 725
- Borys et al. (2005) Borys, C., et al. 2005, ApJ, 635,853
- Bruzual & Charlot (2003) Bruzual, G. & Charlot, S. 2003, MNRAS, 344, 1000
- Capak et al. (2008) Capak, P. et al. 2008, ApJ, 681, L53
- Capak et al. (2011) Capak, P. et al. 2011, Nature, 470,233
- Carilli et al. (2010) Carilli, C. L., Daddi, E., Riechers, D., et al. 2010, ApJ, 714, 1407
- Casey et al. (2012) Casey, C. M., et al. 2012, ApJ, 761, 139
- Chakrabarti et al. (2008) Chakrabarti, S., et al. 2008, ApJ, 688, 972
- Chapman et al. (2003) Chapman, S. C., Blain, A. W., Ivison, R. J., & Smail, I. R. 2003, Nature, 422, 695
- Clements et al. (2010) Clements, D., Dunne, L., & Eales, S. 2010, MNRAS, 2010, 403,274
- Condon et al. (1982) Condon, J. J., et al. 1982, ApJ, 252, 102
- Conley et al. (2011) Conley, A. et al. 2011, ApJ, 732, 35
- Coppin et al. (2008) Coppin, K. E. K., et al. 2008, MNRAS, 389,45
- Coppin et al. (2009) Coppin, K. E. K., et al. 2009, MNRAS, 395,1905
- Coppin et al. (2010) Coppin, K. E. K., et al. 2010, MNRAS, 407, 103
- Daddi et al. (2009a) Daddi, E., Dannerbauer, H., Krips, M., Walter, F., Dickinson, M., Elbaz, D., & Morrison, G. E. 2009a, ApJ, 695, L176
- Daddi et al. (2009b) Daddi, E. et al. 2009b, ApJ, 694, 1517
- Daddi et al. (2010) Daddi, E. et al. 2010, ApJ, 714, L118
- Dai et al. (2012) Dai, Y., et al. 2012, ApJ,753,33.
- Dave et al. (2010) Dave, R., et al. 2010, MNRAS, 404,1355
- Desai et al. (2009) Desai, V., et al, 2009, ApJ, 700,1190
- Dey et al. (2008) Dey, A., et al, 2008, ApJ, 677, 943
- Dowell et al. (2013) Dowell, C. D., et al. 2013, arXiv:1310.7583
- Downes & Solomon (1998) Downes, D. & Solomon, P. M. 1998, ApJ, 507,615
- Dye et al. (2008) Dye, S., et al, 2008, MNRAS, 386 1107
- Efstathiou et al. (1995) Efstathiou A., Rowan-Robinson M., 1995, MNRAS 273, 649
- Efstathiou et al. (2000) Efstathiou A., Rowan-Robinson M., Siebenmorgen R., 2000, MNRAS 313, 734
- Efstathiou et al. (2003) Efstathiou A., Rowan-Robinson M., 2003, MNRAS 343, 322
- Elvis et al. (1994) Elvis, M., et al. 1994, ApJS, 95, 1
- Engelbracht et al. (2006) Engelbracht, C. W., et al. 2006, ApJ, 642, L127
- Farrah et al. (2008) Farrah, D., et al, 2008, ApJ, 677,957
- Förster Schreiber et al. (2001) Förster Schreiber, N. M., et al. 2001, ApJ, 552, 544
- Genzel et al. (2010) Genzel, R., et al. 2010, MNRAS, 407,2091
- Greve et al. (2005) Greve, T. R., et al. 2005, MNRAS, 359, 1165
- Griffin et al. (2010) Griffin, M.J., et al. 2010, A&A, 518, L3
- Guo & White (2008) Guo, Q., & White, S. D. M. 2008, MNRAS, 384, 2
- Haas et al. (2003) Haas, M., et al. 2003, A&A, 402,87
- Hatziminaoglou et al. (2010) Hatziminaoglou, E., et al. 2010, A&A, 518, L33
- Hodge et al. (2013) Hodge, J. A., Carilli,C. L., Walter, F., Daddi, E., & Riechers, D. 2013, ApJ, 776, 22
- Hopkins et al. (2009) Hopkins, P. F., Cox, T. J., Younger, J. D., & Hernquist, L. 2009, ApJ, 691, 1168
- Huang et al. (2004) Huang, J.-S., et al. 2004, ApJS, 154, 44
- Huang et al. (2005) Huang, J.-S., et al. 2005, ApJ, 634,137
- Huang et al. (2007) Huang, J.-S., et al. 2007, ApJ, 664,840
- Huang et al. (2009) Huang, J.-S., et al. 2009, ApJ, 700,183
- Huang et al. (2011) Huang, J.-S., et al. 2011, ApJ, 700,183
- Houck et al. (2005) Houck, J. et al. 2005, ApJ, 622, L105
- Iono et al. (2006) Iono, D., Peck, A. B., Pope, A., Borys, C., Scott, D., Wilner, D. J., Gurwell, M., Ho, P. T. P., Yun, M. S., Matsushita, S., Petitpas, G. R., Dunlop, J. S., Elvis, M., Blain, A., & Le Floc’h, E. 2006, ApJ, 640,1
- Ivison et al. (2011) Ivison, R. J., Papadopoulos, P. P., Smail, I., et al. 2011, MNRAS, 412, 1913
- Klaas et al. (2001) Klaas, U., et al. 2001, A&A, 379, 823
- Kovacs et al. (2006) Kovacs, A., et al. 2006, ApJ, 650,592
- Kovacs et al. (2010) Kovacs, A., et al. 2010, ApJ, 717, 29
- Laird et al. (2010) Laird, E. S., et al. 2010, MNRAS, 401, 2763
- Lisenfeld et al. (2000) Lisenfeld, U., et al. 2000, MNRAS, 312, 433
- Lutz et al. (2005) Lutz, D., et al. 2005, ApJ, 625, 83
- Magdis et al. (2010) Magdis, G., et al. 2010, MNRAS,409,22
- Magdis et al. (2011) Magdis, G., et al. 2011, ApJ,740,L15
- Magdis et al. (2012) Magdis, G. E., Daddi, E., Béthermin, M., et al. 2012, ApJ, 760, 6
- Magnelli et al. (2012) Magnelli, B., et al. 2012,A&A,539,155
- McCracken et al. (2010) McCracken, H. J., et al. 2010,ApJ,708, 202
- Men ndez-Delmestre et al. (2007) Men ndez-Delmestre, K., et al. 2007, ApJ, 655L,65
- Men ndez-Delmestre et al. (2009) Men ndez-Delmestre, K., et al. 2009, ApJ, 699,667
- Narayanan et al. (2009) Narayanan, D., et al. 2009, MNRAS, 400, 1919
- Narayanan et al. (2010) Narayanan, D., et al. 2010, MNRAS, 401, 1613
- Nguyen et al. (2010) Nguyen, H.T., et al. 2010, A&A,518, 5
- Oliver et al. (2010) Oliver, S., et al. 2010, A&A,518,21
- Oliver et al. (2012) Oliver, S. J., Bock, J., Altieri, B., et al. 2012, MNRAS, 424, 1614
- Pilbratt et al. (2010) Pilbratt, G. L., et al. 2010, A&A, 518,1
- Pope et al. (2008) Pope, A., et al. 2008, ApJ, 675,1171
- Riechers et al. (2010) Riechers, D. A. et al. 2010, ApJ, 720, L131
- Riechers et al. (2011) Riechers, D. A., Carilli, C. L., Maddalena, R. J., et al. 2011, ApJ, 739, L32
- Riechers et al. (2013a) Riechers, D. A., Pope, A., Daddi, E., et al. 2013, arXiv:1306.5235
- Riechers et al. (2013b) Riechers, D. A., Bradford, C. M., Clements, D. L., et al. 2013, Nature, 496 329
- Rigby et al. (2008) Rigby, J., et al. 2008, ApJ, 675,262
- Rigopoulou et al. (2010) Rigopoulou, D., et al. 2010,MNRAS, 409, 7
- Roseboom et al. (2010) Roseboom, I., et al. 2010, MNRAS, 409, 48
- Roseboom et al. (2012) Roseboom, I., et al. 2012, MNRAS, 419,2758
- Rowan-Robinson (1995) Rowan-Robinson M., 1995, MNRAS 272, 737
- Rowan-Robinson et al. (2008) Rowan-Robinson M. et al, 2008, MNRAS 386, 697
- Sanders et al. (2007) Sanders, D., et al. 2007, ApJS, 172,86
- Schinnerer et al. (2008) Schinnerer, E., et al. 2008, ApJ, 689, L5
- Shu et al. (2001) Shu, C., et al., 2001, MNRAS, 327,895
- Smith et al. (2010) Smith, A., et al., 2010, MNRASin press
- Smolcic et al. (2010) Smolcic, V., et al. 2011, ApJ, 731, L27
- Solomon & Vanden Bout (2005) Solomon, P. M. & Vanden Bout, P. A. 2005, ARA&A, 43,677
- Swinbank et al. (2006) Swinbank, A. M., et al. 2006, MNRAS, 371, 465
- Swinbank et al. (2008) Swinbank, A. M., et al. 2008, MNRAS, 391, 420
- Teplitz et al. (2006) Teplitz, H., et al. 2006, in BAAS, 38, 1079
- valiante et al. (2007) Valiante, E., Lutz, D., Sturm, E., Genzel, R., Tacconi, L. J., Lehnert, M. D., & Baker, A. J. 2007, ApJ, 660, 1060
- Wang et al. (2007) Wang, W.-H., Cowie, L. L., van Saders, J., Barger, A. J., & Williams, J. P. 2007, ApJ, 670, 89
- Wang et al. (2009) Wang, W.-H., Barger, A. J., & Cowie, L. L. 2009, ApJ, 690,319
- Wang et al. (2011) Wang, R., et al. 2011, AJ, 142, 101
- Yan et al. (2007) Yan, L., et al. 2007, ApJ, 658, 778
- Yan et al. (2010) Yan, L., et al. 2010, ApJ, 714, 100
- Yang et al. (2007) Yang, M., Greve, T. R., Dowell, C. D., & Borys, C. 2007, ApJ, 2007, 660,1198
- Younger et al. (2007a) Younger. J. D., et al. 2007a, ApJ, 671, 1241
- Younger et al. (2007b) Younger. J. D., et al. 2007b, ApJ, 671, 1531

| Name | RA(2000) | DEC(2000) | z | |
|---|---|---|---|---|
| GN10 | 12:36:33.451 | 62:14:08.71 | 4.05 | Wang et al. (2007) |
| GN20 | 12:37:11.902 | 62:22:12.12 | 4.05 | Daddi et al. (2009a) |
| GN20.2 | 12:37:08.772 | 62:22:01.72 | 4.05 | Daddi et al. (2009a) |
| AzTEC1 | 09:59:42.863 | 02:29:38.23 | 4.64 | Younger et al. (2007b) |
| AzTEC3 | 10:00:20.703 | 02:35:20.53 | 5.30 | Younger et al. (2007b) |
| Capak4.55 | 10:00:54:484 | 02:34:35.94 | 4.55 | Capak et al. (2008) |
| J033229 | 03:32:29.305 | 27:56:19.45 | 4.76 | Coppin et al. (2010) |
| Name | 3.6m | 4.5m | 5.8m | 8.0m | 24m | 250m | 350m | 850m | 1100m | 1.4gHz |
|---|---|---|---|---|---|---|---|---|---|---|
| (Jy) | (Jy) | (Jy) | (Jy) | (Jy) | (mJy) | (mJy) | (mJy) | (mJy) | (Jy) | |
| GN10 | 1.140.14 | 1.640.13 | 2.330.24 | 5.370.37 | 26.25.08 | 19.64.0 | 21.03.1 | 12.01.4 | 5.001.0 | 34.44.2 |
| GN20 | 21.90.05 | 21.50.17 | 21.00.10 | 20.40.06 | 65.54.45 | 19.13.0 | 30.12.9 | 20.32.1 | 11.51.0 | 73.82.1 |
| GN20.2 | 22.50.07 | 22.50.38 | 22.00 .23 | 21.40.14 | 20.23.45 | 10.61.4 | 3.62.5 | 9.902.1 | — | 170.12.8 |
| AzTEC1 | 3.870.13 | 4.530.23 | 7.904.50 | 13.02.88 | 46.44.90 | 19.82.9 | 27.04.4 | 15.61.1 | 10.71.3 | 48.014.0 |
| AzTEC3 | 4.900.20 | 6.600.30 | 4.501.90 | 3.202.30 | 5.305.30 | 21.77.0 | 33.719.0 | 8.701.5 | 7.601.2 | — |
| Capak4.55 | 7.900.20 | 5.800.40 | 3.401.30 | 10.03.60 | 26.013.0 | 12.52.0 | 14.53.4 | — | 4.801.5 | 45.09.00 |
| J033229 | 2.900.10 | 4.000.10 | 6.30.40 | 9.200.40 | 32.05.00 | — | — | 5.001.4 | — | 24.06.30 |
| Name | Tdust [K] | Tdust [K] | Tdust [K] | Tdust [K] |
|---|---|---|---|---|
| Optical Thick/Fixed Index | Optical Thin/Fixed Index | Optical Thick/The Blain Model | Optical Thin/The Blain Model | |
| GN10 | 532 | 402 | 673 | 412 |
| GN20 | 461 | 361 | 542 | 361 |
| GN20.2 | 865 | 674 | 715 | 573 |
| AzTEC1 | 572 | 432 | 743 | 432 |
| AzTEC3 | 797 | 545 | 1039 | 241 |
| Capak4.55 | 644 | 473 | 835 | 473 |
| Name | Log(/L⊙) | Tdust [K] | Log(L4.5/L⊙) | q | M(1010M⊙) | Mdust(109M⊙) |
|---|---|---|---|---|---|---|
| GN10 | 12.850.03 | 532 | 11.130.08 | 2.270.12 | 2.70.5 | 2.430.48 |
| GN20 | 13.050.01 | 461 | 11.530.03 | 2.140.16 | 5.00.6 | 5.240.81 |
| GN20.2 | 12.830.03 | 865 | 11.020.07 | 1.550.05 | 3.01.0 | 3.411.32 |
| AzTEC1 | 13.170.03 | 572 | 11.520.05 | 2.250.29 | 3.650.71 | |
| AzTEC3 | 13.190.23 | 797 | 11.31 | 2.15 | 5.30.6 | 1.260.38 |
| Capak4.55 | 12.950.26 | 644 | 11.250.22 | 2.140.17 | 2.60.5 | 2.070.48 |
| J033229 | 12.780.12 | —- | 11.380.07 | 2.300.18 | 1.60.3 |