The search for shock-excited H2 in Virgo spirals experiencing ram pressure stripping
Abstract
We investigate the presence of shock-excited H2 in four Virgo cluster galaxies that show clear evidence of ongoing ram pressure stripping. Mid-infrared (MIR) spectral mapping of the rotational H2 emission lines were performed using the Infrared Spectrograph (IRS) on board the Spitzer space telescope. We target four regions along the leading side of galaxies where the intracluster medium (ICM) appears to be pushing back the individual galaxy’s interstellar medium (ISM). For comparison purposes, we also study two regions on the trailing side of these galaxies, a region within an edge-on disk and an extraplanar star-forming region. We find a factor of 2.6 excess of warm /PAH in our sample relative to the observed fractions in other nearby galaxies. We attribute the /PAH excess to contributions of shock-excited which is likely to have been triggered by ongoing ram pressure interaction in our sample galaxies. Ram pressure driven shocks may also be responsible for the elevated ratios of [Feii/Neii] found in our sample.
1 Introduction
Ram pressure stripping is the removal of a galaxy’s interstellar medium (ISM) by the gaseous medium through which it is moving. There is widespread evidence for ram pressure stripping in nearby clusters of galaxies, including truncated disks of gas (neutral Hydrogen, HI), dust (far-infrared, FIR), and star formation (H) within normal stellar disks (Koopmann & Kenney, 2004; Chung et al., 2009; Cortese et al., 2010), and one-sided extraplanar tails of HI, H and young stars (Kenney et al., 2004; Crowl et al., 2005; Chung et al., 2007; Cortese et al., 2007; Sun et al., 2010; Yagi et al., 2010; Smith et al., 2010; Merluzzi et al., 2013). The loss of gas from ram pressure stripping is likely the main star formation quenching mechanism for spirals and dwarf galaxies in clusters, and transforms galaxies from blue, late-type galaxies into red, early-type galaxies (Koopmann & Kenney, 2004; Crowl et al., 2010; Kormendy & Bender, 2012; Kenney et al., 2014).
In addition to removing gas from the galaxies, ram pressure may disturb the ISM gas which is not yet stripped. The radio continuum emission provides evidence for this, as well as evidence for ongoing ram pressure interactions. Ridges of enhanced linearly polarized radio continuum emission are often observed along the leading sides of galaxies experiencing ram pressure (Vollmer et al., 2004, 2007, 2008), presumably where the magnetized ISM is compressed. Maps of the total radio continuum emission can show long tails on the trailing side (Gavazzi & Jaffe, 1987; Crowl et al., 2005), as well as local radio deficit regions on the leading side just beyond the ridges of enhanced radio polarization (Murphy et al., 2009). Local radio deficit regions can be identified based on the good correlation between the FIR and the radio continuum emission in star-forming galaxies (Helou et al., 1985; de Jong et al., 1985; Yun et al., 2001). The correlation is also good locally except that the radio emission is more spread out than the FIR emission, since the relativistic electrons can diffuse far from their acceleration sites (Hoernes et al., 1998; Murphy et al., 2006; Hughes et al., 2006; Murphy et al., 2008; Dumas et al., 2011). While in undisturbed galaxies, the radio and smoothed FIR distributions are very similar, Murphy et al. (2009) found that Virgo spirals experiencing ram pressure exhibit a local deficit of radio emission, with respect to a smoothed FIR map, at the leading sides of the ram pressure interaction. This local radio deficit is due predominantly to a lack of relativistic electrons on the leading side, probably because the magnetic fields are compressed and aligned along the leading edge, preventing relativistic electrons from diffusing outwards in the direction of the ram pressure, since they cannot cross the magnetic field lines (Pfrommer & Dursi, 2010).
Interestingly, the galaxies which have the strongest local radio deficits have globally enhanced radio/FIR ratios, suggesting that the radio emission is somehow enhanced by a ram pressure interaction (Murphy et al., 2009). This global radio enhancement is not due simply to the radio tails, which are relatively weak in the Virgo galaxies, but associated with the main body of the galaxy. Evidence for enhanced radio emission in cluster galaxies has also been found by Miller & Owen (2001) and Reddy & Yun (2004). In one of the clearest cases of active ram pressure stripping (NGC 4522), Vollmer et al. (2004) measured flat radio spectral indices along the ridges of high polarization which suggest the presence of cosmic ray electron acceleration (Murphy et al., 2009). Hence, the excess radio emission could be caused by re-acceleration of cosmic ray electrons by shocks driven throughout the ISM by ram pressure. To test the viability of this hypothesis, a measure of the presence of shocks is needed in these galaxies with enhanced global radio emission.
We propose that cluster galaxies with excess non-thermal radio emission may contain warm gas which has been shock-heated by the process of ram pressure stripping. Shock-heated has been observed along a shock ridge resulting from a high-velocity collision between an intruder galaxy and the gas in the intragroup medium of Stephan’s Quintet (Appleton et al., 2006). The shock-heated gas then cools and forms molecules which may be excited by low velocity, non-dissociative magnetohydrodynamic (MHD) shocks that dissipate most of the collision’s mechanical energy. Mid-infrared (MIR) observations of ESO 137-001 within the Abell 3627 cluster (Sivanandam et al., 2010) reveal a shock-excited warm molecular hydrogen tail corresponding to the X-ray and H tails that have resulted from ram pressure stripping (Sun et al., 2006, 2007). Recently, ram-pressure driven shocks were also observed in the A3558 cluster using optical line ratio diagnostics (Merluzzi et al., 2013).
The purpose of this paper is to search for possible ram pressure-driven shock excitation of in four Virgo cluster spirals experiencing ongoing ram pressure stripping. We perform MIR spectral mapping between the wavelengths of 5–38 m using the Infrared Spectrograph (IRS; Houck et al., 2004) on board the Spitzer Space Telescope. Section 2 describes our sample, observations and data processing. The resulting spectral line measurements and rotational emission line maps are presented in Section 3.
Section 4 examines the ISM conditions using the MIR emission in a variety of non-nuclear regions sampled from four Virgo galaxies undergoing ram pressure stripping. Section 4.1 investigates the ratio of warm (rotational emission lines observed in the MIR) relative to the Polycyclic Aromatic Hydrocarbon (PAH) emission. Since ongoing star formation and its associated Hii and photodissociation regions (PDRs) are responsible for a relatively uniform /PAH ratio, an increase in this ratio is indicative of heating via an additional mechanism such as shocks (possibly driven by the ram pressure interaction). Section 4.2 compares the MIR emission line ratios [Feii/Neii] and [Siii/Siii] of our sample to those from the SINGS survey. Typically, observations of AGNs find enhanced ratios of [Feii/Neii] and [Siii/Siii] relative to those of normal star-forming regions. Do galaxies experiencing ram pressure show similar levels of enhancement? In Section 4.3, we constrain the temperatures of the warm emission observed in our sampled regions using one-temperature and two-temperature dust models. From this, we investigate whether the observed is warmer on the leading sides and cooler on the trailing sides of galaxies falling into the ICM. A summary of our results is detailed in Section 5.
2 Sample and observations
2.1 Galaxy sample
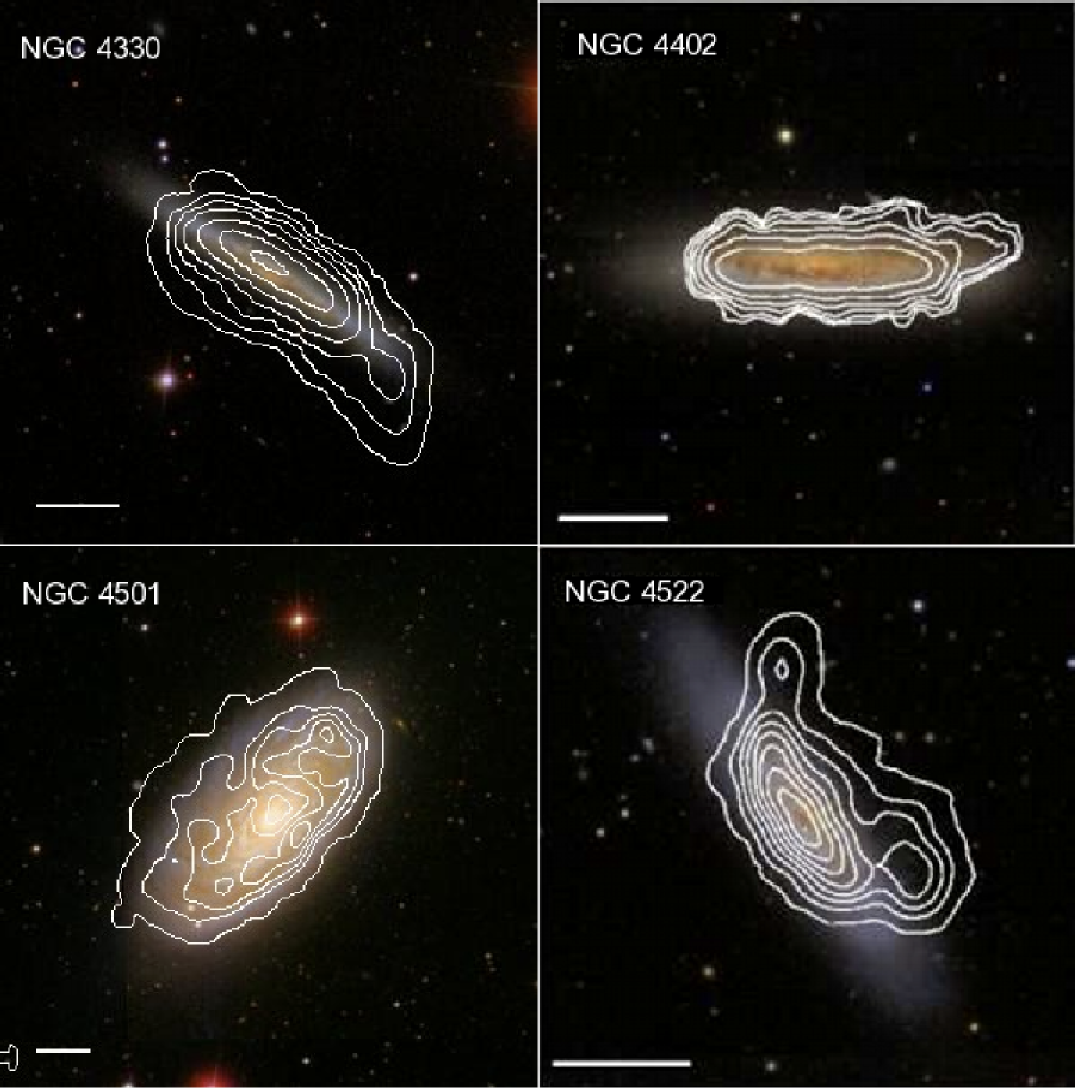
We have selected four Virgo spirals (NGC 4330, NGC 4402, NGC 4501 and NGC 4522) with clear evidence for strong ongoing ram pressure. Evidence that these galaxies have experienced ram pressure stripping recently includes: (1) truncated gas disks within undisturbed stellar disks (Koopmann & Kenney, 2004; Chung et al., 2009); (2) young stellar populations in their gas-stripped outer stellar disks (Crowl & Kenney, 2006, 2008; Abramson et al., 2011); and (3) one-sided extraplanar tails of Hi and dust (Kenney et al., 2004; Crowl et al., 2005; Chung et al., 2007, 2009; Wong & Kenney, 2014). These properties can persist after ram pressure diminishes, so partly reflect the stripping history of the galaxies. We are most interested in measures of the current strength of ram pressure, since this is likely to be related to the strength of any ram pressure-induced shocks.
Evidence of ongoing ram pressure is present in the form of: (1) one-sided ridges of enhanced polarized radio continuum (Vollmer et al., 2004, 2007, 2008); and (2) one-sided “radio deficit regions” (Murphy et al., 2009). The polarized ridges likely indicate ISM compression on the leading sides of the ram pressure interactions (Vollmer et al., 2004, 2007, 2008). Beyond the polarized ridges, local radio deficit regions are found in ram pressure affected galaxies where the densities of cosmic ray electrons and magnetic fields are lower than in undisturbed galaxies. NGC 4402 and NGC 4522 each have strong polarized ridges and strong radio deficit regions. NGC 4330 has a strong radio deficit region but no prominent polarized ridge, perhaps because of an unfavorable viewing geometry (Vollmer & Leroy, 2011). NGC 4501 has a strong polarized ridge but is not in the same sample of Murphy et al. (2009) that measured the radio deficit regions. Hence, all four of these galaxies have clear indications of strong ongoing ram pressure.
Figure 1 shows three-color optical images for our sample of galaxies from the Sloan Digital Sky Survey (SDSS) overlaid with contours of Hi from the VLA Imaging of Virgo in Atomic Hydrogen survey (VIVA; Chung et al., 2009). The Hi gas morphology in each of these galaxies appears to be pushed from one side and lop-sided; while the optical stellar disk appears unaffected.
All four spirals are approximately 1.5–3.3 degrees (0.4–0.9 Mpc) from the cluster center where many galaxies exhibit evidence for ongoing ram pressure stripping. It should be noted that NGC 4330, NGC 4402 and NGC 4522 are small spirals ( )which are highly-inclined, while, NGC 4501 is a moderately-inclined massive spiral ( ). Our sample favors highly-inclined galaxies because in such galaxies, extraplanar features (e.g. gas tails resulting from ram pressure stripping) are more easily identified and distinguished from the main disk of the galaxy. Table 1 lists the properties of our sample galaxies.
| Inclination | log | |||||||
| Galaxy | (J2000) | (J2000) | (km s-1) | (∘) | (∘) | (mag) | (/) | |
| (1) | (2) | (3) | (4) | (5) | (6) | (7) | (8) | (9) |
| NGC 4330 | 12:23:16.14 | 11:22:01.5 | 1566 | 79 | 2.3 | 13.09 | ||
| NGC 4402 | 12:26:07.71 | 13:06:50.3 | 236 | 80 | 1.5 | 12.55 | ||
| NGC 4501 | 12:31:58.79 | 14:25:05.0 | 2278 | 62 | 3.0 | 10.36 | ||
| NGC 4522 | 12:33:39.44 | 09:10:30.7 | 2331 | 79 | 3.3 | 12.99 |
2.2 Observations
For the purposes of our project we are interested in studying the extranuclear and/or extraplanar regions of the galaxies which are being most affected by the ICM–ISM interaction. Therefore we did not perform spectral mapping of entire galaxies but rather, deeper observations of individual region(s) within each galaxy.
We target the leading edges of the ICM–ISM interactions in each of our sample galaxies (N4330, N4402_1, N4501_SW & N4522_NE). In the three most highly-inclined galaxies (NGC 4330, NGC 4402 and NGC 4522), our observing apertures include the outer edges of the truncated gas disks as well as the extraplanar regions above or below the disks. For comparison, we also study a region dominated by the main star-forming disk of NGC 4402 (N4402_2); two regions on the trailing sides of the disks of NGC 4501 and NGC 4522 (N4501_NE & N4522_SW1); as well as an extraplanar star-forming region in NGC 4522 (N4522_SW2). Table 2 lists the positions and exposure times of the 8 targeted regions discussed in this paper. The positions of the 6 pointings and 8 regions are as illustrated in panels (a) and (b) of Figure 3.
| RA | Dec | Offset | PA | Exp. time | |
|---|---|---|---|---|---|
| Target | (J2000) | (J2000) | (′) | (∘) | (hours) |
| (1) | (2) | (3) | (4) | (5) | (6) |
| N4330 | 12:23:20.5 | 11:22:33 | 1.19 | 88.1 | 2.7 |
| N4402_1 | 12:26:10.0 | 13:06:39 | 0.59 | 91.3 | 3.4 |
| N4402_2 | 12:26:09.7 | 13:06:49 | 0.52 | 84.5 | 3.4 |
| N4501_SW | 12:31:56.6 | 14:24:31 | 0.78 | 2.4 | |
| N4501_NE | 12:32:03.0 | 14:25:57 | 1.34 | 86.7 | 2.4 |
| N4522_NE | 12:33:41.0 | 09:10:56 | 0.57 | 85.8 | 3.1 |
| N4522_SW1 | 12:33:37.0 | 09:10:16 | 0.65 | 3.8 | |
| N4522_SW2 | 12:33:37.0 | 09:10:08 | 0.77 | 3.8 |
| Properties | SL2 | SL1 | LL2 | LL1 |
|---|---|---|---|---|
| Pixel scale | 1.8″ | 1.8″ | 5.1″ | 5.1″ |
| Spectral resolution | 60–120 | 60–120 | 60–120 | 60–120 |
| (m) | 5.2–7.7 | 7.4–14.5 | 14.0–21.3 | 19.5–38.0 |
| Slit size (″) | 3.657 | 3.757 | 10.5168 | 10.7168 |
Our sample was observed in July 2008 using the IRS instrument on board the Spitzer Space Telescope (Houck et al., 2004). Spectral mappings within the wavelength range of 5 to 38 m were completed using the Short-Low (SL) and Long-Low (LL) modules. Each module comprises of 2 sub-modules for the first-order and second-order spectra. Table 3 lists the properties of the SL and LL modules.
We modeled our observation strategy loosely upon the spectral mapping performed by the SINGS Legacy team (Kennicutt et al., 2003) with the exception that we did not map the cores of galaxies. As such, our integration times are longer as we need to probe to fainter surface brightness levels at the outer edges of galaxies. To reduce the effects of bad pixels, each perpendicular slit pointing is offset by half the slit width. We then employed two cycles for each observation to provide greater redundancy against rogue pixel identification and cosmic ray detections.
Within the wavelength range of 5 to 38 m, we expect to find three types of emission features in addition to the MIR dust continuum, which is produced by a combination of transiently heated grains at various temperatures and a hot thermal dust component. These emission features include: (1) emission from PAH molecules. Most of the PAH emission can be loosely grouped into four large emission complexes around the wavelengths of 7.7, 11.3, 12.7 and 17 m; (2) emission from the rotational transitions of the ground vibrational states of warm ; (3) atomic fine structure line emission from various species such as Ne ii, Ne iii, Si ii and S iii which can be used to describe the hardness of the radiation field and the electron density of our observed regions.
2.3 Data processing
The final spectral maps were derived from the Basic Calibrated Data (BCD) datasets generated by the Spitzer Science Center (SSC) pipeline (version S18.7). Using Cubism (version 1.6; Smith et al., 2007a), the datasets were further processed and the spectral maps of each pointing were generated for each of the four IRS modules. The spectra of the four IRS modules (derived from the overlap region between the four modules) were merged to produce a single continuous spectrum spanning 5–38 m for each of the observed pointings. For each pointing, we extract a region of approximately 1 kpc2 (approximately 0.5 arcmin2). Due to slight mismatches between the different spectral segments which result from small residual photometric and astrometric uncertainties, we scaled the spectral segments according to the method outlined by Smith et al. (2007b). The SL2 and LL2 modules are scaled to match the spectra from SL1 and LL1, respectively. Subsequently, the combined SL spectrum is scaled to match the LL spectrum of each pointing.
To determine the accuracy of the resultant spectra, we compared the integrated flux filtered through the 8 m IRAC and the 24 m MIPS bandpasses to that measured from the 8 m IRAC and 24 m MIPS images of the same region from our MIR imaging counterpart survey, the Spitzer Survey of Virgo (SPITSOV; Wong et al., 2014). The 8 m and 24 m measurements from the SPITSOV and IRS observations agree to within the calibration uncertainties (15%) of each instrument.
3 Results
3.1 MIR spectra
The emission line identification and decomposition of the calibrated spectra were performed using Pahfit, an IDL tool for decomposing Spitzer IRS spectra of PAH emission sources and the recovery of weak, blended dust emission features including silicon absorption (Smith et al., 2007b). We fit our spectra with the default parameter settings while omitting a fit for a Galactic dust extinction model. It should be noted that our main results do not change had we opted to fit an extinction model for each target.
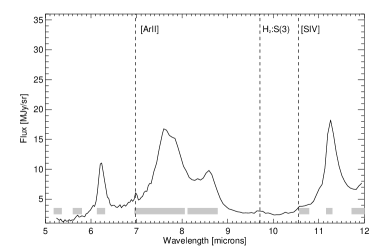
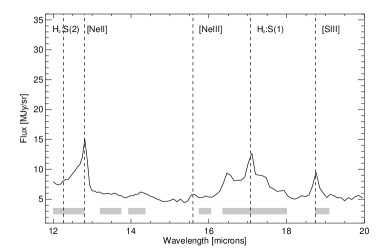
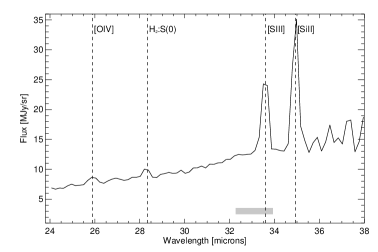
In Figure 2, we show the spectrum of N4402_1 overlaid with labels as an example of the resultant emission lines found by Pahfit. The rotational emission and the atomic fine structure lines are marked by vertical dashed lines. The wavelength range at which emission from dust features are observed are defined by the span of the shaded horizontal gray bars. As our target regions include star-forming regions, the resulting PAH emission complexes at the shorter wavelengths ( m) are overwhelmingly stronger than the higher excitation rotational transitions that are at coincident wavelengths.
 |
 |
 |
The emission line intensities and uncertainties determined by Pahfit are listed in Table 4. The rotational lines are given at the beginning of the table, followed by the fine-structure lines and then the emission from the PAH dust complexes. Upper limits are provided where the signal-to-noise ratio is less than 3.
| Object | ||||||||
| Emission line feature | N4330 | N4402_1 | N4402_2 | N4501_SW | N4501_NE | N4522_NE | N4522_SW1 | N4522_SW2 |
| (1) | (2) | (3) | (4) | (5) | (6) | (7) | ||
| Rotational emission | ||||||||
| 0.17 | 0.48 | 0.63 0.04 | 0.42 0.05 | 0.19 0.05 | 0.260.04 | 0.14 0.04 | 0.61 0.08 | |
| 0.31 | 1.74 0.09 | 2.44 | 1.28 0.09 | 0.29 | 0.62 0.08 | 0.29 0.08 | 0.55 0.13 | |
| 0.23 | 0.68 0.07 | 0.91 0.05 | 0.82 | 0.32 | 0.17 0.04 | 0.18 | 0.62 | |
| 0.23 | 0.45 0.05 | 0.91 0.06 | 0.59 | 0.70 | 0.22 | 0.29 | 0.45 | |
| 0.69 | 0.36 | 0.42 | 0.48 | 0.54 | 1.18 | 0.43 | 0.89 | |
| Atomic fine structure emission | ||||||||
| Ar ii | 0.95 | 1.60 0.18 | 2.25 0.21 | 1.14 | — | 0.64 | 0.71 | — |
| Ar iii | — | — | 0.38 | — | — | 0.23 | — | — |
| S iv | 0.20 | 0.23 | 0.53 0.15 | 0.36 | — | 0.33 | 0.21 | 0.38 |
| Ne ii | 0.77 0.06 | 4.00 0.05 | 5.62 0.05 | 2.39 0.11 | 0.26 0.06 | 2.02 0.07 | 0.31 0.07 | 0.52 |
| Ne iii | 0.18 | 0.57 0.09 | 0.87 0.06 | 0.72 0.09 | 0.23 0.07 | 0.26 0.06 | 0.21 | 0.38 |
| S iii18μm | 0.36 0.06 | 1.51 0.06 | 2.76 0.10 | 1.31 0.09 | 0.27 0.06 | 0.72 0.06 | 0.18 | 0.41 |
| O iv | — | 0.66 0.08 | 0.34 0.08 | 0.61 | 0.21 | — | — | — |
| Fe ii | 0.15 | 0.20 | 0.48 0.08 | 0.46 | 0.21 | 0.20 0.05 | — | 0.33 |
| S iii33μm | 0.48 | 3.35 0.08 | 3.54 0.08 | 1.28 0.10 | 0.20 | 0.98 0.07 | 0.22 | 0.54 0.12 |
| Si ii | 0.51 0.09 | 4.81 0.08 | 6.37 0.08 | 2.29 0.11 | 0.36 0.08 | 1.26 0.16 | 0.50 0.09 | 0.88 0.23 |
| PAH emission features and complexes | ||||||||
| 6.2 m | 10.9 1.0 | 57.2 0.5 | 92.6 0.5 | 32.6 0.7 | 13.8 0.6 | 26.9 0.6 | 6.2 0.7 | 4.2 1.1 |
| 7.7 m | 40.7 2.5 | 215 2 | 337 3 | 114 2 | 24.3 1.9 | 81.8 2.0 | 15.6 1.8 | 12.3 1.3 |
| 11.3 m | 8.40.2 | 43.7 0.3 | 70.7 0.3 | 29.7 0.2 | 6.5 0.3 | 20.3 0.2 | 3.8 0.2 | 5.6 0.4 |
| 12.6 m | 3.2 0.3 | 27.0 0.3 | 43.5 0.3 | 14.1 0.4 | 2.7 0.3 | 10.5 0.3 | 2.1 0.2 | 2.6 0.5 |
| 17.0 m | 1.860.45 | 23.5 0.5 | 32.1 0.5 | 18.8 0.6 | 2.47 0.41 | 7.03 0.46 | 0.95 | 3.0 0.6 |
3.2 Warm emission line maps
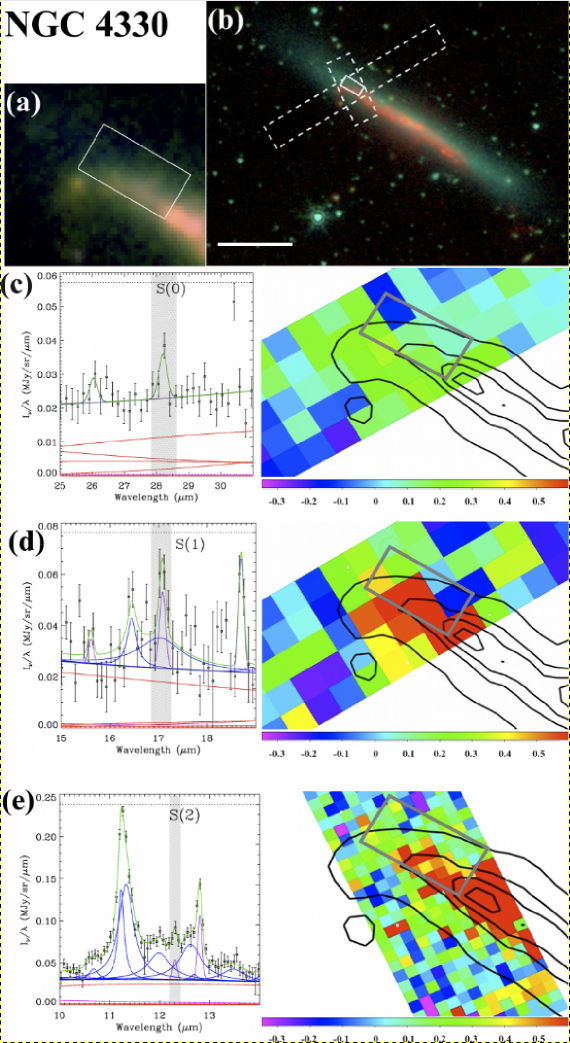
Using the spectral mapping capabilities of the IRS instrument, we map the distribution of in various rotational transitions within our sample. The spatial distributions of the , and rotational transitions of for each of our observed regions are shown in Figure 3. Five panels are shown for each IRS pointing in Figure 3: Panel (a) shows a magnified view of the targeted region(s) in our galaxy sample. In this 3-color IRAC image, the blue, green and red represent the 3.6 m, 5.8 m and continuum-subtracted 8 m PAH emission (Helou, 2004), respectively). Panel (b) shows the 3-color IRAC image of the target overlaid with two white dashed-lined rectangles delineating the field-of-view of the SL and LL modules. In panel (b) the blue, green and red colors represent the 3.6, 4.5 and continuum-subtracted 8 m PAH emission, respectively. The solid rectangle shows the region where the spectrum is extracted. Panels (c), (d) and (e) show the , and spectra and the emission line maps overlaid with contours of the 8 m PAH map, respectively.
Observations of star-forming regions on scales of several hundred parsecs find the PAH emission to originate from shell-like regions around the central regions (e.g. Bendo et al. (2008) and references therein). However, we do not observe any spatial differences between the peaks of our warm emission and that of the PAH emission due to the low angular resolution of our maps.
We find significant emission not only from star-forming regions within the galaxy disks, but also from the south-western extraplanar star-forming region of NGC 4522 (N4522_SW2). The ratio between and are fairly similar in most of our target regions with the exception of N4522_SW2. Whereas in the disk the emission is stronger, in the extraplanar region (N4522_SW2) the emission is stronger. The fraction of N4522_SW2 is 2.6 times greater than the average of all the other targeted regions, where the mean of is approximately and the standard deviation is 0.15. This result suggests that the extraplanar gas is much colder than the gas in the disk. While there are Hii regions in the stripped extraplanar gas, we hypothesize that the density of the heating sources in the extraplanar star-forming regions is likely to be lower than those in the disk regions. Further details of our temperature estimates can be found in Section 4.3 where we determine the temperatures of the warm observed in our sampled regions using one-temperature and two-temperature dust models.
 |
![[Uncaptioned image]](/html/1401.6223/assets/x6.png) |
Figure 3 (continued… NGC 4402). Note that the spectra in panels (c), (d) and (e) are from Region 1. Region 1 is south-east of Region 2.
![[Uncaptioned image]](/html/1401.6223/assets/x7.png) |
Figure 3 (continued… NGC 4501 - southwest region)
![[Uncaptioned image]](/html/1401.6223/assets/x8.png) |
Figure 3 (continued… NGC 4501 - northeast region)
![[Uncaptioned image]](/html/1401.6223/assets/x9.png) |
Figure 3 (continued… NGC 4522 - northeast region)
![[Uncaptioned image]](/html/1401.6223/assets/x10.png) |
Figure 3 (continued… NGC 4522 - southwest region). Note that the spectra in panels (c), (d) and (e) are from Region 1 (east of Region 2).
4 Spectral analysis and discussion
Does the ram pressure interaction produce shocks which are strong enough to significantly enhance the /PAH ratios above the typical values expected from PDRs of star-forming galaxies in the field? Section 4.1 examines the warm /PAH ratios of our sampled regions and compares them to those of a representative sample of field galaxies from the SINGS survey. We also investigate the [Feii/Neii] and [Siii/Siii] emission line ratios for possible shock enhancements in Section 4.2.
Spectral mapping of the warm emission (Section 3.2) hint at N4522_SW2 having lower temperatures relative to the other regions sampled closer to the galactic disks. In Section 4.3, we estimate the warm temperatures ( K) by fitting simple one-temperature and two-temperature models to the excitation diagrams derived from the observed rotational emission.
4.1 Ratio of warm to PAH emission
If both the PAH and the warm emission originate from PDRs near where star formation is occuring, the ratio of warm to PAH should be fairly constant. Indeed, recent observations of galaxies in the Local Universe, starburst galaxies and Seyfert galaxies have confirmed the strong correlation between the 8 m PAH emission and the emission from rotational emission (e.g. Rigopoulou et al., 2002; Roussel et al., 2007). If a fraction of the warm emission is heated intermittently by the dissipation of interstellar turbulence (Falgarone et al., 2005) in addition to the excitation of cold via the UV emission of the young stellar population (e.g. Giard et al., 1994), such processes will be common in the ISM of both cluster and non-cluster galaxies. Therefore, the /PAH fractions should still be relatively similar between the cluster and non-cluster galaxies even if the intermittent interstellar turbulence introduces more scatter into the observed ratios.
Additional heating mechanisms such as shocks and gas heating via X-ray emission (mostly from AGNs) can produce significantly enhanced /PAH fractions relative to the typical fractions found in PDRs alone. The intense radiation fields which exist in the ionized regions around AGN (Desert & Dennefeld, 1988; Voit, 1992) are likely to excite the cold molecules to fluoresce and to radiatively cascade through the ro-vibrational levels of the ground electronic state (Roussel et al., 2007). Also, the AGN or supernova-induced shocks are more likely to destroy the PAH molecules while exciting more cold molecules into the warm phase (Roussel et al., 2007).
As our regions do not contain any AGN nor strong X-ray emission, any enhancements in the ratio between warm and PAH emission suggest the likely presence of shocks possibly due to ram pressure stripping. Our measurements of the warm (++) and the 8 m PAH emission for our sample are listed in Table 5. A range is provided for regions where significant detections were not measured in all three transitional states. The lower bound of the range consists of the sum of the true detected values and the uncertainties of these measurements added in quadrature. The upper bound is the sum of the detected values and the 3 upper limits for non-detections.
We compare our observations to those from the SINGS survey (Roussel et al., 2007) in Figure 4. Our observations are represented by black star symbols, while the upper and lower limits of our non-detections are represented by the open rectangles. The publicly-available IRS spectra of the SINGS star-forming galaxies are processed using the same method as for our sample (see Section 2.3). The SINGS sample is divided into two types: nuclear (open circle) and non-nuclear ( symbol) targets. The SINGS non-nuclear targets consist of extranuclear star-forming regions and the nuclear targets often include AGN. Our target apertures are comparable in size to those of SINGS which range in diameter from 60 pc to 3.8 kpc (with a median of 900 pc) depending on the target distances (Roussel et al., 2007). Note that only the sources from SINGS with significant detections of all three lower level transition lines are plotted.
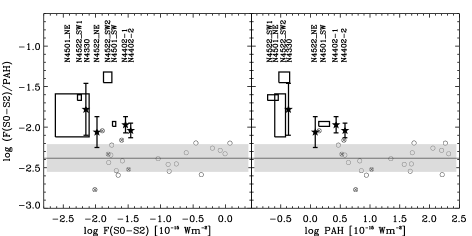
The /PAH ratios of the SINGS non-nuclear star-forming regions are very uniform and we find a mean log /PAH = dex where the standard error of the mean represents the uncertainty in this average ratio. On average, our observed regions have /PAH fractions that are 2.6 times greater (at a significance using the standard errors on the mean measurements) than those of the SINGS star-forming sample (see Figure 4). The mean log /PAH fraction for our non-nuclear regions of galaxies experiencing ram pressure stripping is dex.
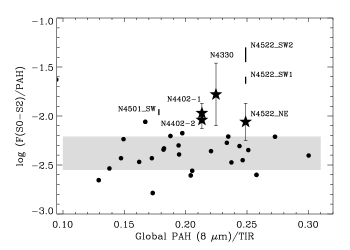
Although it is possible that the elevated /PAH fractions from our sample is due to a PAH deficit, we show in Figure 5 that this is not the case. Previous studies (e.g. Haas et al., 2002; Bendo et al., 2008) have shown that the PAH emission correlates well with the cold dust emission or the bolometric total 3–1100 m infrared emission (TIR) and that the the global PAH/TIR fraction is a good proxy for the intensity of the radiation field heating the diffuse ISM (Tielens et al., 1999; Helou et al., 2001). A comparison of the PAH/TIR ratios for our sample and those of the SINGS galaxies (Dale et al., 2007) reveal that our targeted regions are not deficient in PAH emission and in many cases are higher than those from the SINGS survey (see Figure 5). Hence, it is likely that the elevated /PAH fractions measured in most of our sample is due to an excess of warm and not a PAH deficit.
It is interesting to note that we do not observe any significant differences in /PAH excess between the leading or trailing sides of the galaxy disks within our sample with the one exception being the extraplanar star-forming region in NGC 4522 (N4522_SW2). We hypothesize that the very high /PAH fraction is probably due to both an enhancement in warm as well as a PAH deficit because the fraction found for this region (see Section 3.2) suggests that the density of star forming regions is much lower in the extraplanar region than the disk regions. As such, we expect that this will result in weaker PAH emission.
Compared to the ram pressure-driven shocks observed in the Norma cluster galaxy, ESO 137-001 (Sivanandam et al., 2010), our Virgo sample show a more modest excess in shock-excited . In the extraplanar star-forming tail of ESO 137-001, Sivanandam et al. (2010) found an excess of warm at an equal or greater level to that found in AGN regions within the SINGS sample. This result is sensible since the Coma and Norma clusters have much higher masses and generally stronger ram pressures than the Virgo cluster (Sun et al., 2007; Tonnesen & Bryan, 2012). Follow-up observations which probe to fainter surface brightness limits in warm over a larger field-of-view will provide further verification of our observed excess in the /PAH fractions as the observed ratios are very sensitive to the presence or absence of any diffuse emission. Alternatively, observations of other shock indicators will provide independent tests for the existence of ram pressure-induced shocks in the ISM of in-falling galaxies.
| Object | log (F()) | log (F()/PAH) |
|---|---|---|
| ( W m-2) | ||
| N4330 | ||
| N4402_1 | ||
| N4402_2 | ||
| N4501_SW | , | , |
| N4501_NE | , | , |
| N4522_NE | ||
| N4522_SW1 | , | , |
| N4522_SW2 | , | , |
4.2 Emission line ratios of [Feii/Neii] and [Siii/Siii]
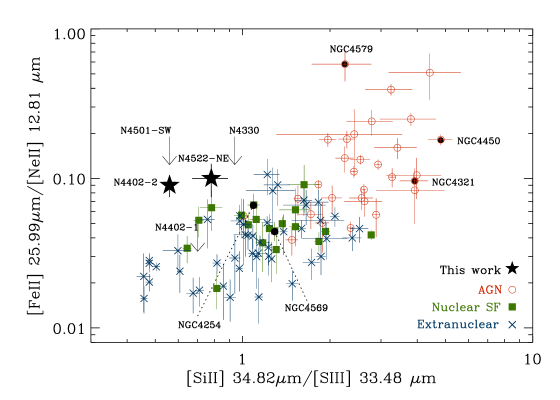
In this section, we examine the ratios of the MIR fine structure atomic emission lines [Feii/Neii] and [Siii/Siii] for possible evidence of shock-heating in the ISM. Typically, Neii] and Siii] have ionization potentials of approximately 22–23 eV and originate from within Hii regions; while [Feii and [Siii have lower ionization potentials (8 eV) and are emitted from outside Hii regions. Figure 6 plots [Feii/Neii] as a function of [Siii/Siii] for our sample (represented by star symbols and upper limits) as well as the observed ratios for a sample of AGN and star-forming regions from the SINGS survey (Dale et al., 2009). The emission line ratios are distinctly different between AGNs and star-forming regions—AGNs have higher line ratios. This difference is not well understood in detail, but is believed to be the result of either: (i) the enhanced liberation of dust grain constituents in AGN regions producing stronger Fe and Si lines; (ii) X-rays from AGN producing large volumes of low ionization gas (including enhanced [Feii 34.82 m and [Siii 25.99 m emission); or (iii) higher gas densities in AGNs than star forming regions (Dale et al., 2009).
In our sampled regions, we were able to detect these emission lines in the disk of NGC 4402 (N4402_2) and on the leading side of the disk of NGC 4522 (N4522_NE). Our [Siii/Siii] ratios are consistent with star-forming regions from the SINGS sample but our [Feii/Neii] ratios are somewhat enhanced relative to the SINGS star-forming regions. While metallicity affects these line ratios (O’Halloran et al., 2006; Dale et al., 2009), the metallicities of our Virgo sample are between 0.5–1 (Crowl & Kenney, 2008)—within the range of metallicities of the extranuclear star-forming regions in SINGS (Dale et al., 2009). As our galaxies are within 100–200 Myr from peak ram pressure (Crowl & Kenney, 2008), it is possible that the increased [Feii/Neii] ratios relative to [Siii/Siii] are the result of interaction-driven shocks returning [Feii and [Siii from the dust grains back to the ISM. In the ISM of the Milky Way, there is a strong depletion of Fe onto grains (e.g. Savage & Sembach, 1996), and gas phase Fe is largely due to the processing of grains by shocks (e.g. Alonso-Herrero et al., 1997, 2003; Forbes & Ward, 1993; O’Halloran et al., 2006; Armus et al., 2007). Since Fe is approximately 7 times more easily depleted than Si in the Milky Way (Draine, 2004), a shock passing through the dusty ISM will release times more Fe than Si, possibly driving the ratio in the observed direction. If so, this suggests that the difference in line ratios between AGN and star-forming regions is not due to the enhanced liberation of atoms from dust grains in AGN, but is due to one of the other possibilities.
As can be seen in Figure 6, the SINGS sample includes several other Virgo cluster galaxies not in our sample. These other Virgo galaxies are not currently experiencing strong ram pressure stripping and lie within the core distribution of galaxies for both nuclear and extranuclear regions alike. As such, we posit that the elevated [Feii/Neii] ratios observed in our sample is due to an enhanced depletion of Fe, probably from shocks driven by ongoing ram pressure since ram pressure is the dominant physical process affecting our entire sample.
4.3 Excitation diagrams
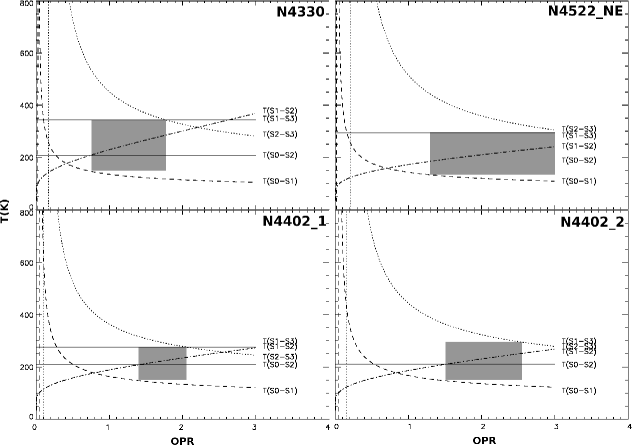
Do the elevated ratios of /PAH and [Feii/Neii] suggest warmer ISM conditions relative to other star-forming galaxies? Are the ISM conditions different between the leading and trailing sides of a galaxy experiencing ram pressure stripping? If local thermodynamic equilibrium (LTE) is valid for our regions, we can constrain the temperatures and densities of the warm and hot components by fitting simple one- and two-temperature models to to the excitation diagrams. Excitation diagrams (see Figure 8) illustrate the distribution of the level populations by mapping (where is the molecular column density and is the statistical weight for that transition) as a function of the upper level energy ().
Previous observations of starburst galaxies (e.g. Rigopoulou et al., 2002) and ultraluminous galaxies (e.g. Higdon et al., 2006) deduced that the lowest rotational levels are in LTE because the warm emission is likely to originate mainly from the densest PDRs with densities greater than cm-3 (Burton et al., 1992; Kaufman et al., 2006). However, recent observations of nearby galaxies in the SINGS sample found that the rotational transitions may not behave monotonically as a function of energy level—indicative of a departure from thermalization (Roussel et al., 2007). Using the method outlined by Roussel et al. (2007), the apparent transition temperatures should satisfy the following conditions if the observed gas is indeed at LTE and have ortho-to-para ratios (OPR) of 3: . However it should be noted that it is still possible to satisfy this condition for slight departures from local thermalization.
The excitation temperatures can be determined for each pair of transitions via:
| (1) |
where (Roussel et al., 2007). By assuming that the gas is in local thermodynamic equilibrium (LTE), the total column density, can be derived from , where is the partition function for temperatures greater than 40 K. In particular, the condition has to be satisfied if thermalization is attained. It should be noted that and are determined directly from the observed emission line fluxes and hence, independent of the OPRs at the high-temperature limit.
| Target | |||||
|---|---|---|---|---|---|
| (K) | (K) | (K) | (K) | (K) | |
| OPR = 3.0 | |||||
| N4330 | 104 | 208 | 369 | 344 | 282 |
| N4402_1 | 120 | 209 | 274 | 276 | 245 |
| N4402_2 | 122 | 210 | 268 | 296 | 279 |
| N4501_SW | 116 | 222 | 342 | 309 | — |
| N4501_NE | 99 | 214 | — | — | — |
| N4522_NE | 109 | 183 | 241 | 294 | 305 |
| N4522_SW1 | 106 | 204 | 336 | 369 | — |
| N4522_SW2 | 90 | 197 | 488 | 352 | — |
| OPR = 1.7 | |||||
| N4330 | 118 | 208 | 280 | 344 | 350 |
| OPR = 2.0 | |||||
| N4402_1 | 133 | 209 | 234 | 276 | 279 |
| OPR = 2.5 | |||||
| N4402_2 | 128 | 210 | 250 | 296 | 297 |
Table 6 lists the estimated apparent excitation temperatures for our sample and the shaded regions in Figure 7 show the possible range of OPR values for these targets. It should be noted that the the gray shaded regions do not include the uncertainties in our measurements. The conditions proposed by Roussel et al. (2007) for thermalization with an OPR of 3 can be satisfied by N4330 and N4522_NE when the uncertainties are taken into consideration. However in N4402_1 and N4402_2, the apparent temperatures of consecutive rotational transitions do not appear to behave monotonically as a function of upper level energy and suggest OPR values which are less than 3.
Assuming local thermalization, we can approximate a single temperature that corresponds to the lower energy transitions at and of our targets via where is the column density of the state, is the upper energy level of the transition and is the temperature of the warm in the state (Roussel et al., 2007). Table 7 lists the derived temperatures and column densities from these single-temperature fits for our observed regions. Bootstrap resampling is used to estimate the uncertainties in the derived properties.
In reality, the observed emission is likely to arise from gas at a range of temperatures. Previous studies (e.g. Roussel et al., 2007; Appleton et al., 2006) found a two-temperature model to be sufficient for characterizing the observed excitation diagrams based on a limited number of lines. However, to solve for the four parameters in a two-temperature model, we need to detect at least all four lowest transition states (, , and ). As we have not detected any emission in our sample of regions where thermalization can be assumed, we constrain the temperatures and column densities of the warm components via the simpler single-temperature model. Figure 8 shows the excitation diagrams for the observed rotational emission detected in N4330, N4501_SW, N4501_NE, N4522_NE, N4522_SW1 and N4522_SW2. The single-temperature fits of the warm components are represented by the solid black line. The temperature range of the warm component for the sample shown in Figure 8 is approximately 105–140 K.
We do not observe a significant difference in the warm temperatures on the leading versus the trailing sides of galaxies with the exception of the extraplanar star-forming region on the trailing side of NGC 4522 (N4522_SW2). Consistent with our results in Section 3.2, we find that the warm in the extraplanar region of NGC 4522 is indeed 20% colder than the other sampled regions within the disk of NGC 4522 (N4522_NE and N4522_SW1). On the other hand, the column density of in the state for N4522_SW2 is also a factor of 2 to 3 times greater than those of N4522_NE and N4522_SW1.
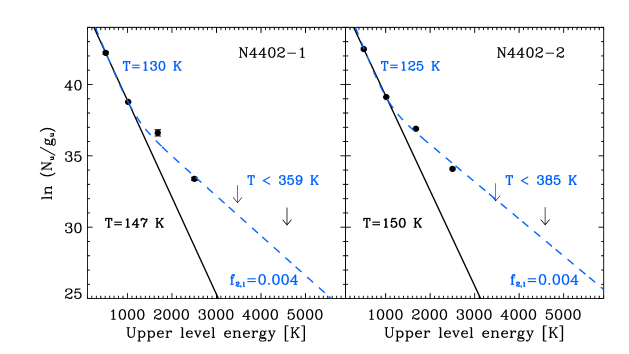
To estimate the gas temperatures and column densities of gas from the observations of N4402_1 and N4402_2, we adopt the method described by Roussel et al. (2007) where we fix the lower and upper temperatures in the two-temperature models to be at 0.98 and 1.3 , respectively. Using the OPR values described in Table 6 and the fixed temperatures to constrain the two-temperature fits, we estimate the hot-to-warm gas density ratio to be 0.004 for both the targeted regions in N4402, respectively. The results of these constrained fits can be found in Table 7. The energy diagrams of N4402_1 and N4402_2 overlaid with these constrained temperature models are presented in Figure 9. As the two-temperature models allow for a small contribution from the hotter gas to the and emission, the warm components from the two-temperature models typically have lower temperatures and higher column densities than those found from the the single-temperature models.
| Target | ||||||
|---|---|---|---|---|---|---|
| (K) | cm-2 | (K) | (K) | cm-2 | ||
| (1) | (2) | (3) | (4) | (5) | (6) | (7) |
| N4330 | 124 | 3.4 | – | — | — | — |
| N4402–1** | 147 | 6.9 | 130 | 10.7 | 0.004 | |
| N4402–2** | 150 | 8.4 | 125 | 16.4 | 0.004 | |
| N4501_SW | 140 | 4.8 | — | — | — | — |
| N4501_NE | — | — | — | — | — | — |
| N4522_NE | 130 | 4.9 | — | — | — | — |
| N4522_SW1 | 126 | 2.8 | — | — | — | — |
| N4522_SW2 | 105 | 9.7 | — | — | — | — |
**Temperatures listed under the two-temperature models for these targets are not fitted but fixed at 0.98 and 1.3 because these targeted regions are not consistent with the general case of LTE and have . Hence these two-temperature estimates provide only a rough approximation of the temperatures and column densities present within these targets.
The warm temperature estimates listed in Table 7 are compareable to those from the SINGS sample (Roussel et al., 2007) as well as that of the ram pressure-stripped spiral, ESO 137-001 (Sivanandam et al., 2010) in the Abell 3627 cluster. On the other hand, the temperatures of the hot components in the N4402 regions are more similar to the non-nuclear measurements of the nearby SINGS galaxies and are lower than that determined for ESO 137-001. We hypothesize that the greater temperatures found in Abell 3627 are due to a stronger ICM pressure being experience by ESO 137-001, relative to our sample of Virgo galaxies.
Previous X-ray observations found an extensive amount of hot X-ray emitting gas in the tail of ESO 137-001—a good indication of strong ICM thermal pressure (Sun et al., 2007, 2010). Other recent studies also concluded that the general lack of X-ray tails in ram pressure-stripped Virgo cluster galaxies is indicative of the low ICM pressure within the Virgo Cluster (Tonnesen et al., 2011; Jáchym et al., 2013). In IC 3418 (a ram pressure-stripped Virgo galaxy with the most similar star-forming tail to that in ESO 137-001), Jáchym et al. (2013) found the X-ray (0.5–2 keV) luminosity limit to be 280 times weaker than that measured in ESO 137-001 (Sun et al., 2010). Shock heating was found to be the most likely cause of the observed enhancement in the ratio of rotational to IR luminosity in the ESO 137-001 tail (Sivanandam et al., 2010). In the case where is heated by ram pressure-driven shocks, the stronger ram pressure experienced by ESO 137-001 would suggest a greater amount of heating than in Virgo cluster galaxies. The low temperature that we estimate for the N4522_SW2 region is also consistent with the idea that the possible shock-heating of in NGC 4522 is much lower than that in ESO 137-001.

5 Conclusions
In this paper, we describe the MIR spectral mapping of four Virgo spiral galaxies which show clear evidence for strong ongoing ram pressure stripping using the IRS instrument on board the Spitzer Space Telescope. The 8 regions that we study in this paper include the leading and trailing sides of the galaxies, a region in the star-forming disk as well as an extraplanar star-forming region located on the trailing side of NGC 4522.
A spatial coincidence between the warm emission and the 8 m PAH emission is observed for the entire sample studied in this paper. This suggests that most of our observed warm is related to star formation. In the extraplanar star-forming region on the trailing side of NGC 4522 (N4522_SW2), we find the highest ratio of to emission, relative to the other regions in our sample. The fraction measured in N4522_SW2 is 2.6 times greater than the average fraction in all the other targeted regions positioned closer to the star-forming disks. The temperature of the warm in N4522_SW2 is also approximately 20% colder than that of all the other regions sampled. This is probably due to the lower density of heating sources in the extraplanar star-forming region relative to the star-forming regions within the disk of the galaxy.
We find elevated fractions of H/PAH in this Virgo sample to be on average 2.6 times greater than that of nearby field galaxies from the SINGS sample. This suggests that additional mechanisms are contributing to the heating of the molecules within our observed sample in addition to heating by the newly-formed stellar population. Following the arguments for shock-heating in Roussel et al. (2007) and Timmermann (1998), we propose that our observed /PAH excess may be due to shocks generated via the ram pressure interaction. A comparison with global PAH/TIR ratios shows that the elevated H/PAH ratios are due to increased emission, and not diminished PAH emission. Elevated fractions of [Feii/Neii] relative to [Siii/Siii] also support the hypothesis for additional ISM-heating via shocks. It is plausible that shocks are returning greater amounts of Fe from the dust grains back to the gas phase than Si.
Although the estimated temperatures for the warm and hot components for NGC 4402 is similar to those determined for star-forming regions in SINGS sample (Roussel et al., 2007), the temperature constraints for the hot components of N4402_1 and N4402_2 are much colder than that found for the ram pressure-stripped spiral, ESO 137-001, in the Abell 3627 cluster (Sivanandam et al., 2010). In contrast to the X-ray tail(s) observed in ESO 137-001, the general lack of of X-ray tails in Virgo galaxies experiencing ram pressure stripping suggests that the ICM pressure is much greater in Abell 3626 than that in the Virgo Cluster (Sun et al., 2007, 2010; Tonnesen et al., 2011; Jáchym et al., 2013). Hence, even though we find some evidence for shock-heating within our Virgo sample (possibly as a result of ram pressure), the shock-heating is weaker in the Virgo Cluster than in Abell 3627 as a consequence of the weaker ICM pressure.
References
- Abramson et al. (2011) Abramson, A., Kenney, J. D. P., Crowl, H. H., Chung, A., van Gorkom, J. H., Vollmer, B., & Schiminovich, D. 2011, AJ, 141, 164
- Alonso-Herrero et al. (2003) Alonso-Herrero, A., Rieke, G. H., Rieke, M. J., & Kelly, D. M. 2003, AJ, 125, 1210
- Alonso-Herrero et al. (1997) Alonso-Herrero, A., Rieke, M. J., Rieke, G. H., & Ruiz, M. 1997, ApJ, 482, 747
- Appleton et al. (2006) Appleton, P. N., et al. 2006, ApJ, 639, L51
- Armus et al. (2007) Armus, L., et al. 2007, ApJ, 656, 148
- Bendo et al. (2008) Bendo, G. J., et al. 2008, MNRAS, 389, 629
- Burton et al. (1992) Burton, M. G., Hollenbach, D. J., & Tielens, A. G. G. 1992, ApJ, 399, 563
- Chung et al. (2009) Chung, A., van Gorkom, J. H., Kenney, J. D. P., Crowl, H., & Vollmer, B. 2009, AJ, 138, 1741
- Chung et al. (2007) Chung, A., van Gorkom, J. H., Kenney, J. D. P., & Vollmer, B. 2007, ApJ, 659, L115
- Cortese et al. (2010) Cortese, L., et al. 2010, A&A, 518, L49
- Cortese et al. (2007) —. 2007, MNRAS, 376, 157
- Crowl & Kenney (2006) Crowl, H. H., & Kenney, J. D. P. 2006, ApJ, 649, L75
- Crowl & Kenney (2008) —. 2008, AJ, 136, 1623
- Crowl et al. (2010) Crowl, H. H., Kenney, J. D. P., Chung, A., Blanton, M., & van Gorkom, J. H. 2010, in Astronomical Society of the Pacific Conference Series, Vol. 423, Galaxy Wars: Stellar Populations and Star Formation in Interacting Galaxies, ed. B. Smith, J. Higdon, S. Higdon, & N. Bastian, 97
- Crowl et al. (2005) Crowl, H. H., Kenney, J. D. P., van Gorkom, J. H., & Vollmer, B. 2005, AJ, 130, 65
- Dale et al. (2007) Dale, D. A., et al. 2007, ApJ, 655, 863
- Dale et al. (2009) —. 2009, ApJ, 693, 1821
- de Jong et al. (1985) de Jong, T., Klein, U., Wielebinski, R., & Wunderlich, E. 1985, A&A, 147, L6
- de Vaucouleurs et al. (1991) de Vaucouleurs, G., de Vaucouleurs, A., Corwin, Jr., H. G., Buta, R. J., Paturel, G., & Fouque, P. 1991, Third Reference Catalogue of Bright Galaxies (Springer-Verlag Berlin Heidelberg New York)
- Desert & Dennefeld (1988) Desert, F. X., & Dennefeld, M. 1988, A&A, 206, 227
- Draine (2004) Draine, B. T. 2004, Astrophysics of Dust in Cold Clouds, 213
- Dumas et al. (2011) Dumas, G., Schinnerer, E., Tabatabaei, F. S., Beck, R., Velusamy, T., & Murphy, E. 2011, AJ, 141, 41
- Falgarone et al. (2005) Falgarone, E., Verstraete, L., Pineau Des Forêts, G., & Hily-Blant, P. 2005, A&A, 433, 997
- Forbes & Ward (1993) Forbes, D. A., & Ward, M. J. 1993, ApJ, 416, 150
- Gavazzi & Jaffe (1987) Gavazzi, G., & Jaffe, W. 1987, A&A, 186, L1
- Giard et al. (1994) Giard, M., Bernard, J. P., Lacombe, F., Normand, P., & Rouan, D. 1994, A&A, 291, 239
- Haas et al. (2002) Haas, M., Klaas, U., & Bianchi, S. 2002, A&A, 385, L23
- Helou et al. (2001) Helou, G., Malhotra, S., Hollenbach, D. J., Dale, D. A., & Contursi, A. 2001, ApJ, 548, L73
- Helou et al. (1985) Helou, G., Soifer, B. T., & Rowan-Robinson, M. 1985, ApJ, 298, L7
- Helou (2004) Helou, G. a. 2004, ApJS, 154, 253
- Higdon et al. (2006) Higdon, S. J. U., Armus, L., Higdon, J. L., Soifer, B. T., & Spoon, H. W. W. 2006, ApJ, 648, 323
- Hoernes et al. (1998) Hoernes, P., Berkhuijsen, E. M., & Xu, C. 1998, A&A, 334, 57
- Houck et al. (2004) Houck, J. R., et al. 2004, ApJS, 154, 18
- Hughes et al. (2006) Hughes, A., Wong, T., Ekers, R., Staveley-Smith, L., Filipovic, M., Maddison, S., Fukui, Y., & Mizuno, N. 2006, MNRAS, 370, 363
- Jáchym et al. (2013) Jáchym, P., Kenney, J. D. P., Ržuička, A., Sun, M., Combes, F., & Palouš, J. 2013, A&A, 556, A99
- Kaufman et al. (2006) Kaufman, M. J., Wolfire, M. G., & Hollenbach, D. J. 2006, ApJ, 644, 283
- Kenney et al. (2014) Kenney, J. D. P., Geha, M., Jáchym, P., Crowl, H. H., Dague, W., Chung, A., van Gorkom, J., & Vollmer, B. 2014, ApJ, 780, 119
- Kenney et al. (2004) Kenney, J. D. P., van Gorkom, J. H., & Vollmer, B. 2004, AJ, 127, 3361
- Kennicutt et al. (2003) Kennicutt, Jr., R. C., et al. 2003, PASP, 115, 928
- Koopmann & Kenney (2004) Koopmann, R. A., & Kenney, J. D. P. 2004, ApJ, 613, 866
- Koopmann et al. (2001) Koopmann, R. A., Kenney, J. D. P., & Young, J. 2001, ApJS, 135, 125
- Kormendy & Bender (2012) Kormendy, J., & Bender, R. 2012, ApJS, 198, 2
- Merluzzi et al. (2013) Merluzzi, P., et al. 2013, MNRAS, 429, 1747
- Miller & Owen (2001) Miller, N. A., & Owen, F. N. 2001, AJ, 121, 1903
- Murphy et al. (2006) Murphy, E. J., et al. 2006, ApJ, 651, L111
- Murphy et al. (2008) Murphy, E. J., Helou, G., Kenney, J. D. P., Armus, L., & Braun, R. 2008, ApJ, 678, 828
- Murphy et al. (2009) Murphy, E. J., Kenney, J. D. P., Helou, G., Chung, A., & Howell, J. H. 2009, ApJ, 694, 1435
- O’Halloran et al. (2006) O’Halloran, B., Satyapal, S., & Dudik, R. P. 2006, ApJ, 641, 795
- Pfrommer & Dursi (2010) Pfrommer, C., & Dursi, J. L. 2010, Nat, 6, 520
- Reddy & Yun (2004) Reddy, N. A., & Yun, M. S. 2004, ApJ, 600, 695
- Rigopoulou et al. (2002) Rigopoulou, D., Kunze, D., Lutz, D., Genzel, R., & Moorwood, A. F. M. 2002, A&A, 389, 374
- Roussel et al. (2007) Roussel, H., et al. 2007, ApJ, 669, 959
- Savage & Sembach (1996) Savage, B. D., & Sembach, K. R. 1996, ApJ, 470, 893
- Sivanandam et al. (2010) Sivanandam, S., Rieke, M. J., & Rieke, G. H. 2010, ApJ, 717, 147
- Smith et al. (2007a) Smith, J. D. T., et al. 2007a, PASP, 119, 1133
- Smith et al. (2007b) —. 2007b, ApJ, 656, 770
- Smith et al. (2010) Smith, R. J., et al. 2010, MNRAS, 408, 1417
- Sun et al. (2010) Sun, M., Donahue, M., Roediger, E., Nulsen, P. E. J., Voit, G. M., Sarazin, C., Forman, W., & Jones, C. 2010, ApJ, 708, 946
- Sun et al. (2007) Sun, M., Donahue, M., & Voit, G. M. 2007, ApJ, 671, 190
- Sun et al. (2006) Sun, M., Jones, C., Forman, W., Nulsen, P. E. J., Donahue, M., & Voit, G. M. 2006, ApJ, 637, L81
- Tielens et al. (1999) Tielens, A. G. G. M., Hony, S., van Kerckhoven, C., & Peeters, E. 1999, in ESA Special Publication, Vol. 427, The Universe as Seen by ISO, ed. P. Cox & M. Kessler, 579
- Timmermann (1998) Timmermann, R. 1998, ApJ, 498, 246
- Tonnesen & Bryan (2012) Tonnesen, S., & Bryan, G. L. 2012, MNRAS, 422, 1609
- Tonnesen et al. (2011) Tonnesen, S., Bryan, G. L., & Chen, R. 2011, ApJ, 731, 98
- Voit (1992) Voit, G. M. 1992, MNRAS, 258, 841
- Vollmer et al. (2004) Vollmer, B., Beck, R., Kenney, J. D. P., & van Gorkom, J. H. 2004, AJ, 127, 3375
- Vollmer & Leroy (2011) Vollmer, B., & Leroy, A. K. 2011, AJ, 141, 24
- Vollmer et al. (2007) Vollmer, B., Soida, M., Beck, R., Urbanik, M., Chyży, K. T., Otmianowska-Mazur, K., Kenney, J. D. P., & van Gorkom, J. H. 2007, A&A, 464, L37
- Vollmer et al. (2008) Vollmer, B., Soida, M., Chung, A., van Gorkom, J. H., Otmianowska-Mazur, K., Beck, R., Urbanik, M., & Kenney, J. D. P. 2008, A&A, 483, 89
- Wong & Kenney (2014) Wong, O. I., & Kenney, J. D. P. 2014, in preparation
- Wong et al. (2014) Wong, O. I., Kenney, J. D. P., Howell, J. H., Murphy, E. J., & Helou, G. 2014, in preparation
- Yagi et al. (2010) Yagi, M., et al. 2010, AJ, 140, 1814
- Yun et al. (2001) Yun, M. S., Reddy, N. A., & Condon, J. J. 2001, ApJ, 554, 803