Relaxation after a change in the interface growth dynamics
Abstract
The global effects of sudden changes in the interface growth dynamics are studied using models of the Edwards-Wilkinson (EW) and Kardar-Parisi-Zhang (KPZ) classes during their growth regimes in dimensions and . Scaling arguments and simulation results are combined to predict the relaxation of the difference in the roughness of the perturbed and the unperturbed interfaces, , where is the time of the change and is the observation time after that event. The previous analytical solution for the EW-EW changes is reviewed and numerically discussed in the context of lattice models, with possible decays with and . Assuming the dominant contribution to to be predicted from a time shift in the final growth dynamics, the scaling of KPZ-KPZ changes with and is predicted, where is the growth exponent. Good agreement with simulation results in and is observed. A relation with the relaxation of a local autoresponse function in cannot be discarded, but very different exponents are shown in . We also consider changes between different dynamics, with the KPZ-EW as a special case in which a faster growth, with dynamical exponent , changes to a slower one, with exponent . A scaling approach predicts a crossover time and , with the decay exponent of the EW class. This rules out the simplified time shift hypothesis in dimensions. These results help to understand the remarkable differences in EW smoothing of correlated and uncorrelated surfaces, and the approach may be extended to sudden changes between other growth dynamics.
pacs:
05.40.-a, 81.15.Aa, 64.60.Ht, 68.35.CtI Introduction
The study of kinetic roughening theory and related continuous and atomistic models is motivated by the technological interest in thin films, multilayers and related nanostructures, as well as the theoretical and experimental interest in fluctuating interface problems barabasi ; krug ; etb ; ohring . Some important classes of interface growth are those connected to the Edwards-Wilkinson (EW) equation ew , in which linear interface tension is the dominant relaxation term, and to the Kardar-Parisi-Zhang (KPZ) equation kpz , which includes a nonlinear effect of the local slope. Recent advances in the solution of the KPZ equation sasamoto ; calabrese ; imamura ; healy2012 ; tiago2012 ; healy2013 ; tiago2013 and some experimental realizations takeuchi ; yunker ; renan renewed the interest in those problems.
A relatively small number of works considered thin film and interface growth problems with time-dependent conditions shapir ; foster ; pradas ; anomcompet ; tempvar , although there is a large number of experimental problems with that feature, ranging from fluid imbibition in porous media pradas ; dube ; alava to thin film electrodeposition foster ; PB . Many of those models and experiments show anomalous scaling of the surface roughness ramasco . A more recent application is the deposition of compositionally graded films, in which the flux of different species vary in time zhouASS ; vyas ; zhangASS ; fuentes . This technique may improve film adhesion and reduce internal stress, among other benefits.
Another possibility is a sudden change in the dynamics during the interface growth. For instance, this is the case of a change from sputtering to annealing in a cycle of surface cleaning ohring . Moreover, any change from a surface cleaning process to thin film deposition on that surface may be viewed as a potential application. Since erosion or dissolution are frequently present in those processes, we recall that KPZ scaling was already observed in several etching and dissolution models mello ; passalacqua ; mack ; flavio2013 . On the other hand, KPZ scaling were also observed in films after high temperature annealing, with initial deposition by sputtering kleinke1999 . Thus, the apparently simple situation of a sudden change in the growth dynamics may have a variety of applications that involve KPZ scaling.
The problem of changes in the EW equation in dimension was studied in Ref. chou and further extended to other linear growth equations in all chouJSTAT . Those works showed power-law relaxation of the difference of the square roughness of the perturbed and the unperturbed system, which measures the global response to the perturbation chou ; chouJSTAT . This feature may be important for experimental works in which there is any sudden change in conditions such as temperature, pressure and composition, since a delay in the response to a change may affect the desired film properties. Indeed, the slow relaxation referred above was observed when both the initial and the final EW dynamics were in the growth regime, which corresponds to typical experimental conditions, in contrast to the exponential relaxation observed in steady state (very long time) properties. On the other hand, recent works studied autoresponse functions in KPZ models henkel ; odorcondmat , which measure the average local response to a perturbation and show particular aging properties. This is an additional reason to search for a deeper understanding of the relaxation of global quantities, in particular when KPZ growth is involved.
The aim of this work is to study the effect of sudden changes in the EW and KPZ dynamics, including changes between these different growth classes. The scaling of the global quantity is analyzed, with support from simulation results for a variety of lattice models in and . A previous analytical solution for the EW-EW changes is reviewed and provides the background for a simple scaling approach to the KPZ-KPZ changes, in which the dominant contribution to is predicted from a time shift in the final growth dynamics. The striking difference from local autoresponse functions is clearly shown for KPZ in . For KPZ-EW changes, crossover times significantly exceed the growth time with the initial dynamics, which is an expected general trend when a faster dynamics is changed to a slower one (corresponding to an increase in the dynamic exponent). Moreover, remarkable differences in EW smoothing of correlated and uncorrelated surfaces are discussed.
This paper is organized as follows. In Sec. II, we present basic definitions, the interface equations and the lattice models considered in this work. In Sec. III, we briefly review previous analytical results on changes between initial and final EW growth, define a suitable scaling function and propose an approach to explain the simplest type of relaxation. In Sec. IV, that approach is extended to changes from initial and final KPZ growth. In Sec. V, we introduce a scaling approach for the KPZ-EW changes, which are confirmed by numerical results in and . In Sec. VI, we discuss the smoothing of very rough surfaces by EW dynamics. Sec. VII summarizes our results and conclusions.
II Basic definitions, interface equations, and lattice models
The simplest quantitative characteristic of an interface is its roughness (or interface width). It is usually defined as the rms fluctuation of the height as
| (1) |
where is the lateral size and is the growth time. The overbars in Eq. (1) represent spatial averages and the angular brackets represent configurational averages. The roughness can be calculated from the structure factor
| (2) |
as
| (3) |
where is the Fourier transform of given by ( denotes the position in dimensions and is the wave vector).
In interface growth processes with normal scaling (in opposition to anomalous scaling ramasco ), the roughness follows the Family-Vicsek scaling relation fv
| (4) |
where is the roughness exponent, is a scaling function such that in the regime of roughness saturation () and is the characteristic time of crossover to saturation. scales with the system size as
| (5) |
where is the dynamic exponent. For (but after a possible transient), the roughness scales as
| (6) |
where is the growth exponent. In this growth regime, the structure factor scales as
| (7) |
where is a scaling function.
In this work, our interest is to study the interface evolution in the growth regime, with negligible finite-size effects. The roughness of the interface with a sudden change of dynamics at time is referred as and the roughness of the interface grown with the final dynamics since is referred as . The exact result for EW-EW changes in chou ; chouJSTAT suggests to define a reduced time as
| (8) |
A general scaling form for the roughness difference
| (9) |
between the changed and unchanged systems is
| (10) |
The KPZ equation is
| (11) |
where is the interface height at the position in a -dimensional substrate at time , represents the surface tension, represents the excess velocity and is a Gaussian noise barabasi ; kpz with zero mean and co-variance . The EW equation ew corresponds to the KPZ equation with , while uncorrelated Growth (UG) is obtained for and .
The exact solution of the EW equation gives and for ( in corresponding to logarithmic scaling) ew . In , the KPZ equation has and kpz ; in , the best current numerical results give and marinari ; kpz2d ; Kelling . UG has and no roughness saturation, so that and are not defined.
Many lattice models share the same scaling exponents with EW or KPZ equations and are said to belong to the EW or to the KPZ class. These models are expected to be represented by those equations in the continuous limit (very large sizes, very long times), possibly with additional higher order spatial derivatives that are irrelevant under renormalization barabasi .
In all models studied here, the growth begins with a flat substrate at . Lattice sizes are in and in . One time unit corresponds to deposition trials (deposition of one layer of particles in solid on solid models). Maximal growth times are chosen well below the saturation regime, except if explicitly indicated. Changes take place at time , with varying from to .
The lattice model in the EW class studied here is the Family model family . At each step of this model, a column of the deposit is randomly chosen and the minimum height is searched up to a distance from that column. If no column in that neighborhood has a height smaller than that of the column of incidence, a new particle sticks at the top of this one. Otherwise, it sticks at the top of the column with the smallest height in that neighborhood. If two or more columns have the same minimum height, the sticking position is the one closest to the incidence column and, in the case of a new draw, one of the smallest and closest columns is randomly chosen. The increase of corresponds to an increased interface tension compared to the noise intensity, i. e. an increase of the ratio in the corresponding EW equation. Hereafter, the Family model with searching distance will be referred as F model.
The KPZ models considered here are the restricted solid-on-solid (RSOS) model kk and the etching model of Mello et al mello . The latter is particularly interesting due to the large number of applications of etching processes (by aggressive solutions, sputtering, etc).
In the model kk , the incident particle may stick at the top of the column of incidence if the differences of heights between the incidence column and each of the neighboring columns do not exceed . Otherwise, the aggregation attempt is rejected.
The model for etching of a crystalline solid of Mello et al mello is simulated here in its deposition version, hereafter called ETCH model. At each deposition attempt, the height of the column of incidence is increased by one unit () and any neighboring column whose height is smaller than grows until its height becomes (in the true etching version of this model, the columns’ heights decrease by the same quantities above).
Finally, the UG is simulated with aggregation at the top of the column of incidence, independently of the neighboring heights.
III Changes EW-EW
One-dimensional EW growth with a sudden changes in the interface tension was studied by Chou et al chou . Subsequently, Chou and Pleimling extended that approach to changes in interface tension and noise amplitude in any dimension chouJSTAT . Considering initial dynamics with parameters and the final one with , the difference in the square roughness can be written as chou ; chouJSTAT
| (12) |
with
| (13) |
With this form, . If the initial and the final dynamics are in the growth regime at times and , respectively, then . The lowest nonzero order in the expansion of depends on the type of change: if only is changed (), then it is first order in ; if only changes (), the leading order is the second one. In any case, can be written in terms of the scaling variable [see Eq. 8], which gives (change in ) and (change in ), with in both cases [see Eq. (10)].
In , changing only interface tension leads to and . Numerical results of Chou et al chou gave exponent typically for and , which corresponds to an initial interface tension not much larger than the final one. A limiting case in lattice models is the UG-F1 change, where . Indeed, Fig. 1a shows versus , using the value that provides the best data collapsed for three different value of . It confirms the predicted slope , with some deviations only for large .
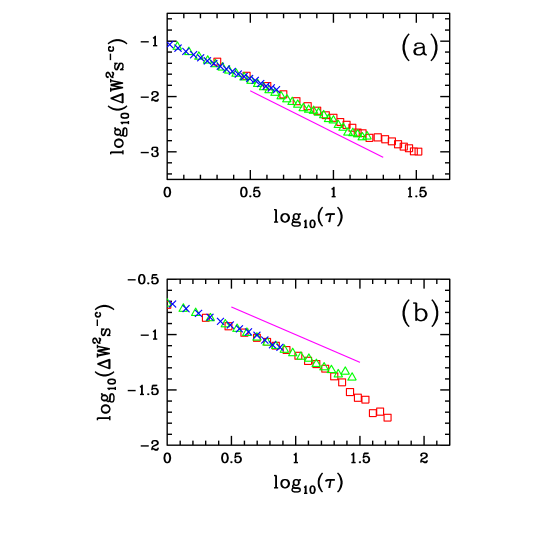
On the other hand, Chou et al chou obtained in a wide region with and , with fixed . This condition typically corresponds to a very large initial interface tension, which produces a smooth surface that rapidly brings the interface to a steady state of very low roughness. In lattice models, this is illustrated by the change F50-F1, which is shown in Fig. 1b. The best data collapse is obtained with and the slope of the plot is close to (some deviations appearring only for at long times, in which the accuracy of is low).
The form of in Eq. (13) helps to understand this result. The first contribution to vanishes in the saturation regime of the F50 model and, consequently, is of first order for small . It gives and , in agreement with the numerical estimates. This is similar to the case of changing the noise amplitude, although in F50-F1 we understand that only a change in interface tension is present.
An equivalent reasoning that leads to a first order dominant term in and its corresponding exponents is to assume that is dominated by a difference of roughnesses of the final dynamics with starting times and . This gives
| (14) |
Since for EW growth ew , we obtain and . This is certainly a good approximation when the roughness at is very small, which is the case of the F50 model. However, it also applies when the initial roughness is not small. In this case, the initial and final dynamics have the same dynamic exponent , thus the initial correlations, created in a time , are changed by the final dynamics in a time of the same order. For this reason, is approximately related to a difference of starting times of order . In this context, the case , can be understood as a particular case in which this first order correction vanishes and a more rapid decay is observed.
IV Changes KPZ-KPZ
The relaxation of in the integrated KPZ equation in was formerly studied by Chou and Pleimling chouJSTAT , who obtained the scaling relation (10) with and . Now, we will show that, interestingly, those results are predicted by the same scaling argument that leads to Eq. (14), now with KPZ exponents. Moreover, our arguments can be extended to , as follows.
For , for KPZ-KPZ changes is written as a difference of roughnesses similarly to Eq. (14). This gives the scaling form (10) with
| (15) |
with exponent defined in Eq. (6).
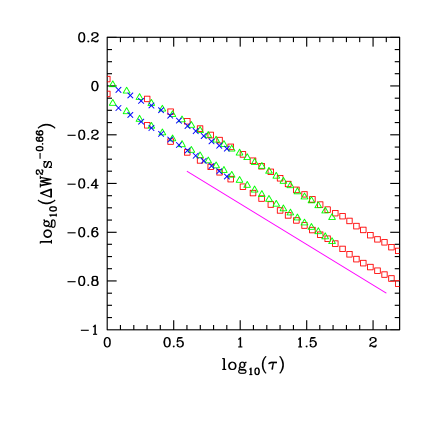
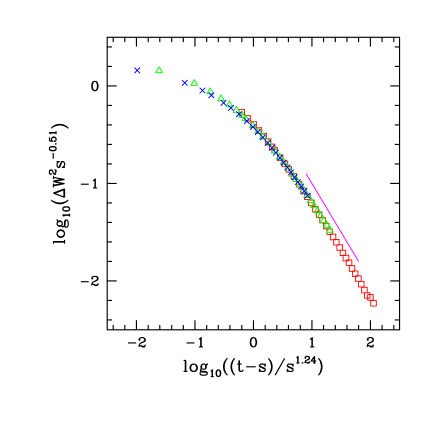
Fig. 2 shows versus for the changes RSOS-ETCH and ETCH-RSOS in , with three different times . The good data collapse and the long time slope near confirms the above assumptions. It also agrees with the numerical results of Ref. chouJSTAT .
The scaling of the difference of the roughness (not squared) can be obtained from Eq. (10) by noting that , with and scaling as Eq. (6) for large . This gives
| (16) |
where exponents in Eq. (15) were used. In , we obtain .
In Ref. henkel , an autoresponse function was defined from the average differences in local heights between two interfaces, A and B, the former growing with a site-dependent rate up to time and, after that, with uniform rate, and the latter growing with site-independent rates from . That function is given by:
| (17) |
where refers to lattice columns and is proportional to the (small) fluctuation in the growth rate at column . Thus, measures the average local response to a small perturbation. Surprisingly, has the same scaling as [Eq. (16)], which is a difference in a global quantity subject to a uniform change in growth parameters.
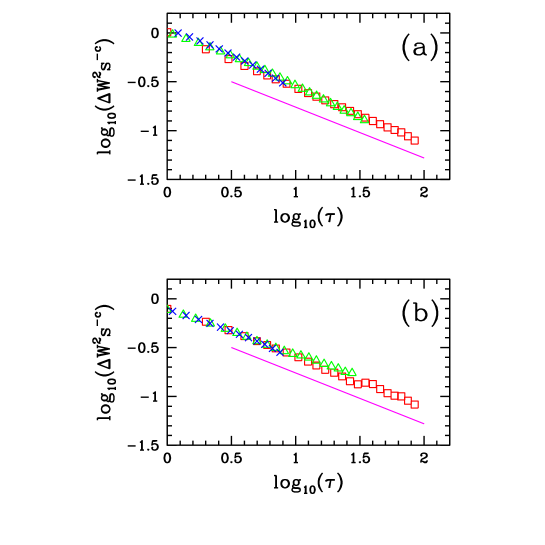
In , we also analyzed the changes ETCH-RSOS and RSOS-ETCH by plotting versus for three times and searching for the values of that provide the best data collapses. The corresponding scaling plots are shown in Figs. 3a and 3b, respectively with and , in good agreement with Eq. (14) that predicts from Kelling . The predicted slope is also shown in Figs. 3a and 3b, confirming the scaling of Eq. (14).
The autoresponse function was recently studied in a KPZ model in by Ódor et al odorcondmat , who obtained and for large . This scaling is completely different from the scaling of and of . This shows the striking differences among the local and global responses in .
The scaling of for the EW-EW changes was based on Eqs. (12) and (13). Thus, the rest of this section is devoted to investigate the consequences of assuming similar relations for KPZ-KPZ changes. However, we stress that the following reasoning is based on speculations on KPZ scaling that cannot be justified by current analytical works on the subject.
Our first step is to replace the scaling of the structure factor in Eq. (12) by that of KPZ, with corresponding exponents and . Secondly, a function is also used to represent the effect of the change of dynamics on the mode . These assumptions give
| (18) |
for KPZ-KPZ changes. This is equivalent to assume that the scaling of is not dominated by coupling of different modes (while in EW scaling there is no mode coupling at all).
Now we also assume that the leading nonzero order of is the first one, i. e. for small . Eq. (18) can be rewritten in terms of the variable and gives the scaling of Eq. (14) with the exponents in Eq. (15). We also note that any other assumption for the leading order of would provide different exponents.
Thus, the assumption of a very simple scaling form for [Eq. (18) with ] leads to the correct exponents for the KPZ-KPZ decay. This is not an actual calculation for KPZ, but may motivate the development of rigorous approaches for the subject.
V Changes to a different growth class
Now we consider a problem not addressed in previous works, which mainly corresponds to turning in or turning off the nonlinearity in EW-KPZ or KPZ-EW changes, respectively.
Since KPZ correlations are spread faster than EW correlations (e. g. and in ew ; kpz ), the correlation length of KPZ growth at is much larger than the correlation length of EW growth. Thus, in a change EW-KPZ, the time necessary for the KPZ growth to supress the initial EW correlations is smaller than . This leads to a crossover scaling similar to the KPZ-KPZ changes discussed in Sec. IV.
On the other hand, if the initial dynamics is KPZ, the time necessary for the correlations at to be replaced by EW correlations will be significantly larger than . A suitable scaling approach has to be developed, along the same lines of related approaches for EW-KPZ crossover of roughness scaling ggg ; nt ; forrest ; tiago1 . Hereafter we refer to the scaling exponents of the initial dynamics with subindex (, , ) and to those of the final dynamics with no subindex, so that the approach may be easily extended to other growth classes.
At time , the correlation length of the KPZ interface is and the square roughness is
| (19) |
For , the final dynamics is so that , given that , which is always the case in KPZ-EW changes. Thus, the change produces a significant decrease in the roughness.
After the change, the correlation length of EW grows as . A crossover from the initial to the final dynamics is expected as , which means that initial KPZ correlations were replaced by EW correlations. The crossover time scales as
| (20) |
and a properly defined crossover variable is
| (21) |
This variable plays the role of the scaled time of Eq. 8. We expect the difference in the square roughness to scale as
| (22) |
where is a scaling function.
At long times (), is expected to decay according to the final EW scaling. This gives
| (24) |
for , as in the case of first order dominant term in [Eq. (13)].
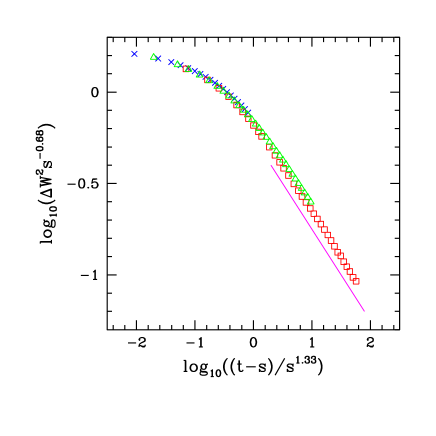
In , using EW and KPZ exponents ew ; kpz , this scaling approach gives , , and . It is confirmed in Fig. 4, in which is plotted as a function of for the change ETCH-F1 at three different times . The value of in Fig. 4 was chosen to provide the best data collapse. Also note the trend of the scaling function to be flat as , as predicted above. The change RSOS-F1 is not analyzed here because the roughness of RSOS for short times is smaller than that of F1, which invalidates the assumptions of the theoretical approach.
In , ew , , and kpz2d ; Kelling give , , and . Fig. 5 shows as a function of for the change ETCH-F1 at three different times , again with the value chosen to provide the best data collapse. The trend of the scaling function to be flat as is also noticeable in Fig. 5. These results are in good agreement with our scaling approach, except for deviations in the estimates of exponent used to get data collapse, which is already expected from the experience with (exactly solved) EW-EW changes (Sec. III).
The hypothesis that is dominated by a difference of roughnesses increasing from zero at times and [equivalent to Eq. (14)] is not obvious in this case, since there may be a significant roughness reduction in the KPZ-EW transition. That hypothesis is
| (25) |
which gives the same decay in Eq. (24). However, it gives in Eq. (22), in contrast to Eq. (23). In , this time shift hypothesis gives the correct value of because the roughness exponents of EW and KPZ are the same. However, in , it gives , in striking disagreement with the previous approach and the numerical data in Fig. 5.
For the time shift hypothesis to be valid, it is necessary that , i.e. the roughness difference has to be smaller than the roughness of the unperturbed growth. For , Eqs. (22), (23), and (24) give , while in and in ew . In , require ; the numerical results in Fig. 4 for are sufficient to satisfy this condition. However, in , that relation requires (for and excluding a logarithmic correction in ); this condition is very far from the limits of the data in Fig. 5 (instead, the data in Fig. 5 typically has ). This explains the failure of the time shift hypothesis for the KPZ-EW change in .
VI EW smoothing of initially rough surfaces
Due to its logarithmic growth in time, the roughness of an EW interface in is very small at all times representative of a thin film growth. This is the case of the maximal times considered in the data shown of Fig. 5. Moreover, until (ten millions of layers), the roughness of the Family model is smaller than two lattice units. For this reason, it is interesting to compare the effects of an EW smoothing of initially rough surfaces, correlated and uncorrelated.
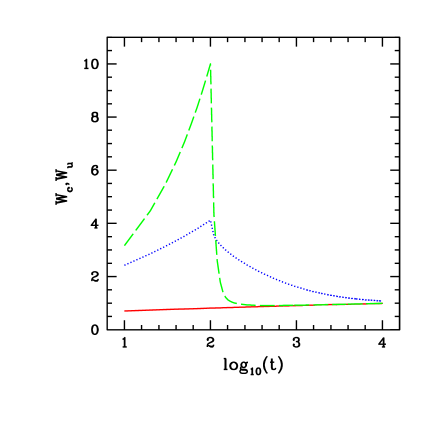
Fig. 6 compares the roughness evolution in UG-F1 and ETCH-F1 changes occurring at . In UG-F1, the initial roughness corresponds to the thickness of layers. It relax to a value near the unperturbed system after the deposition of layers or less. In ETCH-F1, the initial surface is less rough: , which corresponds to less than in a metal or semiconductor surface and possibly some nanometers for larger molecules. However, the roughness relaxes to a value close to the unperturbed value only after the deposition of layers. The predicted relaxation exponent for UG-EW is (second order in ) and the relaxation exponent for KPZ-EW is , which suggest a faster decay of in the former. An additional reason for the delay in the latter is the larger crossover time .
These results may be very important for the growth of thin films in rough substrates, particularly when there is some initial pattern or correlated roughness. An investigation of these features in diffusion dominated growth is certainly desirable.
VII Conclusion
The relaxation of the roughness of an interface after a sudden change in the dynamics involving EW and KPZ growth was studied numerically with lattice models and via scaling arguments. All changes were considered in the growth regimes of those models, so that power law relaxation is observed in the square roughness difference between the changed and the unperturbed systems.
The previous analytical solutions for the EW-EW changes are reviewed and leads to a definition of a function that contains the basic information on the type of change of the parameters of the EW equation. Changes in the noise amplitude, with constant interface tension, give a leading term (first order), while changes only in the interface tension give second order dominant term in . The first scaling is also realized when the initial roughness is very small compared to the unperturbed growth. A hypothesis that is dominated by a time shift of the final dynamics is introduced and matches that scaling.
The general form of in EW-EW changes is extended to KPZ-KPZ changes, which implies the assumption that is not dominated by coupling of different modes. The corresponding function is also assumed to be of first order. The predicted relaxation exponents are in good agreement with simulation results in and . Comparison with the recently calculated aging properties of local response functions show significant differences from the present global response in .
KPZ-EW changes are cases in which a faster dynamics is changed to a slower one, corresponding to an increase in the dynamic exponent. Thus, the time of crossover to the final dynamics is much larger than the time of growth with the initial dynamics. We introduce a scaling approach for the relaxation in those changes, which is also in good agreement with numerical results in and . The hypothesis of dominated by a time shift of the final dynamics fails in due to the very small EW roughness.
We also compared EW smoothing of initially correlated (KPZ) and uncorrelated surfaces to illustrate the much slower relaxation in the former. This may be relevant for thin film growth in rough substrates and may motivate future studies of the same type of sudden change in growth dominated by surface diffusion.
Acknowledgements.
F. Reis acknowledges support from CNPq and FAPERJ (Brazilian agencies).References
- (1)
- (2) A. L. Barabási and H. E. Stanley, Fractal concepts in surface growth, Cambridge University Press, 1995.
- (3) J. Krug, Adv. Phys. 61, 39 (1997).
- (4) J. W. Evans, P. A. Thiel, and M. C. Bartelt, Surf. Sci. Rep. 61, 1 (2006).
- (5) M. Ohring, Materials Science of Thin Films - Deposition and Structure, 2nd. ed., Academic Press, 2001.
- (6) S.F. Edwards and D.R. Wilkinson, Proc. R. Soc. London 381, 17 (1982).
- (7) M. Kardar, G. Parisi and Y.-C. Zhang, Phys. Rev. Lett. 56 889 (1986).
- (8) T. Sasamoto and H. Spohn, Phys. Rev. Lett. 104, 230602 (2010).
- (9) P. Calabrese and P. Le Doussal, Phys. Rev. Lett. 106, 250603 (2011).
- (10) T. Imamura and T. Sasamoto, Phys. Rev. Lett. 108, 190603 (2012).
- (11) T. Halpin-Healy, Phys. Rev. Lett. 109, 170602 (2012).
- (12) T. J. Oliveira, S. C. Ferreira and S. G. Alves, Phys. Rev. E 85, 010601(R) (2012).
- (13) T. Halpin-Healy, Phys. Rev. E 88, 042118 (2013).
- (14) T. J. Oliveira, S. G. Alves and S. C. Ferreira, Phys. Rev. E 87, 040102(R) (2013).
- (15) K. A. Takeuchi, M. Sano, Phys. Rev. Lett. 104, 230601 (2010); K. A. Takeuchi, M. Sano, T. Sasamoto and H. Spohn, Sci. Rep. 1, 34 (2011).
- (16) P. J. Yunker, M. A. Lohr, T. Still, A. Borodin, D. J. Durian, and A. G. Yodh, Phys. Rev. Lett. 110, 035501 (2013).
- (17) R. A. L. Almeida, S. O. Ferreira, T. J. Oliveira, and F. D. A. Aarão Reis, Phys. Rev. B, 89, 045309 (2014).
- (18) Y. Shapir, S. Raychaudhuri, D. G. Foster, and J. Jorne, Phys. Rev. Lett. 84, 3029 (2000).
- (19) D. G. Foster, Y. Shapir, and J. Jorne, J. Electrochem. Soc. 152, C462 (2005).
- (20) M. Pradas, J. M. López, and A. Hernández-Machado, Phys. Rev. E 76, 010102(R) (2007).
- (21) F. D. A. Aarão Reis, Phys. Rev. E 84, 031604 (2011).
- (22) T. A. de Assis and F. D. A. Aarão Reis, J. Stat. Mech. P10008 (2013).
- (23) M. Dubé, M. Rost, K. R. Elder, M. Alava, S. Majaniemi, and T. Ala-Nissila, Phys. Rev. Lett. 83, 1628 (1999).
- (24) M. Alava, M. Dubé, and M. Rost, Adv. Phys. 53, 83 (2004).
- (25) M. F. Alamini, R. C. da Silva, V. C. Zoldan, E. A. Isoppo, U. P. Rodrigues Filho, F. D. A. Aarão Reis, A. N. Klein, and A. A. Pasa, Electrochem. Comm. 13, 1455 (2011).
- (26) J. J. Ramasco, J. M. López, and M. A. Rodríguez, Phys. Rev. Lett. 84, 2199 (2000).
- (27) Q. G. Zhou, X. D. Bai, X. W. Chen, D. Q. Peng, Y. H. Ling, D. R. Wang, Appl. Surf. Sci. 211, 293 (2003).
- (28) A. Vyas, K. Y. Li, and Y. G. Shen, Surf. Coat. Technol. 203, 967 (2009).
- (29) M. Zhang, M.-K. Li, K. H. Kim, and F. Pan, Appl. Surf. Sci. 255, 9200 (2009).
- (30) G. G. Fuentes, M. J. Díaz de Cerio, J. A. García, R. Martínez, R. Bueno, R. J. Rodríguez, M. Rico, F. Montalá, and Y. Qin, Surf. Coat. Technol. 203, 670 (2008).
- (31) B. A. Mello, A. S. Chaves and F. A. Oliveira, Phys. Rev. E 63, 041113 (2001).
- (32) P. Passalacqua, F. Porte-Agel, E. Foufoula-Georgiou, and C. Paola, Water Resources Res. 42, W06D11 (2006).
- (33) C. A. Mack, J. Micro/Nanolith. MEMS MOEMS 9, 041202 (2010).
- (34) F. A. Silveira and F. D. A. Aarão Reis, Electrochim. Acta 111, 1 (2013).
- (35) M. U. Kleinke, J. Davalos, C. Polo da Fonseca and A. Gorenstein, Appl. Phys. Lett. 74, 1683 (1999).
- (36) Y.-L. Chou, M. Pleimling, and R. K. P. Zia, Phys. Rev. E 80, 061602 (2009).
- (37) Y.-L. Chou and M. Pleimling, J. Stat. Mech. P08007 (2010).
- (38) M. Henkel, J. D. Noh, and M. Pleimling, Phys. Rev. E 85, 030102(R) (2012).
- (39) G. Ódor, J. Kelling, and S. Gemming, arXiv:1312.6029v1 (2013).
- (40) F. Family and T. Vicsek, J. Phys. A 18 L75 (1985).
- (41) E. Marinari, A. Pagnani, G. Parisi, J. Phys. A 33, 8181 (2000).
- (42) F. D. A. Aarão Reis, Phys. Rev. E 69, 021610 (2004).
- (43) J. Kelling and G. Ódor, Phys. Rev. E 84, 061150 (2011).
- (44) F. Family, J. Phys. A 19, l441 (1986).
- (45) J. M. Kim and J. M. Kosterlitz, Phys. Rev. Lett. 62, 2289 (1989).
- (46) B. Grossmann, H. Guo, and M. Grant, Phys. Rev. A 43 1727 (1991).
- (47) T. Nattermann and L.-H. Tang, Phys. Rev. A 45 7156 (1992).
- (48) B.M. Forrest and R. Toral, J. Stat. Physics, 70, 703 (1993).
- (49) T. J. Oliveira, K. Dechoum, J. A. Redinz, and F. D. A. Aarão Reis, Phys. Rev. E 74, 011604 (2006).