First results from the CALYPSO IRAM-PdBI survey††thanks: Based on observations carried out with the IRAM Plateau de Bure interferometer. IRAM is supported by INSU/CNRS (France), MPG (Germany), and IGN (Spain)
Abstract
Context. The earliest evolutionary stages of low-mass protostars are characterised by hot and fast jets which remove angular momentum from the circumstellar disk, thus allowing mass accretion onto the central object. However, the launch mechanism is still being debated.
Aims. We would like to exploit high-angular ( 08) resolution and high-sensitivity images to investigate the origin of protostellar jets using typical molecular tracers of shocked regions, such as SiO and SO.
Methods. We mapped the inner 22 of the NGC1333–IRAS2A protostar in SiO(5–4), SO(65–54), and the continuum emission at 1.4 mm using the IRAM Plateau de Bure interferometer in the framework of the CALYPSO IRAM large program.
Results. For the first time, we disentangle the NGC1333–IRAS2A Class 0 object into a proto-binary system revealing two protostars (MM1, MM2) separated by 560 AU, each of them driving their own jet, while past work considered a single protostar with a quadrupolar outflow. We reveal (i) a clumpy, fast (up to – 50 km s-1), and blueshifted jet emerging from the brightest MM1 source, and (ii) a slower redshifted jet, driven by MM2. Silicon monoxide emission is a powerful tracer of high-excitation ( 100 K; 105 cm-3) jets close to the launching region. At the highest velocities, SO appears to mimic SiO tracing the jets, whereas at velocities close to the systemic one, SO is dominated by extended emission, tracing the cavity opened by the jet.
Conclusions. Both jets are intrinsically monopolar, and intermittent in time. The dynamical time of the SiO clumps is 30–90 yr, indicating that one-sided ejections from protostars can take place on these timescales.
Key Words.:
Stars: formation – ISM: jets and outflows – ISM: molecules – ISM: individual objects: NGC1333–IRAS2A1 Introduction
The so-called Class 0 objects represent the earliest low-mass protostellar stage having (i) most of their mass still in the form of dense envelopes, and (ii) a lifetime a few 105 yr (e.g. André et al. 2000; Evans et al. 2009; Maury et al. 2011). Class 0 protostars then represent an ideal laboratory for tracing the pristine conditions of low-mass star formation. Because of the paucity of the sub-arcsec (sub)mm observations required to probe the innermost ( 100 AU) regions, several basic questions remain open, such as the existence of multiple systems, or the launching mechanism of protostellar jets. Protostars drive fast jets surrounded by wide-angle winds that impact the high-density parent cloud generating shock fronts, which trigger endothermic chemical reactions and ice grain mantle sublimation or sputtering. As a consequence, several molecules (such as H2O, CH3OH, and S-bearing species) undergo significant enhancements in their abundances (e.g. van Dishoeck & Blake 1998). A typical example is represented by SiO, whose formation is mainly ( 90%) attributed to the sputtering of Si atoms from refractory core grains in high-velocity ( 20 km s-1) shocks (e.g. Gusdorf et al. 2008ab), or grain shattering in grain-grain collisions inside J-shocks (Guillet et al. 2010). Silicon monoxide traces shocks inside jets well, suffering minimal contamination from low-velocity swept-up material (usually traced by low-J CO emission), and is able to unambiguously probe the mass loss process.
So far, a quite limited number of Class 0 jets has been observed at sub-arcsecond angular resolution (needed to disentangle the jet and the outflow cavities): HH211 (Lee et al. 2007, 2009, 2010), HH212 (Codella et al. 2007, Lee et al. 2008), IRAS04166+2706 (Tafalla et al. 2010), and L1448-C (Maury et al. 2010, Hirano et al. 2010). The IRAM Plateau de Bure interferometer (PdBI) large program CALYPSO111http://irfu.cea.fr/Projects/Calypso (Continuum and Lines from Young ProtoStellar Objects) is correcting this situation by providing the first sub-arcsecond statistical study of inner jet properties in nearby low-luminosity Class 0 sources in combination with studies of the envelopes, disks, and multiplicity structure. One of the best documented CALYPSO targets is NGC1333-IRAS2A (hereafter IRAS2A), located at 235 pc222Recent estimates of the distance to Perseus range from 220 to 350 pc. Here we adopt 235 pc following Hirota et al. (2008). in the Perseus NGC1333 cluster. The source IRAS2A is part of a wider system containing IRAS2B (not investigated here), located at 31. The IRAS2A luminosity is 10 , and it was observed in continuum at cm (e.g. Reipurth et al. 2002), mm (Looney et al. 2000; Jørgensen et al. 2004a, 2007, 2009; Maury et al. 2010), and sub-mm wavelengths (e.g. Sandell & Knee 2001). The outflow activity was traced using single-dish telescopes and interferometers and several tracers of swept-up material (e.g. CO) and shocks (e.g. SiO, CH3OH), revealing two perpendicular outflows, directed NE-SW (PA 25; hereafter called N-S for sake of clarity) and SE-NW (PA 105; hereafter E-W), both originating to within a few arcseconds from IRAS2A (e.g. Bachiller et al. 1998; Knee & Sandell 2000; Jørgensen et al. 2004ab, 2009; Wakelam et al. 2005; Persson et al. 2012; Plunkett et al. 2013). These outflows seem intrinsically different, the E-W outflow being more collimated and chemically richer than the N-S one, supporting the possibility that IRAS2A is an unresolved proto-binary.
2 Observations
The source IRAS2A was observed with the IRAM PdB six-element array in December 2010 and January-February 2011 using both the A and C configurations. The shortest and longest baselines are 19 m and 762 m, respectively, allowing us to recover emission at scales from 8 down to 04 at 1.4 mm. The SiO(5–4) and SO(65–54) lines333Spectroscopic parameters have been extracted from the Jet Propulsion Laboratory molecular database (Pickett et al. 1998). at 217104.98 and 219949.44 MHz, respectively, were observed using the WideX backend to cover a 4 GHz spectral window and to probe continuum emission at a 2 MHz ( 2.6 km s-1 at 1.4 mm) spectral resolution. Calibration was carried out following standard procedures, using GILDAS-CLIC444http://www.iram.fr/IRAMFR/GILDAS. Phase (rms) was 50 and 80 for the A and C tracks, respectively, pwv was 0.5–-1 mm (A) and 1–2 mm (C), and system temperatures were 100–160 K (A) and 150–250 K (C). The final uncertainty on the absolute flux scale is 15%. The typical rms noise in the 2 MHz channels was 3–9 mJy beam-1. Images were produced using robust weighting, and restored with a clean beam of (PA = 33).
3 Results and discussion
3.1 Continuum emission
| Source | a | a | |
|---|---|---|---|
| (03h 28m s) | (+31 14 ) | (mJy beam-1) | |
| MM1 | 55.58 | 37.06 | 94(2) |
| MM2 | 55.71 | 35.33 | 15(1) |
| MM3 | 55.50 | 34.75 | 21(1) |
a The fit uncertainties are 4, 14, and 17 mas for MM1, MM2, and MM3, respectively.
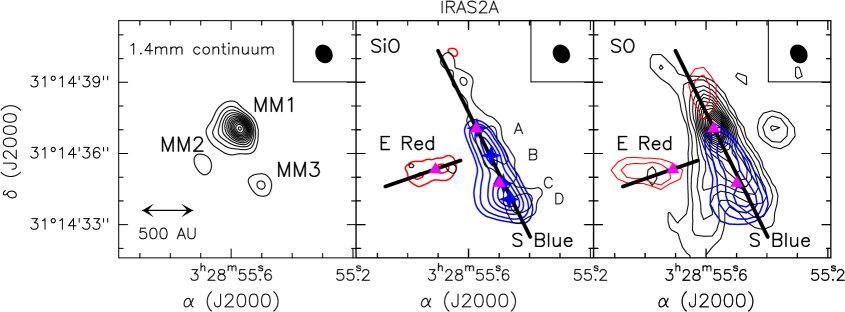
Emission map of the 1.4 mm continuum is shown in Fig. 1. The source IRAS2A is found to be associated with three continuum sources (here labelled MM1, MM2, and MM3). A detailed analysis of the continuum emission is beyond the scope of the present paper: it will be used to support the interpretation of the SiO and SO images. Table 1 summarises positions and 1.4 mm peak fluxes of the three continuum sources. The coordinates of the brightest one (MM1) are consistent with the position of IRAS2A previously measured using the VLA (3.6 cm), SMA (0.8 and 1.3 mm), and BIMA (2.7 mm) telescopes (Rodríguez et al. 1999; Jørgensen et al. 2007; Looney et al. 2007). In addition, a fainter and spatially unresolved source (MM2) is found 24 (560 AU) from MM1 in the SE direction. Both MM1 and MM2 have also been detected at 94 GHz in the framework of CALYPSO (see Appendix A): the spectral index (where flux density ) is 2-2.5, consistent with that of a protostar.
A third source (MM3) is detected 25 south of MM1. Its FWHP size is 307 mas and its non-detection at 94 GHz (with a peak flux 0.1 mJy beam-1 implying 4) challenges a protostellar nature. Alternatively, MM3 might be an outflow feature due to dust heated by shocks travelling along the SiO jet (see Sect. 3.2).
3.2 Different jets from a proto-binary system
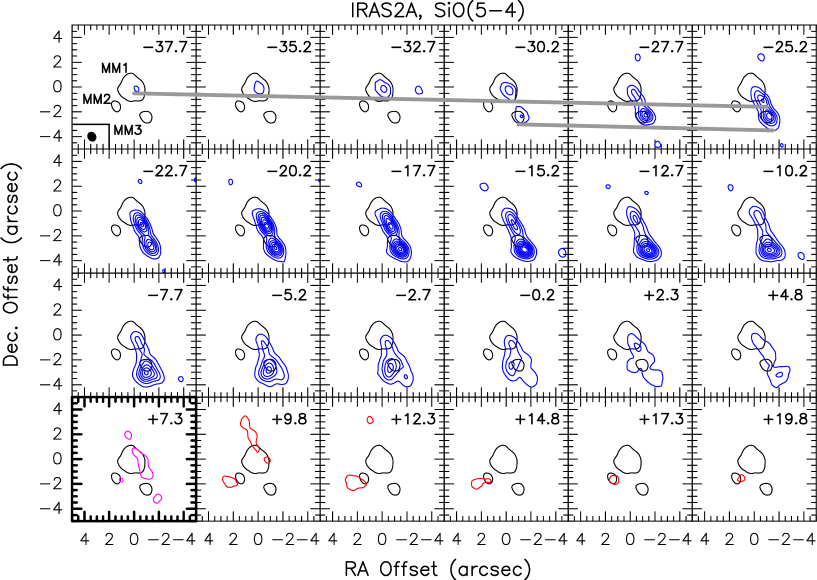
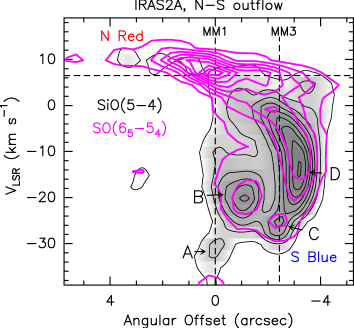
Figure 1 shows that SiO(5–4) emission is mainly confined to a collimated blueshifted southern SiO jet with a PA of 25, emerging from MM1, and extending out to 4 (1000 AU). The SiO jet is narrow: after correction for the PdBI HPBW, the transverse FWHM is 0701 (165 AU) at 700 AU from MM1, while it appears even narrower (being spatially unresolved) close to the driving source. Position-velocity (PV) diagrams along the N-S jet axis (Fig. 2) show that SiO emission extends to very high blueshifted velocities, –50 km s-1 with respect to 555The of IRAS2A as given in the literature lies between +7.0 km s-1 and +7.7 km s-1 (e.g. Persson et al. 2012, and references therein); we adopt +6.5 km s-1, according to CALYPSO measurements of high-excitation ( 200 K) hot-core tracers, Maret et al. (A&A, in press). = +6.5 km s-1.
The MM1 SiO jet is surprisingly asymmetric with a bright (up to 90 K in scale, see e.g. Fig. 3) blueshifted emission and no clear red counterpart (down to 1 K), suggesting a monopolar nature. The presence of monopolar outflows has recently been observed by Fernández-López et al. (2013) towards the complex high-mass star forming region IRAS18162-2048. In that case, the authors propose precession and deflection due to high-density clumps to explain the asymmetric appearance. In principle, asymmetries in ambient gas could affect emission at low velocities (such as swept-up gas, see e.g. Pety et al. 2006), but not the jet emission. As far as we know, this is the first time a SiO monopolar high-velocity jet ejected from a low-mass protostar has been observed. The lack of SiO redshifted emission could be due to the lack of dust if the northern cavity has been completely evacuated by previous ejections. However, the lack the high-velocity redshifted emission in SO (see Sect. 3.3), whose abundance increases due to pure gas phase neutral-neutral reactions, seems to rule out this hypothesis. As a consequence, the bright blueshifted jet from MM1 argues that, intrinsically, one-sided ejections from low-mass protostars can occur, i.e. that one side of the accreting disk is ejecting more material than the other. A N-S outflow on a large scale ( 2) was previously detected with both single-dish antennas and interferometers using CO(1–0) and (2–1) (e.g. Engargiola & Plambeck 1999), showing extended lobes at relatively low velocity (– 10 km s-1). Bipolar non-collimated N-S emission has been also traced on 10–20 angular scales using CS, HCO+, and HCN emission at even lower velocities (– 5 km s-1; Jørgensen et al. 2007, 2009). Maret et al. (2009) observed bipolar H2 emission using the Spitzer telescope. Therefore, the present SiO image reveals for the first time the fast jet sweeping up the slower outflow observed on larger scale. The jet kinematical age, derived from the farthest SiO emission, is 88 years. Given that the jet maps suggest an inclination with respect to the plane of the sky 45, this estimate has to be considered an upper limit666The age should be corrected by a factor of ctg().. In conclusion, given the bipolarity of CO on large scales, the N-S ejection was symmetric in the past, whereas the present SiO image suggests that in the last 90 years only the southern side has been active.
Four distinct clumps (labelled A, B, C, and D), to first-order tracing a sequence of shocks along the jet, are clearly visible at different velocities and different positions along the bright SW blue lobe; their offsets with respect to MM1 are: (–001,+002), (–059,–113), (–086,–231), and (–135,–290), respectively. Clump A, emitting at the highest velocities, is closely associated with MM1, confirming that SiO is a powerful tracer of the jet at the base in Class 0 sources (e.g. Codella et al. 2007). Clump C (peaking at –25 km s-1) is instead associated with the MM3 continuum source; MM3 could be a young stellar object driving the blueshifted SiO emission (between –10 and 0 km s-1, as shown in Fig. 2; see also the channel maps reported in Fig. B.1) which deviates from the N-S main axis, bending towards the east. Alternatively, the continuum source MM3 could trace dust emission from a pre-existing clumpy denser region which, as a side effect, bends part of the blue flow. Finally, the PV diagram of Fig. 2 suggests a jet deceleration. The dynamical time of the SiO clumps is 27–88 yr, and is consistent with that derived for the HH212 SiO jet (25 yr; Cabrit et al. 2007).
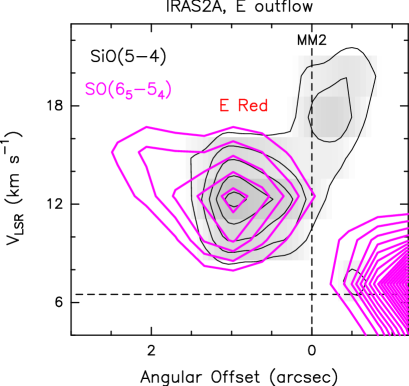
In addition to the N-S jet, the SiO map reveals a redshifted jet (– up to +12 km s-1; see Fig. B.1) with a width similar to the N-S jet (165 AU) and spatially associated with the MM2 continuum source, confirming SiO as a probe of the jet launching region. The jet is monopolar in this case as well and seems to decelerate (see the channel maps and the PV diagrams in Figs. B.1 and B.3). The elongation of the jet is consistent with the PA ( 105) of the E-W outflow, which consists of two highly collimated lobes observed quite far (60–80) from IRAS2A, using typical tracers (such as SiO, SO, SO2, and CH3OH) of shock chemistry (e.g. Bachiller et al. 1998; Wakelam et al. 2005). So far, the driving sources of the two perpendicular E-W and N-S outflows have not been revealed. The present SiO (and continuum) images allow us to resolve for the first time the origin of the IRAS2A quadrupolar outflow, unveiling a Class 0 proto-binary system (MM1 and MM2) driving two different jets.
3.3 The role of SO emission: jets and cavities
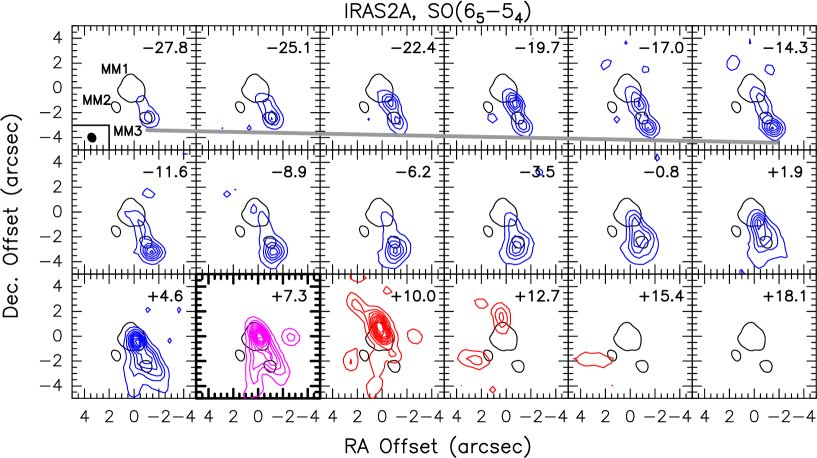
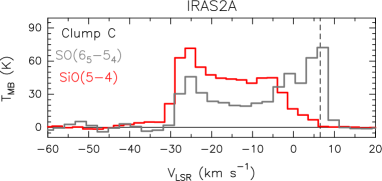
At the highest velocities, the SO distribution, as traced by its (65–54) line (Fig. 1), resembles the SiO(5–4) one, showing a bright S jet driven by MM1, and supporting the association with the SiO jet itself. Figure 3 plots as an example the SiO and SO spectra observed towards clump C, confirming that they are very similar at the highest velocities. These findings (i) are in agreement with the detection of SO at extremely high velocities (– 50 km s-1) using the IRAM 30 m antenna towards the L1448 and IRAS04166+2706 outflows (Tafalla et al. 2010), and (ii) confirm what was found by Lee et al. (2010) for HH211, i.e. that SO can be used as molecular jet tracer in addition to the well-known H2, CO, and SiO (and H2O masers), bringing a new constraint on jet chemical models. Indeed, magnetohydrodynamic (MHD) models show that the SO abundance, quickly formed by the reaction of S with OH, can reach the observed abundance of 2 10-7 in jets (Tafalla et al. 2010) through ambipolar diffusion heating in C-shocks (Pineau Des Forêts et al. 1993) or magneto-centrifugal disk winds (Panoglou et al. 2012).
Close to the systemic velocity, the SiO intensity fades whereas SO increases. This is particularly clear when we compare the profiles observed towards clump C (Fig. 3) and the spatial distributions in Fig. 1: low-velocity (– 4 km s-1) SO bright emission traces extended emission in both the northern and southern lobes (Fig. 2; see also the channel maps of Fig. B.2). In particular, Fig. 1 suggests the association of low-velocity SO with a cavity with MM1 at the vertex. Emission of SO redshifted by 5 km s-1 is also detected towards north in addition to the SiO MM2 jet, but the morphology suggests that this emission is still associated with a cavity rather than the jet. In addition, an SO eastern clump redshifted by 2–3 km s-1 appears along the direction of the E-W jet, and is plausibly related to swept-up material. The low-velocity SiO emission is elongated, but it is definitely weaker and offset to the NW with respect to the blue jet axis, and supports its association with the SO cavity. The weakness of SiO in the cavity should reflect its low formation rate in low-velocity shocks (e.g. Gusdorf et al. 2008ab). Interestingly, the HO emission imaged at PdBI by Persson et al. (2012) and distributed along the direction of the blueshifted outflow, is emitting in the +1,+9 km s-1 range, suggesting that HO also traces the outflow cavities. In summary, the low-velocity emission traces a cavity opened by the fast jet, as predicted by MHD disk wind models (Cabrit et al. 1999).
3.4 High brightness temperatures and excitation conditions
The SiO(5–4) profiles reveal extremely high brightness temperatures of up to 90 K. These values are compared with the result of the RADEX777http://home.strw.leidenuniv.nl/moldata/radex.html non-LTE code (van der Tak et al. 2007) with the rate coefficients for collisions with H2 (Dayou & Balança 2006) using a plane parallel geometry, and assuming a FWHM linewidth of 20 km s-1. One line is obviously not enough for a proper analysis; nevertheless, if we assume 500 K, the high values constrain the total SiO column densities 1015 cm-2. Interestingly, the highest suggests high excitation conditions with 100 K and 105 cm-3, in agreement with the estimates found for SiO clumps associated with other protostellar outflows (e.g. Hirano et al. 2006; Nisini et al. 2007; Cabrit et al. 2007), confirming the association of SiO with shocked material. If we model the 30 K of the high-velocity SO(65–54) emission observed towards clump C using RADEX coupled with the collision rates provided by Green (1994), we find 1016–1017 cm-2 and 105 cm-3, supporting, as for SiO, shocked (compressed) gas.
4 Conclusions
The present continuum, SiO, and SO data allow us to disentangle the origin of the IRAS2A quadrupolar outflow into a proto-binary system powering two different jets. We revealed a clumpy S jet emerging from the brightest MM1 continuum source, plus a redshifted E jet associated with the weaker MM2 source. The jet gas has high-excitation conditions ( 100 K; 105 cm-3). The fast, young ( 90 yr) S jet opened a molecular cavity, efficiently traced by SO at velocity close to systemic (– 4 km s-1). The IRAS2A jets are intrinsically monopolar on scales 1000 AU indicating that one-side ejections from protostars are possible during short periods ( 90 yr).
Acknowledgements.
We are very grateful to all the IRAM staff, whose dedication allowed us to carry out the CALYPSO project. The research leading to these results has received funding from the European Community’s Seventh Framework Programme (FP7/2007-2013/) under grant agreements No 229517 (ESO COFUND) and No 291294 (ORISTARS), and from the French Agence Nationale de la Recherche (ANR), under reference ANR-12-JS05-0005.References
André Ph., Ward-Thompson D., & Barsony M. 2000, Protostars and Planets IV, 59
Bachiller R., Codella C., Colomer F., Liechti S., & Walmsley C.M. 1998, A&A 335, 266
Cabrit S., Ferreira J., & Raga A.C. 2007, A&A 343, L61
Cabrit S., Codella C., Gueth F., et al. 2007, A&A 468, L29
Codella C., Cabrit S., Gueth F., et al. 2007, A&A 462, L53
Dayou F., & Balança C. 2006, A&A 459, 297
Engargiola G., & Plambeck R.L. 1999, The Physiscs and Chemistry of the Interstellar Medium,
Verlag, 291
Evans N.J., Dunham M.M., Jørgensen J.K., et al. 2009, ApJS 181, 321
Fernández-López M., Girart J.M., Curiel S., et al. 2013, ApJ 778, 72
Green S. 1994, ApJ 434, 188
Guillet V., Jones A.P., & Pineau Des Forêts G.
2010, A&A 497, 145
Gusdorf A., Cabrit S., Flower D.R., & Pineau Des Forêts G.
2008a, A&A 482, 809
Gusdorf A., Pineau Des Forêts G., Cabrit S., & Flower D.R.
2008b, A&A 490, 695
Hirano N., Liu S.-Y., Ho P.P.T., et al. 2006, ApJ 636, L141
Hirano N., Ho P.P.T., Liu S.-Y., et al. 2010, ApJ 717, 58
Hirota T., Bushimata T., Choi Y.K., et al. 2008, PASJ 60, 37
Jørgensen J.K., Hogerheijde M.R., van Dishoeck E.F., Blake G.A., & Schöier F.L.
2004a, A&A 413, 993
Jørgensen J.K., Hogerheijde M.R., & Blake G.A. 2004b, A&A 415, 1021
Jørgensen J.K., Bourke T.L., Myers P.C., et al. 2007, ApJ 659, 479
Jørgensen J.K., van Dishoeck E.F., Visser R., et al. 2009, A&A 507, 861
Knee L.B.G., & Sandell G. 2000, A&A 361, 671
Lee C.-F., Ho P.T.P., Hirano N., et al. 2007, ApJ 659, L499
Lee C.-F., Ho P.T.P., Bourke T.L., et al. 2008, ApJ 685, L1026
Lee C.-F., Hirano N., Palau A., et al. 2009, ApJ 699, L1584
Lee C.-F., Hasegawa T.I., Hirano N., et al. 2010, ApJ 713, L731
Looney L.W., Mundy L.G., & Welch W.J 2000, ApJ 529, L477
Maret S., Bergin E.A., Neufeld D.A., et al. 2009, A&A 698, 1244
Maury A.J., André Ph., Hennebelle, P., et al. 2010 A&A 512, 40
Maury A.J., André Ph., Men’shchikov A., Könyves V., & Bontemps S. 2011, A&A 535, 77
Nisini B., Codella C., Giannini T., et al. 2007 A&A 462, 163
Panoglou D., Cabrit S., Pineau Des Forêts G., et al. 2012, A&A 538, A2
Persson M.V, Jørgensen J.K., & van Dishoeck E.F. 2012, A&A 541, A39
Pety J., Gueth F., Guilloteau S., & Dutrey A. 1996, A&A 458, 841
Pickett H.M., Poynter R.L., Cohen E.A., et al. 1998,
J. Quant. Spectrosc. & Rad. Transfer 60, 883
Pineau des Forts G., Roueff E., Shilke P., & Flower D.R. 1993, MNRAS 262, 915
Plunkett A.L., Arce H.G., Corder S.A., et al. 2013, ApJ 774, 22
Reipurth B., Rodríguez L., Anglada G., & Bally J. 2002, AJ 124, 1045
Sandell G., & Knee L.B.G. 2001, ApJ 546, L49
Tafalla M., Santiago-García J., Tafalla M., Johnstone D., & Bachiller R. 2009, A&A 465, 169
Tafalla M., Santiago-García J., Hacar A., & Bachiller R. 2010, A&A 522, 91
van der Tak F.F.S., Black J.H., Schøier F.L., et al. 2007, A&A 468, 627
van Dishoeck E.F., & Blake G.A., 1998, ARA&A 36, 317
Wakelam, V., Ceccarelli C., Castets A., et al. 2005, A&A 437, 149
Appendix A The 3.2 mm continuum emission
Figure A.1 shows the emission map of the 3.2 mm continuum dust emission, which was produced as the 1.4 mm map using robust weighting, and restored with a clean beam of (PA = 38). The 3.2 mm emission allows us to detect the MM1 (: 03h 28m 5556, : +31 14 3693) and MM2 (: 03h 28m 5569, : +31 14 3563) sources, consistent with what was found in the 1.4 mm image (see Table 1 and Fig. 1). The peak fluxes are 17 mJy beam-1 and 2 mJy beam-1 for MM1 and MM2, respectively. On the other hand, MM3 (revealed at 1.4 mm) is not detected at a 3 sensitivity level of 0.75 mJy beam-1.

Appendix B SiO and SO channel maps
We show in Figs. A.1 and A.2 the channel maps of the SiO(5–4) and SO(65–54) blue- and redshifted (continuum subtracted) emissions towards IRAS2A. The images trace the clumps well at different velocities along the N-S jet driven by MM1 and also trace the redshifted E lobe associated with MM2. The grey lines show the deceleration of the highest velocity clumps.
Figure A.3 shows the SiO and SO PV diagrams along the E-W jet axis: as in the N-S case, the SiO emitting at the highest velocities is closely associated with the driving source MM2, confirming that SiO is a powerful tracer of the jet launching region.