Implementation of a Direct-Imaging and FX Correlator for the BEST-2 Array
Abstract
A new digital backend has been developed for the BEST-2 array at Radiotelescopi di Medicina, INAF-IRA, Italy which allows concurrent operation of an FX correlator, and a direct-imaging correlator and beamformer. This backend serves as a platform for testing some of the spatial Fourier transform concepts which have been proposed for use in computing correlations on regularly gridded arrays. While spatial Fourier transform-based beamformers have been implemented previously, this is to our knowledge, the first time a direct-imaging correlator has been deployed on a radio astronomy array. Concurrent observations with the FX and direct-imaging correlator allows for direct comparison between the two architectures. Additionally, we show the potential of the direct-imaging correlator for time-domain astronomy, by passing a subset of beams though a pulsar and transient detection pipeline. These results provide a timely verification for spatial Fourier transform-based instruments that are currently in commissioning. These instruments aim to detect highly-redshifted hydrogen from the Epoch of Reionization and/or to perform widefield surveys for time-domain studies of the radio sky. We experimentally show the direct-imaging correlator architecture to be a viable solution for correlation and beamforming.
keywords:
instrumentation: interferometers — instrumentation: miscellaneous — techniques: interferometric — radio continuum: general1 Introduction
We present a new digital backend designed for the Basic Element for SKA Training II (BEST-2) array at the Radiotelescopi di Medicina, INAF-IRA, Italy. This backend is implemented on Field Programmable Gate Array (FPGA)-based hardware from the Collaboration for Astronomy Signal Processing and Electronics Research (CASPER) 111https://casper.berkeley.edu Parsons et al. (2006). It consists of an FX correlator and a spatial fast Fourier transform (FFT) processor which can be used as a direct-imaging correlator or as a beamformer, supplying high time-resolution data to a pulsar and transient detection pipeline.
Within radio astronomy, sensitivity, field of view, and resolution requirements drive an upwards trend in the size of correlators. In recent years many new arrays (for example: PAPER222http://eor.berkeley.edu, MWA333http://www.mwatelescope.org, LEDA444http://www.21cmcosmology.org, LOFAR555http://www.lofar.org) have been deployed with the goal of detecting highly redshifted hydrogen in the early universe. These low frequency arrays are made up of cross-correlated antenna elements (or beamformed “stations”); their sensitivity is limited by total collecting area of these elements. Increasing the number of antennas per array without a reduction in field of view requires a larger correlator, the cost of which scales as , where is the number of stations/elements. Next-generation telescopes, such as the HERA-II array666http://www.reionization.org, and the Square Kilometre Array (SKA) 777http://www.skatelescope.org will require order of magnitude larger -correlators, and correspondingly the computational requirements of their correlators are significantly higher.
Where arrays have stations which are regularly distributed, direct-imaging correlators can take advantage of array redundancy to reduce correlation cost scaling to . This is achieved by directly producing images of the sky using multi-dimensional spatial FFTs. By zero-padding the spatial FFT inputs, a correlation matrix of all unique samples can be recovered after time integration by applying an inverse Fourier transform to this image. Though the idea of direct image-formation by spatial FFT is not new in astronomy (see, for example Otobe et al. (1994)) retention of all data by prior zero-padding is a relatively recent proposal Tegmark & Zaldarriaga (2009, 2010). The Tegmark & Zaldarriaga (2010) method has been extended, at an increase in computational cost, to accommodate non-regular arrays in Morales (2011) and Bunton (2011). To our knowledge, this BEST-2 backend represents the first deployment of a direct-imaging telescope which implements the design proposed by Tegmark & Zaldarriaga (2009).
For Epoch of Reionization (EoR) power spectrum studies, there are advantages in carefully designed maximally-redundant arrays, as is discussed in Parsons et al. (2012). PAPER, CHIME888http://chime.phas.ubc.ca, and MiTEoR999Zheng et al. (2013) are all regularly-gridded arrays, and regularly-gridded layouts are being considered for the HERA-II array. Nevertheless, it must first be verified that direct-imaging correlators can deliver calibrated science-quality data products.
A challenge of the direct-imaging correlator architecture is that calibration solutions for individual antennas must be applied during the observation; they cannot be applied post-correlation as the spatial FFT effectively averages all redundant baselines together. By developing a direct-imaging correlator, we have explored the calibration challenge in a practical way. We show that with a stable system the direct-imaging correlator, once calibrated, can produce viable images, visibilities, and beams to be used for scientific observation.
The rest of this section provides a review of how the spatial Fourier transform can be used as the basis for the direct-imaging correlator. In addition, we include an overview of the BEST-2 array, which serves as a suitable direct-imaging frontend. Section 2 is a detailed overview of the FPGA-based system on which the BEST-2 backend is implemented. In Section 3, we present the results of initial observations with the backend, including images from both the direct-imaging and FX correlator systems, and a preliminary pulsar observation.
1.1 Correlation using a spatial Fourier transform
An FX correlator computes the Fourier transform of time-domain antenna signals (the F operation) and then forms samples by per-channel, per-sample cross-multiplication of all antenna signal pairs (the X operation). For an antenna array with elements, there are such combinations of antenna pairs, which gives rise to an computational cost of FX correlators.
The formation of samples by cross-multiplication is equivalent to a spatial autocorrelation of channelized antenna signals. This can be implemented by performing a per-channel, per-sample spatial Fourier transform on the channelized signals from the antennas in an array, then taking the element-wise power of the result, and finally inverse Fourier transforming the result (after averaging over time) to recover the cross-power spectrum. The direct-imaging correlator is a correlator that performs precisely these steps, and is so named because, prior to the final inverse Fourier transform, the intermediate data product is an image of the sky. In this sense, a direct-imaging correlator is not really a correlator at all, but rather a beamformer capable of forming enough beams simultaneously to obtain a complete image of the sky.
In general, the largest number of independent measurements which can be made by an array of elements is of order . The direct imaging correlator provides an opportunity to perform these measurements by forming an equivalent number of beams on the sky rather than computing correlations directly.
When receiving elements in an antenna array are placed on a regularly spaced grid, only independent measurements are obtained, since many of the two-element interferometers in the array are redundant. It is thus possible to encapsulate all of these measurements in beams. These could be formed by simple discrete Fourier transform and power-detection, which has a computational cost of operations per beam. However, a well-known method for producing a complete set of orthogonal beams on the sky from regularly spaced antennas is by spatial FFT beamforming Williams (1968). Such a beamforming implementation is able to generate beams on the sky, at a computational cost of . For large- arrays, this can be a significant computational saving compared to imaging by FX correlation which requires operations to compute all pairwise antenna correlations.
Essentially the only difference between the imaging methods outlined by Tegmark & Zaldarriaga (2009) and the FFT beamforming of Williams (1968) is that the former requires zero padding to be applied to the matrix of antenna signals before the spatial FFT is performed. In a physical sense, this ensures that enough (real-valued) beam powers are measured to encode all the (complex-valued) -plane information which would be measured by a correlator. The zero-padding required results in the generation of beams on the sky where is the number of dimensions in the antenna array. In the BEST-2 case .
It is worth reiterating what a measurement represents in terms of the direct-imaging correlator. Instead of making individual measurements of redundant two-element interferometers in an array (as in an FX correlator) the direct-imaging correlator computes an “effective” visibility which is the average of the visibilities in a redundant set of interferometers. But, for the average visibility to effectively represent the sky mode being measured, each redundant baseline measurement must be identical. Thus, calibration to the complex gains must be applied before the direct-imaging operation. Further calibration can be applied after imaging, but comes with the penalty of reduced signal to noise. We will consider what implications this has on observations in a future work comparing the FX and direct-imaging correlators.
1.2 BEST-2 Array
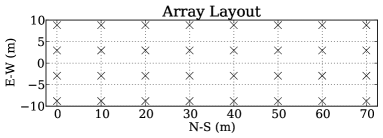
The BEST-2 array consists of 8 East-West oriented cylindrical concentrators, each with 64 dipole receivers critically sampling a focal line at 408 MHz. Signals from these 64 dipoles are analogue beamformed in groups of 16, resulting in 4 receiver channels per cylinder, and a total of 32 effective receiving elements laid out on a grid, depicted in Figure 1. The cylinders, which lie on an east-west axis, can be rotated to point at a constant declination within the array pointing limits. A synopsis of the BEST-2 array specifications is presented in Table 1. BEST-2 was developed as a reliable, low cost analogue front end to be used in SKA development, with a core design requirement of simplicity in interfacing with different digital backends Montebugnoli et al. (2009b). Extensive documentation of the development of the BEST-2 analogue chain can be found in several earlier publications (Perini (2009); Perini et al. (2009)).
| BEST-2 Array Specifications | |
|---|---|
| Total Number of receivers | 32 |
| Total Collecting Area | |
| Longest Baseline (E-W) | 17.04 m |
| Longest Baseline (N-S) | 70.00 m |
| Central Frequency | 408 MHz |
| Analogue Bandwidth | 16 MHz |
| Primary Beam Area | 58.6 |
| North-South | 6.86∘ |
| East-West | 8.77∘ |
| Zenith-Pointing PSF Area | |
| North-South | 16’ |
| East-West | 75’ |
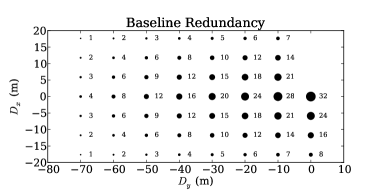
The gridded layout of the array is a key requirement of the direct-imaging correlator architecture. This grid structure leads to a highly redundant array, Figure 1, where there are unique baselines. A direct-imaging correlator architecture produces all the unique baselines where any ‘effective baseline’ is the average of all the redundant baselines for that baseline length and projection. The gridded layout also produces regular uv coverage, Figure 1, of a field which leads to strong sidelobe in the Point Spread Function (PSF) which can be seen in the images.
2 FPGA Instrumentation
The new FPGA-based instrumentation we have developed has replaced the previous generation FX correlator system which used CASPER iBOB and BEE2 boards, Montebugnoli et al. (2009a). The new instruments have been implemented on FPGA-based ROACH boards also developed by CASPER. The ROACH platform is based on a XILINX Virtex 5 SX95T FPGA with interfaces to DRAM and QDR memory, high speed CX-4 connectors, and a generic Z-DOK interface for connecting ADCs and various other daughter boards. Digital Signal Processing (DSP) components of the firmware were developed using MATLAB Simulink, the CASPER DSP libraries, and custom Hardware Description Language (HDL) code. Firmware models, bitstreams, and control software are available from our project repository101010https://github.com/griffinfoster/medicina.
The instrument is made up of three interconnected ROACH boards. These will be referred to as the F-Engine, S-Engine, and X-Engine for their respective functions. Signal digitization and frequency channelization is performed on the F-Engine. Duplicate streams are sent to the X-Engine for cross-correlation, and to the S-Engine where a spatial Fourier transform is performed. Table 2 lists the digital specifications of the implemented FPGA hardware. Block diagrams of the firmware for each board are included in a supplemental online appendix.
| Digital Hardware Specifications | |
|---|---|
| Digital Bandwidth | 20 MHz |
| ADC Sampling | 12-bit |
| PFB-FIR | 4-tap Hann Window |
| PFB-FFT | 2048 radix-2 |
| Freq. Channel Width | kHz |
| Quantization | 4-bit complex |
| X-Engine | |
| Auto Correlations | 32 |
| Cross Correlations | 496 |
| min | ms |
| S-Engine | |
| 2-D FFT | |
| Selectable Beams | 128 |
| Unique Baselines | 53 |
| min | 1 s |
2.1 F-Engine
Both correlators use the same digitization and channelization frontend. The F-Engine processing node is responsible for digitization, channelization, and transmission of quantized antenna signals to downstream processing boards. Duplicate streams are sent from the F-Engine to the S-Engine and X-Engine so that the correlators may be used concurrently. This allows for a streamlined process for calibrating the direct-imaging correlator data and simultaneous observation with both correlators, and reduces the amount of hardware.
2.1.1 Digitization
In the analogue chain the Radio Frequency (RF) signal, centered at 408 MHz, is mixed down with an 378 MHz Local Oscillator (LO) to an Intermediate Frequency (IF) of 30 MHz. Prior to digitization the last amplifier stage of the analogue chain has per-signal channel adjustable gain useful for setting levels for optimum Analogue to Digital Converter (ADC) quantization. Signal digitization is performed using the CASPER 64ADCx64-12111111https://casper.berkeley.edu/wiki/64ADCx64-12 ADC board which makes use of the Texas Instruments ADS5272 8-channel, 12-bit ADC chip. In the case of the 64ADCx64-12, eight ADS5272 ADC chips are used to digitize 64 analogue inputs at up to 50 Msps. The 64ADCx64-12 board interfaces with the ROACH over 64 Low-Voltage Differential Signal (LVDS) pairs via Z-DOK. In our design 32 signal streams are digitized at 40 Msps for 20 MHz of digital bandwidth which covers the 16 MHz analogue band.
2.1.2 Channelization
In order to facilitate the correlation and imaging processing described in Section 1.1, antenna signals must be split into multiple frequency channels. These channels should have narrow enough bandwidth that they can be treated as monochromatic. This leads to the requirement that the relative arrival time of radiation at different antennas in the array should be much shorter than the inverse bandwidth of each channel. In the most stringent case of radiation arriving from the horizon we require
| (1) |
where is the bandwidth of a frequency channel, is the largest dimension of the array, and is the speed of light. For the BEST-2 array, m which with sets a minimum channel bandwidth of approximately 400 kHz.
The strong Radio Frequency Interference (RFI) environment at the observatory sets a more restrictive demand for narrow channel widths and high out of band rejection that is achieved by use of a Polyphase Filterbank (PFB). Our digitized band is channelized using a critically-sampled 4-tap Hann filter, 2048-point PFB (using 18-bit coefficients) to produce 1024 complex samples per real antenna stream covering the range 398–418 MHz. Individual channel resolution is kHz. Since the Reconfigurable Open Architecture Computing Hardware (ROACH-I) board is clocked at 160 MHz; four times the ADC sample rate, such that four signals are time-division multiplexed onto a single signal path.
2.1.3 Equalization and Quantization
After channelization the samples are requantized to 4-bit complex values. This limits the F-Engine output data rate to 5.12 Gbps. See Section 8.3 of Thompson et al. (2004) for details on the effect of quantization noise in a 4-bit system.
The characteristics of a telescope analogue front-end mean that a compensation of the instrumental bandpass must be applied to data to ensure optimal quantization of all subbands. In the BEST-2 backend, this equalization is achieved by pre-multiplying the 18-bit data streams by a set of 18-bit coefficients, with 512 independent coefficients available to represent the bandpass of each analogue channel. During observations, an automated script samples the pre-quantized signals and statistically determines the correct equalization coefficients to achieve optimal 4-bit quantization. This script can be run at a user selected cadence during observations.
The per-channel equalizers are also used to apply pre-derived amplitude and phase corrections to the signals before the 2-D FFT. These values can by dynamically set during observations to account for changes in the system calibration. Duplicate streams, though with different ordering, are sent over XAUI at a rate of 5.12 Gbps to the X-Engine and S-Engine nodes.
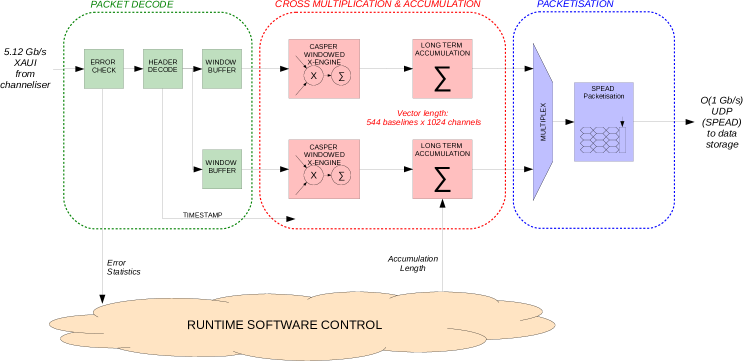
2.2 X-Engine
An FX correlator architecture is a standard design for large bandwidth, many antenna arrays. An overview of the architecture is presented in Romney (1999). The core component to the X stage of the FX correlator is the Complex Multiply and Accumulate (CMAC) of all pairs of independent signals for each frequency channel. A pipelined X-Engine, based on the general CASPER block Urry et al. (2007), is used for optimal multiplier efficiency.
The correlation is performed on a per channel basis, thus the channelized band can be split up into portions and processed in parallel across multiple X-Engines. This allows a larger bandwidth to be processed at the cost of increased logic and multiplier resource utilization. In the case of the BEST-2 system two pipelined X-Engines, each processing 512 channels, are implemented in the firmware.
A two-stage accumulator is used to reduce the output data rate. The first stage is fixed to give a minimum integration time to 6.55 ms; this assures that the output bandwidth to each X-Engine is approximately equal to the input bandwidth. The second accumulator, implemented using QDR, is software-controlled with integration lengths up to many minutes. A completed correlation matrix is sent to a receive computer over a 10 Gigabit Ethernet (10 GbE) connection. Correlation matrices are packetized as User Datagram Protocol (UDP) streams using the SPEAD protocol121212https://github.com/ska-sa/PySPEAD .
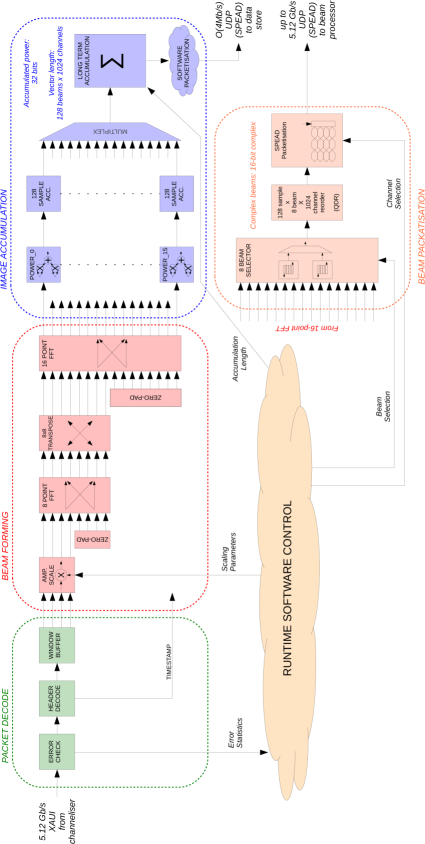
2.3 S-Engine
In the BEST-2 backend described here, the requirements on the direct-imaging correlator are multi-fold. The system should be capable of generating images on order second timescales, by the method described by Tegmark & Zaldarriaga (2009). Further, the system should be capable of passing formed beams at full bandwidth, i.e. without any accumulation, to downstream time-domain processing systems such as a real-time pulsar dedispersion engine, Magro et al. (2011).
Using a single frequency channel from each antenna element and the geometric array layout a two-dimensional FFT is performed to produce an image. The two-dimensional 8-by-16 FFT is performed using an 8-point parallel input FFT followed by a corner-turn and 16-point parallel input FFT. Zero padding is added to the signals from the antenna BEST-2 array before input into each stage of the transform. This yields an output of 128 complex-valued beams, from which the power is calculated and accumulated. Each channel is cycled over to produce an image for each frequency band. The four-fold increase is the number of outputs from the spatial transform by zero padding introduces a number of redundant calculations. The spatial transform produces 128 outputs but, as shown in Figure 1, there are only 53 unique baselines in a grid.
Accumulation takes place in two-stages. A fixed 128-sample vector accumulator reduces the output of the FFT by summing 128 consecutive time samples of each beam for a single frequency channel. The complete set of 1024 channels and 128 beam powers can then be multiplexed into a single software-controllable vector accumulator in off-chip memory. Accumulations are packetized by the ROACH’s PowerPC co-processor and sent to a data recorder over 1 GbE link using the same protocol as the FX correlator.
2.3.1 Beamformer
A total of 128 beams are generated with the spatial Fourier transform. Before calculating beam powers, 8 arbitrary beams can be selected and output over 10 GbE at 16-bit precision for time-domain processing. Packets are constructed from multiple time and frequency samples from individual beams such that processing can be parellelized by beam across multiple machines. For a data word size in bytes, a packet containing samples and channels has payload size bytes. In the BEST-2 backend, , and is chosen to conveniently match the accumulation length of the imager. is chosen to achieve packets with payloads of 4096 kB. These are generated with a simple data transpose in QDR memory space, and headers are inserted before transmission over 10 GbE. A pulsar and transient searching system for this output has been developed on Graphics Processing Units (GPUs) by Magro et al. (2013).
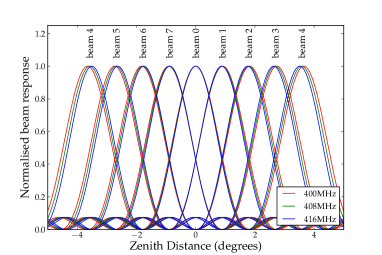
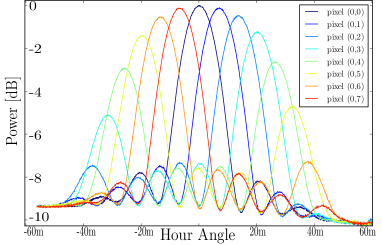
Whilst the electric-field beams generated by spatial Fourier transform are suited to “drift-scan” observations, software has been provided to switch beams to “psuedo-track” up to 8 simultaneous targets as they transit the primary beam. In this mode of operation, software will dynamically configure the S-Engine node outputs to transmit the nearest beam to a target source. This tracking method has the drawback that sources appearing between beam centers can not be observed with the full sensitivity of the array. Figure 2 shows the response of the 7 synthesized beams covering a right-ascension range of . Since neighbouring beams overlap at of peak power, signal-to-noise is reduced when tracking objects lie between pointing directions. Additionally, the beam centers vary with frequency. Since the fractional bandwidth of the BEST-2 analogue frontend is relatively small, this effect is limited, especially around the pointing centre of the telescope. The beams around the pointing-centre are also preferred as they suffer least from spatial aliasing and primary beam gain attenuation.
3 Initial Observations
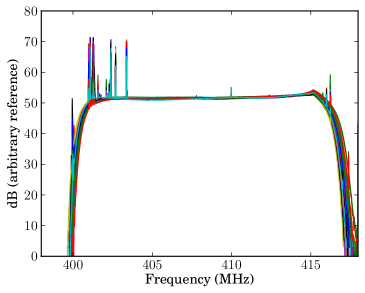
Instrumentation was installed and tested in March 2012. Initial tests verified the F-Engine firmware during observations. Figure 3 shows the autocorrelation spectra of the 32 receivers of the BEST-2 system after (Figure 3) quantization equalization is applied to account for gain differences and band slope.
After installation, the FX correlator was used for observations of various bright radio sources. Since the Northern Cross is a transiting array, with primary beam pointing adjustable in declination, there is a limited period of time each day in which a source is in the primary beam. Bright sources such as Cygnus A, Cassiopeia A, Taurus A, and a number of 3C sources were observed. Additionally, observations of multiple constant declination 24-hour cycles were made.
In concurrency with the FX correlator observations, the direct-imaging correlator recorded data, initially in a “raw” mode where no pre-calibration was applied and then in normal observational mode with complex gains solutions from the FX correlator applied in real-time.
3.1 FX Imaging
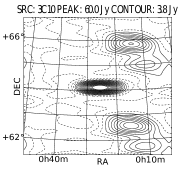
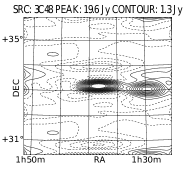
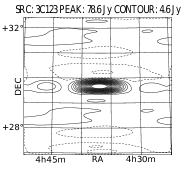
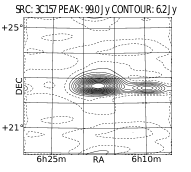
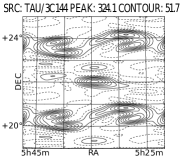
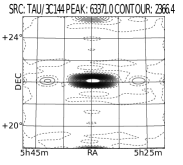
A transiting array provides a unique challenge of gain calibration since a source’s apparent gain will change as it transits the primary beam. To account for this variation, a two stage gain calibration method is used. Phase calibration and setting the flux scale is accomplished using Cassiopeia A and Cygnus A observations as point source sky models set to their Baars et al. (1977) flux levels and known spectral indices. Since these sources are very bright, only a few seconds at transit is needed produce a high Signal to Noise Ratio (SNR) dataset to use for calibration. Over this period the primary beam can be approximated as flat. A time-independent complex gain is derived for an initial calibration. After applying the gain corrections an observation will be set to a flux scale relative to the flux of the calibration source. Each individual source is then calibrated in MeqTrees Noordam & Smirnov (2010) based on a local sky model taken from the 3C catalog. A selection of images using this calibration method are shown in Figure 4. An effect of the density of the antenna layout is a low field of view to PSF size ratio, in the north-south direction and in the east-west direction, thus images tend to contain at most a few spatially separated point sources.
3.2 Direct Imaging
The native output of the direct-imaging correlator is a 128 pixel image-domain dataset where each pixel is a unique beam within the field of view. These 128 beams can be Fourier transformed to obtain samples in the uv domain. This produces summed visibilities corresponding to each of the 53 unique baselines, where each visibility is the average of all redundant baselines with a particular spacing. By transforming to the uv domain we can compare the direct-imaging correlator data quality to that of our standard FX correlator.
3.2.1 Complex Gain Calibration
For our initial deployment the FX correlator was used to derive complex gain solutions which were then applied in to the direct-imaging correlator in realtime during subsequent observations. Whilst the BEST-2 direct imaging test-bed system utilizes the full correlator provided by the backend, it should be noted that an FX correlator which computes the full correlation matrix is not required for deriving gain calibrations. In order to make the direct imaging architecture computationally beneficial, a smaller correlator, such as the calibration correlator included in LOFAR station firmware, or an offline correlator should be implemented.
In order to combine baseline data in a way that preserves signal-to-noise, a key requirement of the BEST-2 direct-imaging system is the prior knowledge of gain corruptions in the receiving chains of each of the 32 receiving elements. Given the regular layout of antennas in this array, redundant baseline calibration strategies such as those described by Noorishad et al. (2012) are applicable. However, we opt for a general sky-model based algorithm which assumes prior knowledge of the sky observed by the telescope, but does not impose the condition that redundant baselines behave identically. This strategy is chosen for a number of reasons. The strong sidelobes of BEST-2 primary beams, which are not identical even amongst redundant baselines, make calibration challenging when there are bright sources away from the phase-center of the array. In such a situation, the assumption of redundant baselines breaks down and redundant-baseline calibration methods are likely to prove ineffective. Even without requiring baseline redundancy, varying sidelobe gains across the array makes for challenging calibration as gain corruptions are strongly direction dependent. To avoid this pitfall, the simplest calibration method is to wait for a transit of a bright source. In this case, the model sky is trivially a point source at the array phase center from which gain solutions can be very easily extracted.
We use the column ratio gain estimation method, described by Boonstra & Veen (2001). Chosen for simplicity and ease of implementation, the algorithm uses ratios of antenna cross-correlations to estimate the diagonal (auto-correlation) elements of a measured visibility matrix in the absence of a system noise contribution. This allows creation of a modified correlation matrix and can subsequently be used, under the assumption of a model sky consisting of a point source at phase center, to obtain per-antenna gain solutions.
By applying gain solutions in the F-Engine during observations there is a drastic change in image quality as seen in Figure 5. An otherwise distorted image of the Taurus A field becomes a bright point source. The images in Figure 5 have been obtained by first Fourier transforming the direct-imaging outputs into the uv domain where they, and the equivalent FX correlator outputs, are imaged using traditional synthesis imaging software.
During the imaging process, the choice of weighting schemes introduces a small technical hurdle for direct-imaging correlator visibilities. Since the effective baselines are an averaging of redundant baselines, using natural or uniform weighting in traditional imaging will produce equivalent results, that is a uniform-weighted image, with direct-imaging correlator visibilities. In order to obtain the equivalent of a natural-weighted FX correlator image, the visibilities obtained by the direct-imaging correlator are given weights based on their redundancies. In Figure 5 we have used a natural-weighted scheme.
3.2.2 System Stability
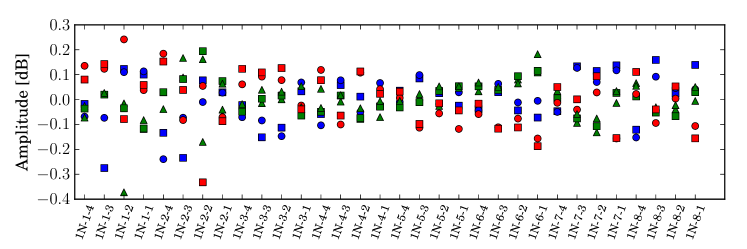
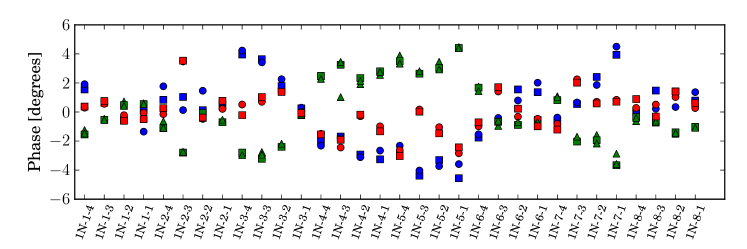
Since we have implemented a calibration method which uses a single bright point source as our sky model we need to consider the timescale on which the gain solutions are accurate. Due to the transiting nature of BEST-2 we are limited to only a few calibration opportunities per day, thus the calibration solutions need to be stable on at least multi-hour timescales. Figure 6 shows the amplitude and phase solutions from 7 point source calibrations taken over a two week period for each of the receiving elements. Over that period the amplitude and phase remain stable. Calibration gains applied on day timescales has proven sufficient during our initial observations.
3.3 Spatial FFT for Beamforming
With the ability to calibrate antenna gains in real-time in place, the unaccumulated outputs of the 2-D FFT are calibrated electric-field beams on the sky. These beams remain fixed in position relative to the array location. Figure 7 shows the apparent flux of Cassiopeia A as it transits across the array. Significant spatial aliasing effects are visible for all off-center beams, becoming more severe for beams further from the array phase centre. This is a result of the hierarchical, analogue beamformer used in BEST-2, the first layer of which is the summation of 16 critically spaced dipoles. Figure 7 also shows the loss of signal as the source moves between beams.
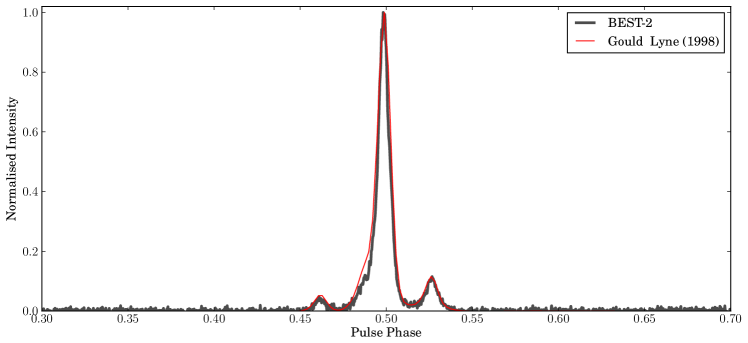
As noted earlier, this beamforming mode has already been put to use as the input to a pulsar and transient detection system Magro et al. (2013). This system was verified by detection of pulsar B0329+54. After compensating for the DM of the pulsar, multiple pulses are summed to obtain a profile of the average pulse shape. Figure 8 shows a profile of the average pulse shape with a profile from 408 MHz Lovell Telescope archival data Gould & Lyne (1998) overlaid. With access to a complete set of beams which cover the field of view this system provides a promising platform for transient monitoring.
4 Conclusion
The main focus of this work has been on presenting a new digital backend for BEST-2 and showing the currently available features in the design. We have developed, deployed, and tested an FPGA-based direct-imaging correlator and beamformer along with an concurrent FX correlator system for the BEST-2 array. Additionally, we have developed the necessary software for general use of this instrument, it is currently in regular use at the observatory. We have also touched on the data quality produced by the FX and direct-imaging correlators, and the beamformer. We have demonstrated detection of various astronomical source with each of these instruments. In a supplementary work we will present a study on the comparison of the FX and direct-imaging correlators. That work will focus on the usability of the direct-imager for science observations, along with the challenge of calibrating such an instrument.
Acknowledgements
We would like to thank the staff and support from Radiotelescopi di Medicina whom made this project possible, particularly Andrea Mattana, Frederico Perini, Germano Bianchi, Giovanni Naldi, Jader Monari, Marco Bartolini, Marco Schiaffino, and Stelio Montebugnoli. Also, thank you to Ian Heywood for calibration and imaging help and advice.
References
- Baars et al. (1977) Baars J. W. M., Genzel R., Pauliny-Toth I. I. K., Witzel A., 1977, Astronomy & Astrophysics, 61, 99
- Boonstra & Veen (2001) Boonstra A. J., Veen A. J. V. D., 2001, in IEEE Workshop on Statistical Signal Processing (SSP), IEEE
- Bunton (2011) Bunton J., 2011, Antennas and Propagation, IEEE Transactions on, 59, 2041
- Gould & Lyne (1998) Gould D. M., Lyne A. G., 1998, Monthly Notices of the Royal Astronomical Society, 301, 235
- Magro et al. (2013) Magro A., Hickish J., Adami K. Z., 2013, Journal of Astronomical Instrumentation, 2, 50008
- Magro et al. (2011) Magro A., Karastergiou A., Salvini S., Mort B., Dulwich F., Zarb Adami K., 2011, MNRAS, 417, 2642
- Montebugnoli et al. (2009a) Montebugnoli S., Bartolini M., Bianchi G., Naldi G., Manley J., Parsons A., 2009a, in Proceedings of Wide Field Astronomy & Technology for the Square Kilometre Array (SKADS 2009). 4-6 November 2009. Chateau de Limelette, Belgium, pp. 355–358
- Montebugnoli et al. (2009b) Montebugnoli S., Bianchi G., Monari J., Naldi G., Perini F., Schiaffino M., 2009b, in Proceedings of Wide Field Astronomy & Technology for the Square Kilometre Array (SKADS 2009). 4-6 November 2009. Chateau de Limelette, Belgium, pp. 331–336
- Morales (2011) Morales M. F., 2011, PASP, 123, 1265
- Noordam & Smirnov (2010) Noordam J. E., Smirnov O. M., 2010, A&A, 524, A61
- Noorishad et al. (2012) Noorishad P., Wijnholds S. J., van Ardenne A., van der Hulst T., 2012, Astronomy & Astrophysics, 16
- Otobe et al. (1994) Otobe E. et al., 1994, Publications of the Astronomical Society of Japan, 46, 503
- Parsons et al. (2006) Parsons A. et al., 2006, in Asilomar Conference on Signals and Systems, Pacific Grove, CA, pp. 2031–2035
- Parsons et al. (2012) Parsons A., Pober J., McQuinn M., Jacobs D., Aguirre J., 2012, The Astrophysical Journal, 753, 81
- Perini (2009) Perini F., 2009, in Proceedings of Wide Field Astronomy & Technology for the Square Kilometre Array (SKADS 2009). 4-6 November 2009. Chateau de Limelette, Belgium., pp. 341–345
- Perini et al. (2009) Perini F., Bianchi G., Schiaffino M., Monari J., 2009, in Proceedings of Wide Field Astronomy & Technology for the Square Kilometre Array (SKADS 2009). 4-6 November 2009. Chateau de Limelette, Belgium, pp. 351–354
- Romney (1999) Romney J. D., 1999, in Astronomical Society of the Pacific Conference Series, Vol. 180, Synthesis Imaging in Radio Astronomy II, G. B. Taylor, C. L. Carilli, & R. A. Perley, ed., p. 57
- Tegmark & Zaldarriaga (2009) Tegmark M., Zaldarriaga M., 2009, Phys. Rev. D, 79, 083530
- Tegmark & Zaldarriaga (2010) Tegmark M., Zaldarriaga M., 2010, Phys. Rev. D, 82, 103501
- Thompson et al. (2004) Thompson A. R., Moran J. M., Jr. G. W. S., 2004, Interferometry and Synthesis in Radio Astronomy, Second Edition. Wiley-VCH
- Urry et al. (2007) Urry W., Wright M., Dexter M., MacMahon D., 2007, ATA Memo: The ATA Correlator. Tech. Rep. 73, University of California, Berkeley
- Williams (1968) Williams J. R., 1968, The Journal of the Acoustical Society of America, 44, 1454
- Zheng et al. (2013) Zheng H. et al., 2013, ArXiv e-prints 1309.2639
5 Appendix: Instrumentation Block Diagrams
This appendix is a supplement to ”Implementation of a Direct-Imaging and FX Correlator for the BEST-2 Array”. Included are block diagrams of the digitizer/channelizer, FX correlator, and direct-imager components of the digital hardware.