Evolution in the Escape Fraction of Ionizing Photons and the Decline in Strong Ly Emission from Galaxies
Abstract
The rapid decline in the number of strong Ly emitting galaxies at provides evidence for neutral hydrogen in the IGM, but is difficult to explain with plausible models for reionization. We demonstrate that the observed reduction in Ly flux from galaxies at can be explained by evolution in the escape fraction of ionizing photons, . We find that the median observed drop in the fraction of galaxies showing strong Ly emission, as well as the observed evolution of the Ly luminosity function both follow from a small increase in of from at . This high escape fraction may be at odds with current constraints on the ionising photon escape fraction, which favor smaller values of . However, models that invoke a redshift evolution of that is consistent with these constraints can suppress the Ly flux to the observed level, if they also include a small evolution in global neutral fraction of . Thus, an evolving escape fraction of ionising photons can be a plausible part of the explanation for evolution in the Ly emission of high redshift galaxies. More generally, our analysis also shows that the drop in the Ly fraction is quantitatively consistent with the observed evolution in the Ly luminosity functions of Ly Emitters.
keywords:
line: formation–radiative transfer–galaxies: intergalactic medium–galaxies: ISM–ultraviolet: galaxies – cosmology: observations1 Introduction
Observations of Ly emitting galaxies are often interpreted to indicate that the intergalactic medium (IGM) is more opaque to Ly photons at , than at lower redshifts. In particular, while the Ly luminosity function of Ly selected galaxies (LAE) remains constant at (e.g. Hu et al., 1998; Ouchi et al., 2008), it is observed to drop rapidly at (Kashikawa et al., 2006; Ouchi et al., 2010; Clément et al., 2012). Since their rest-frame UV luminosity functions do not exhibit the same evolution (Kashikawa et al., 2006), this reduction in the Ly luminosity function at is likely caused by a reduction in the observed Ly flux from these galaxies. Moreover, the so-called ‘Ly fraction’ – which denotes the fraction of galaxies selected via the drop-out technique that exhibit strong Ly emission lines – increases between and (Stark et al., 2010, 2011), but then drops at (Fontana et al., 2010; Pentericci et al., 2011; Schenker et al., 2012; Ono et al., 2012; Caruana et al., 2012; Treu et al., 2012; Caruana et al., 2013; Treu et al., 2013).
The observed reduction in Ly flux from galaxies at is most readily explained by having additional intervening neutral atomic hydrogen, which is opaque to the Ly flux, but not to the (non-ionizing) UV-continuum. This additional neutral atomic hydrogen is likely present naturally at when reionization has not been completed. Indeed, it has been predicted that the end of reionization should coincide with a reduction in the observed Ly flux from galaxies (e.g. Haiman & Spaans, 1999).
Reionization was likely an inhomogeneous process in which fully ionized ‘bubbles’ were seperated by neutral intergalactic gas (Furlanetto et al., 2004; McQuinn et al., 2007a). In this scenario, the progress of reionization is regulated by the growth of percolating HII bubbles. The final stages of reionization are characterized by the presence of large bubbles, whose individual sizes exceeded tens of cMpc (e.g. Zahn et al., 2011). The majority of the galaxies we can detect with existing instruments preferentially resided inside large HII bubbles. Their Ly photons would have been able to travel a significant distance before entering the neutral IGM, and redshift out of the Ly resonance due to the Hubble expansion, which would facilitate their subsequent transmission through the neutral IGM (Miralda-Escude, 1998; Cen et al., 2005; McQuinn et al., 2007b; Mesinger & Furlanetto, 2008).
Because of this effect it is difficult to interpret the observed reduction of Ly flux from galaxies at in the context of inhomogeneous reionization models, since the imprint of the neutral IGM on the detectability of Ly emission from galaxies is found to be subtle. For example, Dijkstra et al. (2011) showed that the observed drop in the Ly fraction at requires a change in the volume averaged neutral fraction of hydrogen of (also see Jensen et al. 2013, but see Taylor & Lidz 2013 who caution that the required change can be reduced when effects of galaxy sample variance are accounted for), which is consistent with earlier constraints on this quantity by McQuinn et al. (2007b) and Mesinger & Furlanetto (2008) from modeling the Ly luminosity functions. As was pointed out by Dijkstra et al. (2011), this required rapid evolution of over such a short time is extreme111If the star formation rate is tied to the formation of dark matter structures (it is difficult to imagine that it can be faster than this), then it is limited by the growth of the collapsed mass. Even when one ignores recombinations in Lyman limit systems, which slow down the late stages of reionization (e.g. Furlanetto & Mesinger 2008; Alvarez & Abel 2012, Sobacchi & Mesinger in prep), and when one assumes that the rapidly-growing exponential tail of the mass function is driving the late stages of reionization, then one still gets a change in over (e.g. see Fig. 1 in Lidz et al. 2007). Relaxing both of these extreme assumptions slows down the evolution further..
To alleviate this tension, Bolton & Haehnelt (2013) recently showed that the required may be reduced significantly by Lyman limit systems (LLSs, self-shielding clouds with cm-2), whose number density may evolve rapidly at the end of reionization (although this rise is slowed down when recombinations in the IGM are taken into account, see Sobacchi & Mesinger in prep). Similarly, the opacity of residual HI in the ionised IGM can increase by as much as between and (Dijkstra et al., 2007b; Laursen et al., 2011). However, these models also predict that the IGM transmits low fraction of Ly photons, . This is lower than current observational constraints on this quantity, which is likely related the impact of galactic winds on the Ly line shape emerging from galaxies (Dijkstra & Jeeson-Daniel, 2013). In any case, these possibilities will need to be explored and quantified further in future work.
Ly emission is powered by recombination following photoionization inside HII regions. The Ly luminosity of a galaxy, , is therefore proportional to the total number of ionizing photons that do not escape from galaxies, i.e. , where denotes the escape fraction of ionizing photons. Thus, having increase between and will reduce the Ly luminosity of galaxies as observed. We expect this effect to be especially strong when is large. For example, the intrinsic Ly luminosity doubles when , while there is little impact when .
Modeling and its redshift dependence from first principles requires properly resolving the multi-phase structure of the interstellar medium (see e.g. Fernandez & Shull, 2011), and the small spatial scales that are relevant for the transport of ionising radiation in high density gas (e.g. Rahmati et al., 2013). Direct observational constraints on the escape fraction, and it’s redshift dependence are still highly uncertain. However, there are several lines of indirect evidence that increases with redshift. Measurements of the redshift dependence of the photoionization rate of the Ly forest in combination with the observed redshift evolution of the UV-LF of drop-out galaxies, suggest that increases quite rapidly with redshift at (e.g. Kuhlen & Faucher-Giguère, 2012; Mitra et al., 2013, also see Inoue et al. 2006). Moreover, the covering factor of low-ionization absorbers in drop-out galaxies has been observed to increase from to , which provides independent evidence that is increasing with redshift (Jones et al., 2012, 2013). This inferred redshift evolution could reflect e.g. (i) an evolution of the UV-emissivity per unit gas mass, (ii) an evolution in the clumpiness in the interstellar medium (ISM) of high-z galaxies which affects the covering factor of high-column density gas (Fernandez & Shull, 2011), and/or (iii) an evolution in the fraction of stars formed in low-mass halos which can efficiently ‘self-ionize’ (e.g. Ferrara & Loeb 2013).
The goal of this paper is to explore the impact of an increasing escape fraction on the visibility of the Ly emission line from galaxies at . We stress the purpose of our paper is a proof-of-concept, and that a systematic study will be performed in future work. The outline is as follows: we describe our model in § 2, present our results in § 3. We discuss our results in § 4 and present our conclusions in § 5.
2 The Model
2.1 The EW-PDF and Its Redshift Evolution
The strength of the Ly line emerging from galaxies is regulated by several physical processes: (i) The amount of Ly that is produced, which depends on the initial mass function, stellar metallicity (e.g. Schaerer, 2003), and ; (ii) the amount of Ly that escapes from the (dusty) interstellar medium of galaxies, which is correlated with the dust-content of galaxies (Atek et al., 2009; Kornei et al., 2010; Hayes et al., 2011); and (iii) the amount of Ly that is scattered in the intergalactic/circum galactic medium. The Ly line strength relative to the non-ionizing UV continuum is quantified by the (rest frame) equivalent width EW, i.e. EW, where denotes the luminosity density of the continuum at Å. The Ly emitting properties of a collection of galaxies can be quantified by the (cumulative) EW-distribution function (PDF), denoted with .
All processes listed above leave their imprint on the observed EW-PDF, and its redshift evolution. In particular, the EW-PDF evolves towards larger EWs from to (Stark et al., 2010), which can most easily be attributed to a decreasing dust content of galaxies in this redshift range (Hayes et al., 2011). Moreover, since the opacity of the intergalactic medium is expected to increase over the same redshift interval (and which would thus reduce the EW-PDF towards higher ), its impact appears subdominant to that of dust. However, the average222Of course, individual galaxies at can be dusty (see e.g. Finkelstein et al., 2013, for an example at with weak Ly emission). dust content of galaxies keeps decreasing at (e.g. Finkelstein et al., 2012b; Bouwens et al., 2012b), and we would expect the EW-PDF to keep increasing. This is not what has been observed, and it becomes natural to search for alternative explanations for this sudden reduction in the EW-PDF at . Suppression of the Ly line by neutral intergalactic gas is a natural explanation, as there exist other observational indications for the presence of neutral intergalactic gas at (e.g. in quasar absorption line spectra, see Wyithe & Loeb, 2004; Mesinger & Haiman, 2007; Bolton et al., 2011).
Previous models (e.g. Dijkstra et al., 2011; Jensen et al., 2013; Bolton & Haehnelt, 2013) have explored this possibility quantitatively, and assumed that the EW-PDF at only differs from the one measured at due to the intervening neutral IGM. Under this assumption we have EW7=EW, where corresponds to the IGM transmission fraction at redshift . We can then derive the EW-PDF at from the one observed at simply from333Dijkstra et al. (2011) computed -PDFs, , as part of their analysis, and this could also be folded into the calculation. Dijkstra et al. (2011) further assumed that . Under these assumptions we have . . Because it is difficult to explain the observed evolution with reionization alone (see § 1), we perform a similar analysis which includes a redshift escape fraction in this paper, as is discussed in more detail next.
2.2 The Redshift Evolution of the EW-PDF with
To incorporate the impact of , we first introduce the distribution which denotes the EW-PDF, if the escape fraction of ionizing photons at were . This model maximizes the produced Ly luminosity/EW for a given IMF and stellar metallicity. We assume that is an exponential function at EW with a scalelength EW0, zero otherwise. We next assume that galaxies have a distribution of , which we denote with444We denote differential and cumulative probability distributions with lower and upper case letters, respectively. That is, we denote . . In this case we have
| (1) |
where denotes the differential distribution of , and where denotes the cumulative distribution of EW at redshift . We assume that is Gaussian when , and zero otherwise. We denote the mean, or expectation value, of with . For a given , we constrain the scalelength EW0 by comparing to the observed . We point out that the expression for in Eq 2.3 is a weighted sum of exponential functions with different scale-lengths. The final function is therefore generally not an exponential function, which differs from previous analyses (as in Dijkstra et al., 2011; Jensen et al., 2013; Bolton & Haehnelt, 2013). In our analysis we make the following additional assumptions:
-
•
at a fixed is the same for all galaxies: i.e. does not depend on . As discussed in § 4.1, this assumption is likely unrealistic. However, the precise -dependence of is still poorly constrained. Instead of including this possible dependence in our models, we opt to study simpler models, which can provide a baseline for more complex future models that include this effect. Moreover, the range of UV-luminosities of the galaxies we are modeling is still limited, and the impact of depending on does not affect our main results.
-
•
First, we assume that the EW-PDF at differs only from the one at due to the a change in the escape fraction of ionizing photons, (see § 2.1 for a motivation of this assumption). We present our results on this analysis in § 3. We discuss how our analysis is modified if we assume that the EW-PDF evolves at as a result of a joint evolution in and reionization in § 2.3. We generally present our results in terms of the expectation values . We point out that the large impact on the redshift evolution in for large at fixed (as mentioned in § 1) arises because appears as in the argument of in Eq 2.3, which increases rapidly when .
-
•
Our analysis implicitly assumes that the evolution of does not affect the evolution of other quantities: e.g. increasing the escape fraction does not increase (i) the fraction of Ly photons that are transmitted through the IGM, or (ii) the fraction of Ly photons that can escape from the dusty ISM of galaxies. As we argue in § 4.3, (i) is reasonable, while (ii) presents a limitation of the model, but may help explain why the redshift evolution of the escape fraction may only have noticeable effects on the visibility of the Ly line at .
2.3 The Redshift Evolution of the EW-PDF with and
If we add the effect of an (modest) evolution in reionization together with a modest evolution in , then we can achieve a larger drop in the Ly fraction. The additional impact of reionization on the EW-PDF can be incorporated as555This (again) assumes that . This assumption is conservative in the sense that it maximizes the impact of reionization (see Dijkstra et al., 2011, for a discussion).
| (2) | |||
where denotes the -PDF. Computing this PDF was the prime focus of the analysis described in Dijkstra et al. (2011), who combined galactic outflow models with large-scale semi-numeric simulations of reionization.
Following Dijkstra et al. (2011), we model the impact of the galactic outflow on the Ly photons emerging from the galaxy using spherical shell models. For the analysis in this paper, we used shells with cm-2 and wind velocities of km s-1. For more a detailed discussion on these models the reader is referred to Dijkstra & Wyithe (2010) and Dijkstra et al. (2011). We simulate inhomogeneous reionization at with the publicly-available, semi-numerical code DexM (Mesinger & Furlanetto 2007; http://homepage.sns.it/mesinger/Sim). DexM combines excursion set and perturbation formalisms to generate various cosmic fields, and has been extensively tested against numerical simulations (Mesinger & Furlanetto, 2007; Mesinger et al., 2011; Zahn et al., 2011). Our simulation box is 200 Mpc on a side with a resolution of 5003. We resolve halos down to a minimum mass of , consistent with the expected cooling threshold at (Sobacchi & Mesinger, 2013). The simulations present minor modifications of those used in Dijkstra et al. 2011 (specifically the simulated redshift has been changed for the problem at hand, and the minimum mass has been increased by a factor of to account for photoionization feedback). These modified simulations will be described in detail in a subsequent work, Mesinger et al., in prep. We note that the new look very similar to those we obtained with the original simulations that were used in Dijkstra et al. (2011).
3 Results
3.1 Evolution in the Ly Fraction from Redshift Evolution in
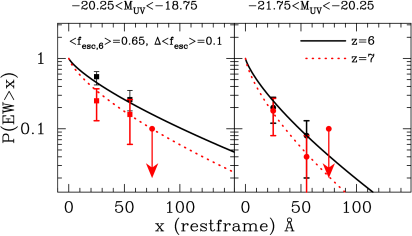
Figure 1 shows cumulative Ly EW-PDFs of drop-out galaxies with (left panel) and (right panel). The black squares (red filled circles) represent data points at () from the compilation by Ono et al. (2012). This Figure also shows an example of a model in which the observed redshift evolution of the Ly EW-PDF can be mimicked completely with a redshift-dependent .
The black solid line in the left panel shows a model EW-PDF at which assumes (i) that is Gaussian with a standard deviation and , and that (ii) , where we took EW Å to match the data. These model parameters were chosen to quantitatively illustrate our main point666We stress that: (i) the choice is a bit arbitrary, but intermediate between having negligible dispersion and having such a large dispersion that approaches a uniform distribution. We have verified that our main conclusions are not affected by the precise choice of ; (ii) EW0 corresponds to the scale-length of . As we mentioned in § 2, we use Eq 1 to compute . In contrast, previous works adopted an exponential function for , which generally has a different scale-length than .. The black solid line shown in the right panel represents the same model, but with EW Å. This reduced value777Coincidentally the scalelength EW Å in for the sample of bright drop-out galaxies is close to the scale-length of EW Å adopted in Dijkstra et al. (2011) for the function , the observed EW-distribution of drop-out galaxies (from Stark et al. 2010). of EW0 reflects that the Ly fraction decreases towards brighter .
The red dotted lines represent a model in which we only modified such that , i.e. . This model can fully explain the observed reduction of the Ly EW-PDF and the drop in the Ly fraction.
3.2 Evolution in the Luminosity Functions from Redshift Evolution in
We also show the impact of a changing on the Ly luminosity function of LAEs. For this exercise, we follow the procedure of Dijkstra & Wyithe (2012), who constructed Ly luminosity functions by combining observed UV luminosity functions of drop-out selected galaxies with observed Ly equivalent width distributions. Dijkstra & Wyithe (2012) found that this procedure reproduces observed luminosity functions of LAEs well following inclusion of a rescaling by a factor of (for a detailed discussion we refer the interested reader Dijkstra & Wyithe 2012). Importantly, the redshift evolution of the luminosity functions of LAEs was reproduced well at all redshifts , which is important for the analysis presented here.
The differential Ly luminosity function, denoted by , measures the comoving number density of galaxies with (the logarithm of their) Ly luminosities in the range , and is given by
Here, denotes the comoving number density of drop-out selected galaxies with absolute magnitudes in the range , for which we adopted the Schechter function parameterization given by Table 1 in Bouwens et al. (2012a). The distribution of Ly luminosity is . Finally, we have (as mentioned above). Equation 3.2 therefore allows us to compute the redshift evolution in the Ly luminosity function due to both evolution in the UV-luminosity function of drop-out galaxies, and the redshift evolution of (i.e. the Ly fraction).
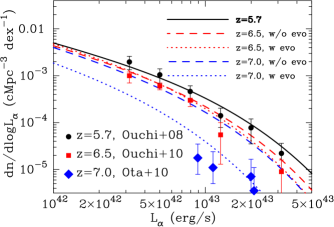
The black solid line shows the predicted Ly luminosity function at , where we assumed that , and we adopted the shown in the left panel of Figure 1 (i.e. the EW-PDF that described the UV-faint population of drop-out galaxies)888The majority of LAEs have , where LAEs are detected only marginally in the continuum (see Fig 22 of Ouchi et al., 2008). A proper calculation would take into account that there are UV bright LAEs () for which is different. However, because there are fewer of these galaxies, the impact of the assumed at bright only has little impact on the bright end of the Ly luminosity function. We have repeated our analysis with the -dependent given by Dijkstra & Wyithe (2012) and obtained practically the same results.. The model luminosity function fits the observations of Ouchi et al. (2008) (blue filled circles) well. The red lines show the predicted luminosity functions at . The dashed red line assumes that the EW-PDF at is the same as at , while the dotted red line assumes that evolved from at to at (i.e. this corresponds to the model shown in Fig 1 and we assumed that and ). The data at (red filled squares, taken from Ouchi et al. 2010) does not favor any of the models significantly. The blue lines show the predicted luminosity functions at , where the dotted line shows a model in which the evolved to at . This model lies much closer to the observations of Ota et al. (2010, green diamonds) than the model which keeps constant. Thus, evolution in the escape fraction of ionizing photons simultaneously explains the observed drop in the Ly fraction between and , and the observed evolution in the Ly luminosity functions within the same redshift range. More generally, our analysis shows that the drop in the Ly fraction is quantitatively consistent with the observed evolution in the Ly luminosity functions of LAEs.
3.3 Evolution in the Ly Fraction from Joint Redshift Evolution in and
The previous section illustrated that a small evolution in from a value of is sufficient to explain the observed decrease in the LAE luminosity function and the fraction of strong Ly emitting galaxies. However this high escape fraction may be at odds with constraints obtained from measurements of Thomson optical depth to the cosmic microwave background, the photoionization rate of the Ly forest, and the observed redshift evolution of the UV-LF of drop-out galaxies, which jointly favour values of (Inoue et al. 2006, Wyithe et al. 2010, Kuhlen & Faucher-Giguère 2012, Robertson et al. 2013, Becker & Bolton 2013, also see Finkelstein et al. 2012). While these estimates rely on uncertain extrapolations999Figure 8 of Kuhlen & Faucher-Giguère (2012) shows the constraint on as a function of the minimum UV-luminosity to which they extrapolate the observed UV-LFs. Notably, the constraint includes all galaxies with and thus involves extrapolating the UV-LF by 4-5 magnitudes. of the luminosity density in low luminosity galaxies (and towards higher redshifts), the first direct constraints on in LAEs have recently been reported by Ono et al. (2010) who found ().
Thus, the escape fraction evolution is unlikely to fully explain the observed drop in the Ly fractions. We therefore examine the specific case in which evolves as (as in Kuhlen & Faucher-Giguère, 2012, also see Becker & Bolton 2013), and adopt and (which is consistent with observations, see Kuhlen & Faucher-Giguère, 2012)101010The evidence for such a dramatic evolution in can be ameliorated however with, e.g.: (i) a luminosity (i.e. halo mass) dependence of (as in e.g. Ferrara & Loeb 2013); (ii) an (evolving) contribution of very faint dwarf galaxies; and/or (iii) a loosening of the kinetic Sunyaev-Zeldovich reionization constraints used in the analysis for Kuhlen & Faucher-Giguère (2012), which Mesinger et al. (2012) show are insensitive to the end stages of reionization. We return to the issue of (i) in the next section, but (ii) in particular is not surprising, as pointed out by Alvarez et al. (2012). A population of dwarf galaxies near the atomic cooling threshold with moderate values of could reionize the Universe at . Photo-ionization feedback from reionization itself would subsequently suppress star formation in galaxies around this mass scale (e.g. Sobacchi & Mesinger 2013), so that they no longer contribute to the ionizing emissivity at .. For , we have at and at . While this model predicts that , it does not suffice to fully explain the observed evolution of the EW-PDF. This is due to the smaller value of than what we assumed previously, which gives rise to a weaker impact on the redshift evolution of the EW-PDF (see § 1, and § 2).
In Figure 3 we show the cumulative Ly EW distribution for UV-faint drop-out selected galaxies only (see Fig 1 for a description of the lines and data points; the following results are quantitatively the same for the UV-bright galaxies). The black solid line now represents a model in which (i) is a Gaussian with and , and (ii) , where EW Å (note that it was111111We have to pick a different because we changed . For the new choice for the predicted EW-PDF differs from that shown in Fig 1. EW Å in the model studied in § 3 for the UV-faint sample). The red dotted lines show the predicted changes in the EW-PDF under the assumption that the drop is entirely due to a changing ionization state of the IGM (as in Dijkstra et al. 2011 and Jensen et al. 2013)121212It is worth noting that if the IGM is not fully neutral even at (which is consistent with current observations (e.g. McGreer et al. 2011; Schroeder et al. 2013), then the required to match observations is decreased (McQuinn et al., 2007b; Mesinger & Furlanetto, 2008; Dijkstra et al., 2011) . The upper/lower red dotted line corresponds to /. The blue dashed line represents a model in which in addition to having . This model is virtually indistinguishable from the model with and no evolution in . Thus, extrapolation of the observed evolution in is equivalent to having an additional between and in effecting the properties of Ly flux and EW.
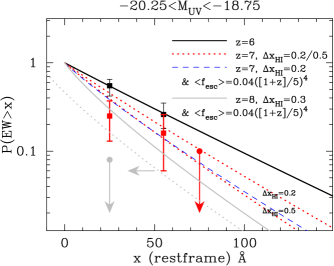
The grey solid line represents the a model in which the redshift evolution in is extrapolated to . In this model, we additionally assume that the globally averaged neutral fraction, , has evolved further to . Figure 3 shows that an evolving has a dramatic impact on the predicted Ly fraction at . However, even these models do not reproduce the recently inferred Ly fraction at by Treu et al. (2013) (represented by the upper limit at EW Å). This ‘failure’ can be partially remedied by requiring that at , which would again require a very rapid evolution in . It may also be related to the fact that our models assume that all drop-out galaxies have a Ly emission line with EW, i.e. that . While this assumption is consistent with observations of drop-out galaxies at , the observational uncertainties allow us to relax this assumption and shift the intrinsic distribution by, say, EW= Å, which would imply that as observed in drop-out galaxies (Shapley et al., 2003). While the escape fraction of Ly photons increases with redshift, it is unclear whether at . If we apply a shift of EW= Å to the predictions at , then our model predictions lie much closer to the upper limit at (as shown by the grey dotted line).
4 Discussion
4.1 A Mass/Luminosity-dependent ?
A caveat is that the observationally inferred redshift evolution of adopted in § 3.3, refers to an average over the entire galaxy population. It has been argued that the inferred redshift evolution may be driven by a mass and/or luminosity dependence of the escape fraction (Alvarez et al., 2012; Ferrara & Loeb, 2013). In this scenario, decreases towards higher masses and/or luminosities, and the population averaged escape fraction reflects the redshift evolution of the luminosity and/or mass functions. Support for the mass and/or luminosity dependence of the escape fraction is provided by the observationally inferred escape fraction of LAEs at of , which is significantly higher than the inferred fraction for the more massive LBGs where (e.g. Iwata et al., 2009; Nestor et al., 2011).
This suggests that assuming a uniform is not realistic. However, the higher inferred escape fraction of LAEs at of may imply that we need a less rapid evolution in to have a significant impact on the redshift evolution of the Ly fraction: we showed that can either help explain the observed drop in the Ly fraction between and if , or explain the complete evolution when . If increases continuously between and , then may be large enough that only a small additional change may have a significant impact. As mentioned in § 1, the decreasing covering factor of low ionization absorption lines with redshift does suggest that escape fraction increases with redshift for a fixed galaxy population (Jones et al., 2012, 2013).
4.2 Ly Transport & Escape, and a Bimodal
The observed Ly flux of a galaxy not only depends on , but also on the effective escape fraction of Ly photons from the galaxies to the observer, . Thus we have . The effective escape fraction includes the fraction of Ly photons that escape from the interstellar medium of galaxies, but also the fraction that is subsequently transmitted through the intergalactic medium (IGM, e.g. Dijkstra & Jeeson-Daniel, 2013). Both of these processes may depend on the value of , i.e. (see discussion in § 4.3).
The escape of Ly photons from a dusty interstellar medium for example, is a complex process which depends on the dust content of the ISM, as well as its kinematics (e.g. Atek et
al., 2008; Hayes et al., 2011). Irrespective of these complexities, the escape of ionizing photons requires low column density ( cm-2) sightlines out of the galaxy. If these low HI-column density paths are surrounded by higher column density sightlines which are opaque to ionizing photons (as in the ‘blow-out’ model proposed by Nestor et al., 2011), then we may expect Ly photons to scatter and preferentially escape along these same paths (see Behrens et al. 2014 for a more detailed investigation of this effect). This can introduce a correlation between the escape fractions of Ly and ionizing photons. In the most extreme case, individual galaxies would have a bimodal distribution for which contains peaks at and . Interestingly, there is observational support for such a bimodality in observations of star forming galaxies, which indicate that a small fraction has a large , while a large fraction practically has (Shapley et al., 2006; Nestor et al., 2011; Vanzella et al., 2012). However, even in this scenario it is the escape fraction averaged131313In the extreme scenario in which along certain sightlines, and otherwise, the angle-averaged escape fraction is just the sky-covering factor of low column density ‘holes’, i.e . over all sightlines, , that is relevant for powering nebular emission (and also for reionizing the Universe). The models described in this paper therefore also describe a scenario in which is distributed as a Gaussian.
It is nevertheless good to keep in mind that our scenario does not describe the more extreme situation in which has a bimodal distribution, i.e. it does not describe a scenario in which some galaxies have while others have in all directions. In this scenario – which appears to be at odds with observed covering factors of low-ionization absorption line systems in drop-out galaxies, which are typically (see e.g. Heckman et al., 2011; Jones et al., 2013)– an increase in with translates to an increase in the fraction of galaxies with . This would also reduce the fraction of star forming galaxies that produce Ly photons. However, the overall reduction in the number density of LAEs would be weaker than in our models.
4.3 Dependence of on
The discussion above shows that the effective escape fraction of Ly photons can depend on (and therefore possibly on as in Forero-Romero et al. 2012). If ionizing photons escape anisotropically, then so do Ly photons. However, the first calculations of this effect have been reported only recently (Behrens et al. 2014). The precise correlation this may introduce between and is complex (it depends e.g. on the geometry of the low-column density holes, outflow properties), and has therefore not been quantified yet. If we assume for simplicity that , then we expect the observed Ly luminosity to increase with until , after which it decreases.
The correlation between and likely originates mostly at the ISM-level: subsequent resonant scattering in the IGM occurs off residual HI, whose number density is affected by the value of (e.g. Haardt
& Madau, 2012, and Fig 4 of Dijkstra et al. 2007a for how this affects the IGM opacity). However, resonant scattering in the IGM depends sensitively on the assumed Ly spectral line profile. Scattering off HI in galactic outflows typically redshifts the Ly photons out of resonance as they escape from the galaxy, which strongly reduces the importance of resonant scattering in the IGM (see Fig 1 and the discussion in § 3.1 of Dijkstra et al., 2011). Ignoring the dependence of the IGM transmission on is therefore reasonable.
In short, ignoring a plausible correlation between and is a shortcoming of the model that will need to be addressed in future work. Interestingly, it may help us explain why a monotonously evolving can give rise to a non-monotonic redshift dependence of the Ly fraction, with a turn-over occuring near the redshifts of interest. For example, If (consistent with upper limits by Vanzella et a. 2010) and (as in Kuhlen & Faucher-Giguère 2012), then the inferred from Dijkstra & Jeeson-Daniel (2013) and Hayes et al. (2011), implies that , which corresponds to . We would have a peak in Ly luminosity near the and redshift of interest.
5 Conclusion
We have investigated whether the observed reduction in Ly flux from galaxies at can be explained by an evolving escape fraction of ionizing photons (). Our study was motivated by (i) a growing consensus in the literature that must have been higher at high redshift, and (ii) the fact that it appears difficult to explain the observed reduction in Ly flux with reionization alone. We found that we can reproduce the median observed drop in the Ly fraction, as well as the observed evolution of the LAE luminosity functions, with a small increase in of , as long as the escape fraction is large () at . Models with redshift evolution of that are more consistent with indirect constraints derived from observations, combined with a small evolution in global neutral fraction of between also suppress the Ly flux at at the observed level. Our study demonstrates that an evolving escape fraction of ionising photons from galaxies modifies the observed equivalent widths of Ly galaxies at a level comparable to that expected from reionization, and provides a plausible part of the explanation for evolution in the Ly emission of high redshift galaxies.
Finally, we expect the Ly spectral line shape to evolve with redshift in models that invoke the IGM to explain the reduced Ly flux from galaxies (see Fig 5 of Dijkstra et al. 2007), while this is not obviously the case for models that invoke evolution of . Interestingly, Hu et al. (2010) have shown that the observed Ly line shape of a stack of galaxies is practically identical to that at . We will investigate the implications of this result in future work.
Acknowledgements This research was conducted by the Australian Research Council Centre of Excellence for All-Sky Astrophysics (CAASTRO), through project number CE 110001020. MD acknowledges financial support from DAAD. We thank an anonymous referee for constructive comments that improved the presentation of this work.
References
- Alvarez et al. (2012) Alvarez, M. A., Finlator, K., & Trenti, M. 2012, ApJL, 759, L38
- Alvarez & Abel (2012) Alvarez, M. A., & Abel, T. 2012, ApJ, 747, 126
- Atek et al. (2008) Atek, H., Kunth, D., Hayes, M., Östlin, G., & Mas-Hesse, J. M. 2008, A&A, 488, 491
- Atek et al. (2009) Atek, H., Kunth, D., Schaerer, D., et al. 2009, A&A, 506, L1
- Becker & Bolton (2013) Becker, G. D., & Bolton, J. S. 2013, MNRAS, 436, 1023
- Behrens et al (2014) Behrens, C. J., Dijkstra, M., Niemeyer, J. 2014, accepted to A&A, arXiv:1401.4860
- Bolton et al. (2011) Bolton, J. S., Haehnelt, M. G., Warren, S. J., et al. 2011, MNRAS, 416, L70
- Bolton & Haehnelt (2013) Bolton, J. S., & Haehnelt, M. G. 2013, MNRAS, 429, 1695
- Bouwens et al. (2012a) Bouwens, R. J., Illingworth, G. D., Oesch, P. A., et al. 2012a, ApJL, 752, L5
- Bouwens et al. (2012b) Bouwens, R. J., Illingworth, G. D., Oesch, P. A., et al. 2012b, ApJ, 754, 83
- Caruana et al. (2012) Caruana, J., Bunker, A. J., Wilkins, S. M., et al. 2012, MNRAS, 427, 3055
- Caruana et al. (2013) Caruana, J., Bunker, A. J., Wilkins, S. M., et al. 2013, arXiv:1311.0057
- Cen et al. (2005) Cen, R., Haiman, Z., & Mesinger, A. 2005, ApJ, 621, 89
- Clément et al. (2012) Clément, B., Cuby, J.-G., Courbin, F., et al. 2012, A&A, 538, A66
- Dijkstra et al. (2007a) Dijkstra, M., Lidz, A., & Wyithe, J. S. B. 2007a, MNRAS, 377, 1175
- Dijkstra et al. (2007b) Dijkstra, M., Wyithe, J. S. B., & Haiman, Z. 2007b, MNRAS, 379, 253
- Dijkstra & Wyithe (2010) Dijkstra, M., & Wyithe, J. S. B. 2010, MNRAS, 408, 352
- Dijkstra et al. (2011) Dijkstra, M., Mesinger, A., & Wyithe, J. S. B. 2011, MNRAS, 414, 2139
- Dijkstra & Wyithe (2012) Dijkstra, M., & Wyithe, J. S. B. 2012, MNRAS, 419, 3181
- Dijkstra & Jeeson-Daniel (2013) Dijkstra, M., & Jeeson-Daniel, A. 2013, MNRAS, 435, 3333
- Ferrara & Loeb (2013) Ferrara, A., & Loeb, A. 2013, MNRAS, 431, 2826
- Fernandez & Shull (2011) Fernandez, E. R., & Shull, J. M. 2011, ApJ, 731, 20
- Finkelstein et al. (2012a) Finkelstein, S. L., Papovich, C., Ryan, R. E., et al. 2012a, ApJ, 758, 93
- Finkelstein et al. (2012b) Finkelstein, S. L., Papovich, C., Salmon, B., et al. 2012b, ApJ, 756, 164
- Finkelstein et al. (2013) Finkelstein, S. L., Papovich, C., Dickinson, M., et al. 2013, Nature, 502, 524
- Fontana et al. (2010) Fontana, A., Vanzella, E., Pentericci, L., et al. 2010, ApJL, 725, L205
- Forero-Romero et al. (2012) Forero-Romero, J. E., Yepes, G., Gottlöber, S., & Prada, F. 2012, MNRAS, 419, 952
- Furlanetto et al. (2004) Furlanetto, S. R., Zaldarriaga, M., & Hernquist, L. 2004, ApJ, 613, 1
- Grazian et al. (2011) Grazian, A., Castellano, M., Koekemoer, A. M., et al. 2011, A&A, 532, A33
- Haardt & Madau (2012) Haardt, F., & Madau, P. 2012, ApJ, 746, 125
- Haiman & Spaans (1999) Haiman, Z., & Spaans, M. 1999, ApJ, 518, 138
- Hayes et al. (2011) Hayes, M., Schaerer, D., Östlin, G., et al. 2011, ApJ, 730, 8
- Heckman et al. (2011) Heckman, T. M., Borthakur, S., Overzier, R., et al. 2011, ApJ, 730, 5
- Hu et al. (1998) Hu, E. M., Cowie, L. L., & McMahon, R. G. 1998, ApJL, 502, L99
- Hu et al. (2010) Hu, E. M., Cowie, L. L., Barger, A. J., et al. 2010, ApJ, 725, 394
- Inoue et al. (2006) Inoue, A. K., Iwata, I., & Deharveng, J.-M. 2006, MNRAS, 371, L1
- Iwata et al. (2009) Iwata, I., Inoue, A. K., Matsuda, Y., et al. 2009, ApJ, 692, 1287
- Jensen et al. (2013) Jensen, H., Laursen, P., Mellema, G., et al. 2013, MNRAS, 428, 1366
- Jones et al. (2012) Jones, T., Stark, D. P., & Ellis, R. S. 2012, ApJ, 751, 51
- Jones et al. (2013) Jones, T., Ellis, R. S., Schenker, M. A., & Stark, D. P. 2013, arXiv:1304.7015
- Kashikawa et al. (2006) Kashikawa, N., Shimasaku, K., Malkan, M. A., et al. 2006, ApJ, 648, 7
- Kornei et al. (2010) Kornei, K. A., Shapley, A. E., Erb, D. K., et al. 2010, ApJ, 711, 693
- Kuhlen & Faucher-Giguère (2012) Kuhlen, M., & Faucher-Giguère, C.-A. 2012, MNRAS, 423, 862
- Laursen et al. (2011) Laursen, P., Sommer-Larsen, J., & Razoumov, A. O. 2011, ApJ, 728, 52
- Lidz et al. (2007) Lidz, A., McQuinn, M., Zaldarriaga, M., Hernquist, L., & Dutta, S. 2007, ApJ, 670, 39
- McGreer et al. (2011) McGreer, I. D., Mesinger, A., & Fan, X. 2011, MNRAS, 415, 3237
- McQuinn et al. (2007a) McQuinn, M., Lidz, A., Zahn, O., et al. 2007a, MNRAS, 377, 1043
- McQuinn et al. (2007b) McQuinn, M., Hernquist, L., Zaldarriaga, M., & Dutta, S. 2007b, MNRAS, 381, 75
- Mesinger & Haiman (2007) Mesinger, A., & Haiman, Z. 2007, ApJ, 660, 923
- Mesinger & Furlanetto (2007) Mesinger, A. & Furlanetto, S. 2007, ApJ, 669, 663
- Mesinger & Furlanetto (2008) Mesinger, A. & Furlanetto, S. 2008, MNRAS, 386, 1990
- Mesinger et al. (2011) Mesinger, A., Furlanetto, S., & Cen, R. 2011, MNRAS, 407, 1328
- Mesinger et al. (2012) Mesinger, A., McQuinn, M., & Spergel, D. 2012, MNRAS, 422, 1403
- Miralda-Escude (1998) Miralda-Escude, J. 1998, ApJ, 501, 15
- Mitra et al. (2013) Mitra, S., Ferrara, A., & Choudhury, T. R. 2013, MNRAS, 428, L1
- Nakajima & Ouchi (2013) Nakajima, K., & Ouchi, M. 2013, arXiv:1309.0207
- Nestor et al. (2011) Nestor, D. B., Shapley, A. E., Steidel, C. C., & Siana, B. 2011, ApJ, 736, 18
- Ono et al. (2010) Ono, Y., Ouchi, M., Shimasaku, K., et al. 2010, ApJ, 724, 1524
- Ono et al. (2012) Ono, Y., Ouchi, M., Mobasher, B., et al. 2012, ApJ, 744, 83
- Ouchi et al. (2008) Ouchi, M., Shimasaku, K., Akiyama, M., et al. 2008, ApJS, 176, 301
- Ouchi et al. (2010) Ouchi, M., Shimasaku, K., Furusawa, H., et al. 2010, ApJ, 723, 869
- Pentericci et al. (2011) Pentericci, L., Fontana, A., Vanzella, E., et al. 2011, ApJ, 743, 132
- Rahmati et al. (2013) Rahmati, A., Schaye, J., Pawlik, A. H., & Raicevic, M. 2013, MNRAS, 431, 2261
- Robertson et al. (2013) Robertson, B. E., Furlanetto, S. R., Schneider, E., et al. 2013, ApJ, 768, 71
- Santos (2004) Santos, M. R. 2004, MNRAS, 349, 1137
- Schaerer (2003) Schaerer, D. 2003, A&A, 397, 527
- Schenker et al. (2012) Schenker, M. A., Stark, D. P., Ellis, R. S., et al. 2012, ApJ, 744, 179
- Schroeder et al. (2013) Schroeder, J., Mesinger, A., & Haiman, Z. 2013, 428, 3058
- Shapley et al. (2003) Shapley, A. E., Steidel, C. C., Pettini, M., & Adelberger, K. L. 2003, ApJ, 588, 65
- Shapley et al. (2006) Shapley, A. E., Steidel, C. C., Pettini, M., Adelberger, K. L., & Erb, D. K. 2006, ApJ, 651, 688
- Sobacchi & Mesinger (2013) Sobacchi, E., & Mesinger, A. 2013, MNRAS, 432, 3340
- Stark et al. (2010) Stark, D. P., Ellis, R. S., Chiu, K., Ouchi, M., & Bunker, A. 2010, MNRAS, 408, 1628
- Stark et al. (2011) Stark, D. P., Ellis, R. S., & Ouchi, M. 2011, ApJL, 728, L2
- Taylor & Lidz (2013) Taylor, J., & Lidz, A. 2013, MNRAS, 2740
- Treu et al. (2012) Treu, T., Trenti, M., Stiavelli, M., Auger, M. W., & Bradley, L. D. 2012, ApJ, 747, 27
- Treu et al. (2013) Treu, T., Schmidt, K. B., Trenti, M., Bradley, L. D., & Stiavelli, M. 2013, arXiv:1308.5985, ApJL in press
- Vanzella et al. (2010) Vanzella, E., Giavalisco, M., Inoue, A. K., et al. 2010, ApJ, 725, 1011
- Vanzella et al. (2012) Vanzella, E., Guo, Y., Giavalisco, M., et al. 2012, ApJ, 751, 70
- Wyithe & Loeb (2004) Wyithe, J. S. B., & Loeb, A. 2004, Nature, 427, 815
- Wyithe et al. (2010) Wyithe, J. S. B., Hopkins, A. M., Kistler, M. D., Yüksel, H., & Beacom, J. F. 2010, MNRAS, 401, 2561
- Zahn et al. (2011) Zahn, O., Mesinger, A., McQuinn, M., et al. 2011, MNRAS, 414, 727