High Energy X-ray Detection of G359.890.08 (Sgr AE):
Magnetic Flux Tube Emission Powered by Cosmic Rays?
Abstract
We report the first detection of high-energy X-ray ( keV) emission from the Galactic Center non-thermal filament G359.890.08 (Sgr AE) using data acquired with the Nuclear Spectroscopic Telescope Array (NuSTAR). The bright filament was detected up to keV during a NuSTAR Galactic Center monitoring campaign. The featureless power-law spectrum with a photon index confirms a non-thermal emission mechanism. The observed flux in the keV band is erg cm-2 s-1, corresponding to an unabsorbed X-ray luminosity erg s-1 assuming a distance of 8.0 kpc. Based on theoretical predictions and observations, we conclude that Sgr AE is unlikely to be a pulsar wind nebula (PWN) or supernova remnantmolecular cloud (SNRMC) interaction, as previously hypothesized. Instead, the emission could be due to a magnetic flux tube which traps TeV electrons. We propose two possible TeV electron sources: old PWNe (up to kyr) with low surface brightness and radii up to pc or molecular clouds (MCs) illuminated by cosmic rays (CRs) from CR accelerators such as SNRs or Sgr A*.
Subject headings:
Galaxy:center — X-rays: individual (Sgr A-E, G359.890.08, XMM J174502904) — X-rays: ISM1. Introduction
The Galactic Center (GC) hosts not only the supermassive black hole Sagittarius A* (Sgr A*), supernova remnants (SNRs), pulsar wind nebulae (PWNe), dense molecular clouds and star clusters, but also many mysterious non-thermal filamentary structures. Originally detected at radio wavelengths (e.g. Yusef-Zadeh et al., 1984), many non-thermal filaments were later revealed to be strong X-ray emitters (e.g. Lu et al., 2008; Johnson et al., 2009). Within of Sgr A*, numerous () X-ray filaments are now well-resolved on arcsecond scales in Chandra observations (Lu et al., 2008; Muno et al., 2008; Johnson et al., 2009). But their emission mechanism and nature have been under debate since their discovery.
Among the GC non-thermal filaments, G359.890.08 (XMM J174502904) (Sakano et al., 2003; Lu et al., 2003), the X-ray counterpart to Sgr AE (Ho et al., 1985), is by far the most luminous. Discovered in archival XMM-Newton and Chandra observations of the GC (Sakano et al., 2003; Lu et al., 2003), it was noted for its highly absorbed featureless spectrum and wisp-like linear emission extending nearly perpendicular to the Galactic plane. The large X-ray absorption column is consistent with a GC origin (Sakano et al., 2003). The X-ray wisp was identified as a plausible counterpart to a radio filament recorded in archival VLA images of the GC at 2-cm, 6-cm, and 20-cm wavelengths (Ho et al., 1985; Yusef-Zadeh & Morris, 1987; Lang et al., 1999). The radio spectral index (, ) was measured to be -0.4 by Ho et al. (1985) using 2-cm and 6-cm continuum data, and more recently derived as -0.17 by Yusef-Zadeh et al. (2005) using high-resolution continuum data at a number of wavelengths between 2 and 20 cm. The negative spectral index suggested a non-thermal nature, which was confirmed by detection of radio polarization. Although their morphologies are similar, the X-ray feature is significantly offset from the radio wisp (). The more compact X-ray emission region suggests that the difference between radio and X-ray morphologies could be due to synchrotron cooling losses in an advective flow (Yusef-Zadeh et al., 2005; Sakano et al., 2003).
One possibility for the origin of the synchrotron particles is a ram-pressure confined PWN as proposed by Lu et al. (2003). They reported the marginal (2.5 ) detection of a point source (CXOU J174539.6290413), which they speculated to be the pulsar that powers the PWN. However, the point source was not confirmed by deeper Chandra observations (Yusef-Zadeh et al., 2005; Johnson et al., 2009). The PWN scenario also predicts spectral steepening towards the pulsar, which was investigated by Johnson et al. (2009) using deep Chandra observations. Their detailed spatially resolved spectral analysis showed no appreciable spectral steepening across either the minor or major axis of the filament, to within the 90% confidence error bar, thus disfavoring a PWN scenario.
Another plausible explanation is a supernova remnant and molecular cloud (SNRMC) interaction, in which the Sgr AE radio emission is due to the interaction between the shock front of a second SNR south of Sgr A East and the molecular cloud M0.130.08, also known as the 20 km cloud (Ho et al., 1985; Coil & Ho, 2000; Yusef-Zadeh et al., 2005). The second SNR, G359.920.09, is believed to explain the circular feature south of Sgr A East in the 20-cm continuum emission map, which is shown in Pedlar et al. (1989). Because of the observed redshifted gas at the position of Sgr AE, Coil & Ho (2000) suggested that Sgr AE is the result of a SNR shock wave expanding into the 20 km cloud behind it along the line-of-sight. This is contradicted by the very high absorption derived in X-ray observations, which suggests Sgr AE is embedded or behind the 20 km cloud (Johnson et al., 2009). Because of these controversies, no compelling conclusions have been drawn to date about the nature of Sgr AE.
In this paper we report the first detections of hard X-ray emission from Sgr AE up to keV. In §2 we present the observations and data reduction, while in §3 we discuss the morphology, and in §4 we discuss the spectroscopy. §5 reports on a pulsation search. Three possible scenarios explaining Sgr AE emission are discussed in §6. Finally we present our conclusions in §7.
2. NuSTAR observations
NuSTAR is the first in-orbit focusing telescope operating in the broad X-ray energy band from 3 to 79 keV (Harrison et al., 2013). Sgr AE is in the GC field, which has been monitored by NuSTAR since July 2012. In all the observations, the GC region was imaged with the two co-aligned X-ray optics/detector pairs, focal plane modules FPMA and FPMB, providing an angular resolution of Half Power Diameter (HPD) and Full Width Half Max (FWHM) over the keV X-ray band, with a characteristic spectral resolution of 400 eV (FWHM) at 10 keV. The nominal reconstructed NuSTAR astrometry is accurate to (90% confidence level) (Harrison et al., 2013), but improves significantly after image registration ().
During the NuSTAR GC monitoring campaign, three observations were centered on Sgr A*, and six observations were conducted in 2012 as part of a broader GC survey. In addition, NuSTAR triggered ToO observations of the newly discovered magnetar SGR J174529 near Sgr A* in 2013 (Mori et al., 2013, Kaspi et al. submitted). Sgr AE was fully captured in six observations, listed in Table 1, resulting in a total exposure time of 338.5 ks. We analyzed all the data sets for imaging, spectral and timing information. The data were reduced and analyzed using the NuSTAR Data Analysis Software NuSTARDAS v.1.1.1. and HEASOFT v. 6.13, and filtered for periods of high instrumental background due to South Atlantic Anomaly (SAA) passages and known bad detector pixels. Photon arrival times were corrected for on-board clock drift and precessed to the Solar System barycenter using the JPL-DE200 ephemeris and the coordinates of the Chandra peak emission of the G359.890.08 at RA=, Dec= (J2000.0) (Lu et al., 2003).
| Observation | Start Date | Exposure | Target |
|---|---|---|---|
| ID | (UTC) | (ks) | |
| 30001002001 | 2012 07 20 | 154.22 | Sgr A* |
| 30001002004 | 2012 10 16 | 49.56 | Sgr A* |
| 40010001002 | 2012 10 13 | 23.91 | GC Survey |
| 40010002001 | 2012 10 13 | 24.22 | GC Survey |
| 30001002006 | 2013 04 27 | 36.99 | Magnetar ToO |
| 80002013002 | 2013 04 27 | 49.60 | Magnetar ToO |
3. Morphology
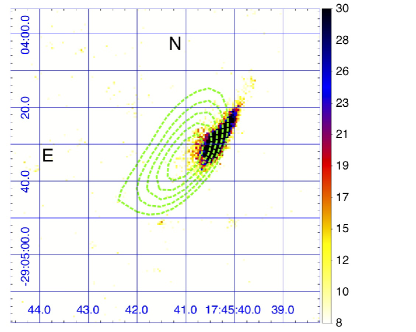
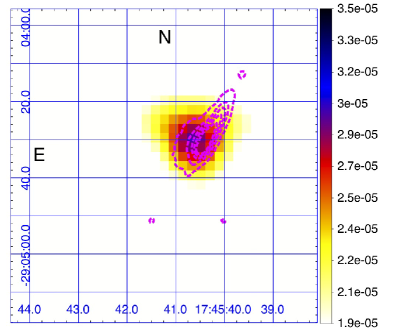
We made NuSTAR mosaiced images to illustrate the morphology of the Sgr AE region based on the following steps. We first registered images using bright sources available in individual observations (Nynka et al., 2013). The resulting offsets were used to correct narrow band images which were exposure-corrected and combined. Because the elongation perpendicular to the Galactic plane is not resolved by NuSTAR below 10 keV, we also made Chandra mosaiced images to illustrate the wisp-like shape of Sgr AE. The Chandra image was made from all the archived Chandra data between 1999-09-21 and 2012-10-31 available for Sgr AE. Individual observations were registered to a common astrometric frame and merged. In total, the resulting Chandra image includes 1.8 Ms and 3.4 Ms of ACIS-I and HETG 0th order data, respectively. To compare with the radio morphology, we made 20-cm continuum contours of Sgr AE out of the VLA 20-cm continuum map from Yusef-Zadeh et al. (1984). Figure 1 (right panel) shows the keV NuSTAR mosaic overlaid with the Chandra keV contours. Detection of Sgr AE in the 1050 keV energy band is consistent with a point source. The high energy ( keV) centroid lies closer to the south-east end of the filament, consistent with the position of the low energy ( keV) centroid. in Figure 1 (left panel) we show the Chandra 210 keV image overlaid with the VLA 20-cm contours to illustrate the filament shape and the offset between the radio and X-ray emission.
4. Spectroscopy
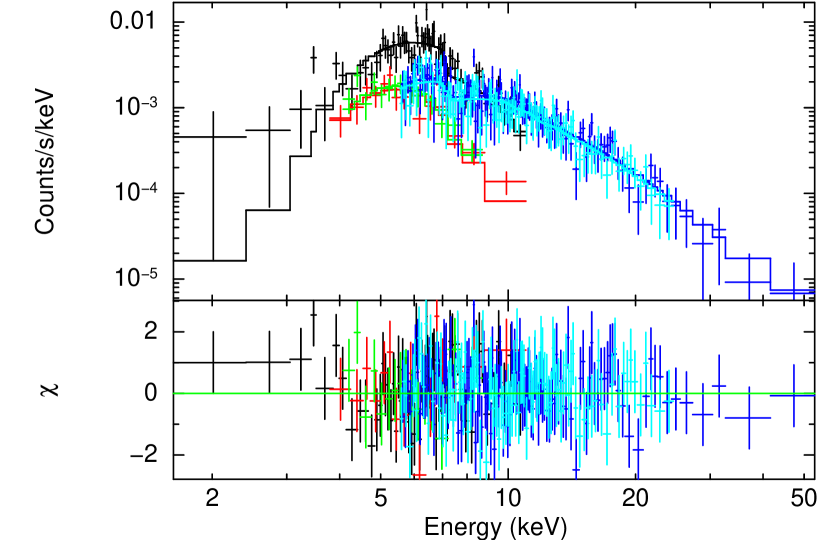
We analyzed the full spectral data from the six observations using an extraction region of 60′′ in radius centered on Sgr AE. Local background was extracted from individual observations. We joint-fitted the data with XMM-Newton observations to better constrain the column density. Two XMM-Newton (PN, MOS1 and MOS2) observations (obsID 0658600101 and 0658600201) were used, yielding a 102.5 ks exposure time in total. The data were proceeded with XMM-Newton Scientific Analysis System SAS version 13.0.0. A 40′′ radius aperture was used to extract source photons, and the background spectra were extracted from local surrounding regions. Joint spectral analysis was done in the keV band for XMM-Newton and keV band for NuSTAR data using XSPEC version 12.8.0 (Arnaud, 1996).
The spectra up to keV are well-fit ( for 298 DoF) by a simple absorbed power-law model with photon index and , using the Tbabs absorption model with Verner et al. (1996) atomic cross sections and Wilms et al. (2000) abundances (see Table 2). The updated abundances increase the derived absorption column density by a factor of two compared to previous measurements (Sakano et al., 2003; Lu et al., 2003; Yusef-Zadeh et al., 2005; Johnson et al., 2009). The high column density supports Sakano’s argument that the source is embedded or behind the 20 km cloud M0.130.08. The keV flux is erg cm-2 s-1, corresponding to a luminosity erg s-1 at 8.0 kpc. The fitting result is consistent with previous measurements (Sakano et al., 2003; Lu et al., 2003; Yusef-Zadeh et al., 2005), while the photon index is much better constrained. The featureless spectra (Figure 2) also demonstrate a proper background subtraction, lacking the 6.7 keV line from the GC diffuse emission. This agrees with Chandra and XMM-Newton measurements, where likewise no line features were detected.
| Parameter | Value |
|---|---|
| (1023 cm-2) | |
| flux (erg/cm2/s) | |
| (DoF) | 0.91 (298) |
Note. — is the column density, is the photon index of the power-law. The keV flux is given. The goodness of fit is evaluated by the reduced and the degrees of freedom is given in parentheses. The errors are 90% confidence.
5. Pulsation Search
Although the lack of evidence for a point source in the Chandra energy band argues against a pulsar powering G359.890.08, we nevertheless searched the unexplored NuSTAR data above 10 keV for a coherent signal. The high time-resolution of the NuSTAR data allows a search for pulsations with ms, covering the expected range for an isolated rotation-powered pulsar. For each observation listed in Table 1 we generated light curves by extracting photons in the keV range from an radius aperture centered on the source, to optimize the signal-to-noise ratio. We searched each light-curve for significant power from a coherent signal using a fast Fourier transform (FFT) sampled at the Nyquist frequency. To account for possibly significant spin-down of a highly energetic pulsar during the observation span of the longest observations (ObsID 30001002001), we performed an “accelerated” FFT search. This required four frequency derivative steps to be sensitive to erg s-1.
From a search of all the observations, the most significant signal has a power of for ObsID 30001002001, corresponding to a probability of false detection of for search trials. The resulting period is not reproduced in the other observations. We conclude that no pulsed X-ray signal is detected in the keV band from G359.890.08. After taking into account the local background, estimated from a annulus region around the source, we place an upper limit on the pulse fraction at the 99.73% confidence level () of for a blind search for a sinusoidal signal ms.
6. Discussion
6.1. PWN Scenario
The featureless power-law spectrum extending up to keV is consistent with synchrotron emission. Using the most recent measurement of Sgr AE radio spectral index (-0.17, Yusef-Zadeh et al., 2005), the steepening in the spectral index is , consistent with the synchrotron picture suggested by Sakano et al. (2003) and Yusef-Zadeh et al. (2005). Assuming a magnetic field of 100 G 300 G as estimated by Yusef-Zadeh et al. (2005) and Ho et al. (1985) respectively, TeV electrons are required to generate up to 50 keV synchrotron emission. The flux of Sgr AE has maintained the same level from 2003 to 2013; thus, there must be continuous injection of relativistic electrons considering the yr cooling lifetime of TeV electrons emitting hard X-rays through synchrotron radiation. One explanation for the origin of the required high-energy electrons is the PWN picture proposed by Lu et al. (2003). In this scenario, the putative pulsar detected with a signal-to-noise ratio of is moving north-west supersonically, generating the X-ray tail behind it to south-east. The authors also pointed out that the offset between the radio and X-ray emission (Figure 1) can be explained by a ram-pressured confined PWN, because the radio emission comes from accumulated radio synchrotron particles (with longer lifetimes than X-ray synchrotron particles) over a longer history of the PWN, in a region close to where the pulsar was born and offset from the X-ray feature. However, two X-ray observation results conflict with this scenario. First, the point source interpreted as the pulsar was not detected in deeper Chandra observations (Yusef-Zadeh et al., 2005; Johnson et al., 2009). Second, the centroid of the higher energy emission (10 keV) sits close to the southeast end of the filament, ( at 8.0 kpc) from the putative point source. If the point source is indeed a pulsar powering the PWN, the TeV electrons in the post-shock outflow can only travel up to given the post-shock speed of (Kennel & Coroniti, 1984) before losing most of their energy through synchrotron emission. Thus, the hard X-ray emission should be produced in the vicinity of the termination shock around the pulsar, which is not consistent with observations. Thus, both the NuSTAR hard X-ray observations and the deep Chandra observations argue against the PWN picture with a pulsar moving northwest.
But can Sgr AE be a PWN moving southeast? Although it is consistent with the fact that the hard X-ray centroid sits close to the southeast end of the PWN, there is no PWN with radio emission leading the X-ray head based on investigations of PWNe in the catalogue of Kargaltsev & Pavlov (2008). Non-detection of a pulsar from both the image and the timing analysis also does not support the PWN scenario.
Another powerful argument against the PWN picture comes from the radio morphology of Sgr AE. The 20-cm continuum map (Fig. 21, Fig. 22 in Yusef-Zadeh et al. 2004) shows two long and highly curved filamentary structures, Sgr AE and Sgr AF. Sgr AF is not detected by NuSTAR since its X-ray flux is about two orders of magnitude lower than that of Sgr AE (Yusef-Zadeh et al., 2005), below the NuSTAR detection threshold. A new 6-cm continuum radio map made with JVLA (B and C arrays) shows sub-arcsecond structures in the radio filaments in unprecedented detail and reveals that both Sgr AE and Sgr AF consist of a bundle of bright radio filaments that are part of a large-scale filamentary structure extending north to Sgr A East (M. Morris, private communication). Based on all these results, we suggest that Sgr AE is unlikely to be a PWN.
6.2. SNRMC Interaction
Another possible explanation of the Sgr AE emission mentioned by several authors is the shock wave front of an SNR driving through the 20 km cloud.
Having derived a power-law spectrum with photon index of from Chandra data, Yusef-Zadeh et al. (2005) suggested that particles accelerated to relativistic energies emitting X-ray synchrotron emission can be explained by Bykov et al. (2000), in which a SNR forward shock wave propagates in a molecular cloud, producing non-thermal electrons. In this model, non-thermal emission in the keV energy band comes from the low-energy tail of the non-thermal Bremsstrahlung and inverse Compton scattering (IC scattering) peaking at energies, thus producing a sharply rising spectrum (photon index ) in the X-ray band. However, the broadband NuSTAR and XMM-Newton spectra constrain the photon index to , which cannot be explained by the Bykov model.
In a more recently developed SNRMC interaction model by Tang et al. (2011), the X-ray emission comes from both primary particles and secondary electron-positron pairs produced via interactions in the shell evolving in the interstellar medium (ISM) and in the shell interacting with the molecular cloud. If the shell evolves in the molecular cloud, Bremsstrahlung and IC scattering contribute to the X-ray emission, also predicting very hard spectra similar to the Bykov model. Moreover, according to their spectral energy distribution (SED) calculation, the emission from the SNR shell evolving into the ISM is more luminous in X-rays than the shell evolving in the molecular cloud, which is not consistent with the assumption that Sgr AE is due to the SNR shell driving through the 20 km cloud. Thus this model cannot explain the Sgr AE spectra or morphology.
Current SNRMC interaction theories cannot explain the X-ray morphology or the spectra with . There is no observational evidence of shock excitation such as OH 1720 MHz masers. Further, G359.920.09 is not even a confirmed SNR, but only speculated to be a SNR based on a circular feature south of Sgr A East in the 20-cm continuum emission (Ho et al., 1985). Since there is little supporting evidence for this scenario, we conclude that Sgr AE is unlikely to be due to an SNRMC interaction.
6.3. Magnetic Flux Tube
Based on their radio morphologies, it has been pointed out that non-thermal filaments might trace the GC magnetic field lines (e.g. Yusef-Zadeh et al., 1984; Tsuboi et al., 1986). Their filamentary structures might be magnetic flux tubes, where relativistic electrons get trapped in locally enhanced magnetic fields (Boldyrev & Yusef-Zadeh, 2006) and generate synchrotron emission. Particularly for Sgr AE, the radio polarization detection suggests that the local magnetic field lines are parallel to the filament (Ho et al., 1985), which is consistent with this picture. The Sgr AE radio structure, a bundle of filaments revealed by the new 6-cm continuum map, also supports the magnetic flux tube interpretation. The more compact X-ray region compared to the radio wisp region, and the point-like X-ray emission above 10 keV compared to the elongated feature below 10 keV can be explained by synchrotron cooling losses. The offset between radio and X-ray emission could be due to differing spatial distributions of GeV and TeV electrons.
A persistent problem with the magnetic flux tube hypothesis has been the origin of the high energy electrons. Magnetic reconnection zones formed in collisions between magnetic flux tubes and molecular clouds have been proposed as a mechanism for accelerating electrons to high energies (e.g. Lieb et al., 2004). Linden et al. (2011) summarized problems with this theory, one of which is that collisional reconnection results in a maximum electron energy of less than 10 MeV, insufficient to produce the observed X-rays by synchrotron radiation.
We propose two possible high energy electron sources. Bamba et al. (2010) reported Suzaku observations of old PWNe with ages up to kyr and radii up to pc. They showed that the X-ray sizes of the PWNe increase with the characteristic age of the host pulsar. In order to explain the observed correlation between the extended X-ray emission and pulsar age, they noted that the magnetic field must decrease with time. When the PWN magnetic field strength decays to a few G (comparable to the GC magnetic field strength), TeV electrons can diffuse up to a few tens of pc with enough energy to emit synchrotron X-rays. No such old extended PWNe have been observed near the GC, which could be due to the strong GC diffuse emission. Taking the PWN associated with the 51 kyr old pulsar PSR J18091917 for example, the observed PWN size is pc (Bamba et al., 2010). The surface brightness of its large-scale extended emission is in 0.87 keV (Kargaltsev & Pavlov, 2007), an order of magnitude lower than the GC diffuse emission surface brightness of in the same energy band (Muno et al., 2004). If such low surface brightness PWNe exist in the GC, they are very hard to resolve from the GC diffuse emission. However, if the relativistic electrons were to get trapped in locally enhanced magnetic fields, the synchrotron emission would be enhanced. With an electron spectral index , synchrotron emissivity is proportional to . Thus, when the magnetic field strength increases from the large-scale GC magnetic field of G (e.g. Tsuboi et al., 1985) to the local Sgr AE magnetic field of G (Yusef-Zadeh et al., 2005; Ho et al., 1985), the synchrotron emission should be enhanced by a factor of , i.e. in the case of PWN around PSR J18091917, its surface brightness is enhanced to , significantly higher than the GC diffuse emission. Thus, old extended PWNe near the GC could serve as TeV electron sources for magnetic flux tubes. Besides Sgr AE, there are several fainter non-thermal filaments detected by NuSTAR above 10 keV, which could potentially be explained by this scenario as well.
Another possible TeV electron source is a molecular cloud illuminated by cosmic rays (CRs) from nearby CR accelerators such as SNRs or Sgr A* (Aharonian & Neronov, 2005; Aharonian et al., 2006). CR protons that reach the molecular cloud produce secondary electrons inside the cloud. The secondary electrons with particle energy between MeV and TeV can quickly escape the cloud because their diffuse propagation timescale to escape the cloud is shorter than the energy loss timescale (Gabici et al., 2009). Current theoretical models do not specifically predict the flux of the electrons escaping from the 20 km cloud. Extending the models to this scenario would be informative. However, there are phenomenological predictions of such a scenario. In particular, we expect correlations between hard X-ray emission and magnetic flux tubes associated with MCs. Indeed there is some evidence of such a correlation from the preliminary analysis of NuSTAR GC survey data (Hailey et al. in prep.).
7. Summary
The NuSTAR detection of Sgr AE up to keV is the first X-ray detection of a non-thermal filament at 10 keV. The featureless power-law model with a photon index of confirms a non-thermal emission mechanism. We present three possible scenarios, a PWN, SNRMC interactions and a magnetic flux tube. We conclude that Sgr AE is unlikely to be a PWN based on its radio and X-ray morphology. The observations cannot be explained by SNRMC interaction theories. Thus we propose Sgr AE could be a magnetic flux tube which traps TeV electrons from old extended PWNe or nearby molecular clouds illuminated by cosmic rays accelerators like SNRs or Sgr A*. Finally, several fainter non-thermal filaments are also detected above 10 keV by NuSTAR, showing some evidence of a correlation between hard X-rays and molecular clouds.
References
- Aharonian & Neronov (2005) Aharonian, F., & Neronov, A. 2005, Ap&SS, 300, 255
- Aharonian et al. (2006) Aharonian, F., Akhperjanian, A. G., Bazer-Bachi, A. R., et al. 2006, Nature, 439, 695
- Arnaud (1996) Arnaud, K. A. 1996, in Astronomical Society of the Pacific Conference Series, Vol. 101, Astronomical Data Analysis Software and Systems V, ed. G. H. Jacoby & J. Barnes, 17
- Bamba et al. (2010) Bamba, A., Anada, T., Dotani, T., et al. 2010, ApJ, 719, L116
- Boldyrev & Yusef-Zadeh (2006) Boldyrev, S., & Yusef-Zadeh, F. 2006, ApJ, 637, L101
- Bykov et al. (2000) Bykov, A. M., Chevalier, R. A., Ellison, D. C., & Uvarov, Y. A. 2000, ApJ, 538, 203
- Coil & Ho (2000) Coil, A. L., & Ho, P. T. P. 2000, ApJ, 533, 245
- Gabici et al. (2009) Gabici, S., Aharonian, F. A., & Casanova, S. 2009, MNRAS, 396, 1629
- Harrison et al. (2013) Harrison, F. A., Craig, W. W., Christensen, F. E., et al. 2013, ArXiv e-prints, arXiv:1301.7307
- Ho et al. (1985) Ho, P. T. P., Jackson, J. M., Barrett, A. H., & Armstrong, J. T. 1985, ApJ, 288, 575
- Johnson et al. (2009) Johnson, S. P., Dong, H., & Wang, Q. D. 2009, MNRAS, 399, 1429
- Kargaltsev & Pavlov (2007) Kargaltsev, O., & Pavlov, G. G. 2007, ApJ, 670, 655
- Kargaltsev & Pavlov (2008) Kargaltsev, O., & Pavlov, G. G. 2008, in American Institute of Physics Conference Series, Vol. 983, 40 Years of Pulsars: Millisecond Pulsars, Magnetars and More, ed. C. Bassa, Z. Wang, A. Cumming, & V. M. Kaspi
- Kennel & Coroniti (1984) Kennel, C. F., & Coroniti, F. V. 1984, ApJ, 283, 694
- Lang et al. (1999) Lang, C. C., Morris, M., & Echevarria, L. 1999, ApJ, 526, 727
- Lieb et al. (2004) Lieb, S., Lesch, H., & Birk, G. T. 2004, A&A, 419, 161
- Linden et al. (2011) Linden, T., Hooper, D., & Yusef-Zadeh, F. 2011, ApJ, 741, 95
- Lu et al. (2003) Lu, F. J., Wang, Q. D., & Lang, C. C. 2003, AJ, 126, 319
- Lu et al. (2008) Lu, F. J., Yuan, T. T., & Lou, Y.-Q. 2008, ApJ, 673, 915
- Mori et al. (2013) Mori, K., Gotthelf, E. V., Zhang, S., et al. 2013, ApJ, 770, L23
- Muno et al. (2008) Muno, M. P., Baganoff, F. K., Brandt, W. N., Morris, M. R., & Starck, J.-L. 2008, ApJ, 673, 251
- Muno et al. (2004) Muno, M. P., Baganoff, F. K., Bautz, M. W., et al. 2004, ApJ, 613, 326
- Nynka et al. (2013) Nynka, M., Hailey, C. J., Mori, K., et al. 2013, ArXiv e-prints, arXiv:1311.1832
- Pedlar et al. (1989) Pedlar, A., Anantharamaiah, K. R., Ekers, R. D., et al. 1989, ApJ, 342, 769
- Sakano et al. (2003) Sakano, M., Warwick, R. S., Decourchelle, A., & Predehl, P. 2003, MNRAS, 340, 747
- Tang et al. (2011) Tang, Y. Y., Fang, J., & Zhang, L. 2011, ApJ, 739, 11
- Tsuboi et al. (1985) Tsuboi, M., Inoue, M., Handa, T., Tabara, H., & Kato, T. 1985, PASJ, 37, 359
- Tsuboi et al. (1986) Tsuboi, M., Inoue, M., Handa, T., et al. 1986, AJ, 92, 818
- Verner et al. (1996) Verner, D. A., Ferland, G. J., Korista, K. T., & Yakovlev, D. G. 1996, ApJ, 465, 487
- Wilms et al. (2000) Wilms, J., Allen, A., & McCray, R. 2000, ApJ, 542, 914
- Yusef-Zadeh & Morris (1987) Yusef-Zadeh, F., & Morris, M. 1987, ApJ, 320, 545
- Yusef-Zadeh et al. (1984) Yusef-Zadeh, F., Morris, M., & Chance, D. 1984, Nature, 310, 557
- Yusef-Zadeh et al. (2004) Yusef-Zadeh, F., Hewitt, J. W., & Cotton, W. 2004, ApJS, 155, 421
- Yusef-Zadeh et al. (2005) Yusef-Zadeh, F., Wardle, M., Muno, M., Law, C., & Pound, M. 2005, Advances in Space Research, 35, 1074