Hubble Space Telescope Far Ultraviolet Spectroscopy of the Recurrent Nova T Pyxidis
Abstract
With six recorded nova outbursts, the prototypical recurrent nova T Pyxidis is the ideal cataclysmic variable system to assess the net change of the white dwarf mass within a nova cycle. Recent estimates of the mass ejected in the 2011 outburst ranged from a few to , and assuming a mass accretion rate of yr-1 for 44yrs, it has been concluded that the white dwaf in T Pyx is actually losing mass. Using NLTE disk modeling spectra to fit our recently obtained Hubble Space Telescope (HST) COS & STIS spectra, we find a mass accretion rate of up to two orders of magnitude larger than previously estimated. Our larger mass accretion rate is due mainly to the newly derived distance of T Pyx (4.8kpc, larger than the previous 3.5kpc estimate), our derived reddening of E(B-V)=0.35 (based on combined IUE and GALEX spectra) and NLTE disk modeling (compared to black body and raw flux estimates in earlier works). We find that for most values of the reddening () and white dwaf mass () the accreted mass is larger than the ejected mass. Only for a low reddening ( and smaller) combined with a large white dwaf mass ( and larger) is the ejected mass larger than the accreted one. However, the best results are obtained for a larger value of the reddening.
1 INTRODUCTION
Cataclysmic variables (CVs) are binaries in which a white dwarf (WD; the primary) accretes hydrogen-rich material from a Roche-lobe filling secondary star. When sufficient matter is accreted, it undergoes a thermonuclear runaway (TNR): the classical nova eruption. The TNR ignition starts at the base of the accreted shell when the pressure and temperature are high enough for the CNO cycle burning of hydrogen (Paczyński, 1965; Starrfield et al., 1972). CVs with recorded multiple nova outbursts are classified as recurrent novae (RNe). In RNe, a large mass WD and a high mass accretion rate are believed to lead to the short recurrence time between nova outbursts.
T Pyxidis, the prototypical RN, is known to have erupted (Webbink et al., 1987; Schaefer et al., 2013) in 1890, 1902, 1920, 1944 and 1967 - roughly every 20 yr. It erupted again in April 2011 (Waagan et al., 2011), after a lapse of 44 years. The mass accreted between eruptions and the mass ejected during eruptions determine the net change in the WD mass. If the WD mass increases, then eventually it could reach the Chandrasekhar limit and explode as a type Ia supernova (SN Ia; Whelan & Iben (1973); Iben & Tutukov (1984)). Due to its relatively frequent outbursts, T Pyx offers a promising possiblity of assessing the WD mass change within a nova cycle. Recent works (Selvelli et al., 2008; Patterson et al., 2013; Nelson et al., 2012) have claimed that the WD in T Pyx is losing mass and will never become a SN Ia. In this Letter, we present a synthetic spectroscopic analysis of the first far ultraviolet (FUV; 900Å- 1700Å) spectra of T Pyx obtained with Hubble. Our objective is to estimate the rate of mass accretion following its July 2011 outburst and compare it with estimates of the mass accretion rate in the quiescent interval preceding the July 2011 outburst.
2 SPECTRAL ANALYSIS
The most direct and accurate way to determine the mass accretion rate of a CV accreting at a high mass accretion rate, is to carry out an analysis and modeling of its ultraviolet (UV; 900Å- 3200Å) spectrum. This is because at a high mass accretion rate (yr-1), an accretion disk around a WD emits more than 50% of its luminosity in the UV band (900Å - 3200Å ) and contributes much less to the optical. A significant fraction of the remaining energy is emitted in the extreme UV (EUV; 100Å- 900Å), and that fraction increases with increasing mass accretion rate.
2.1 Hubble STIS + COS Spectroscopy of T Pyx
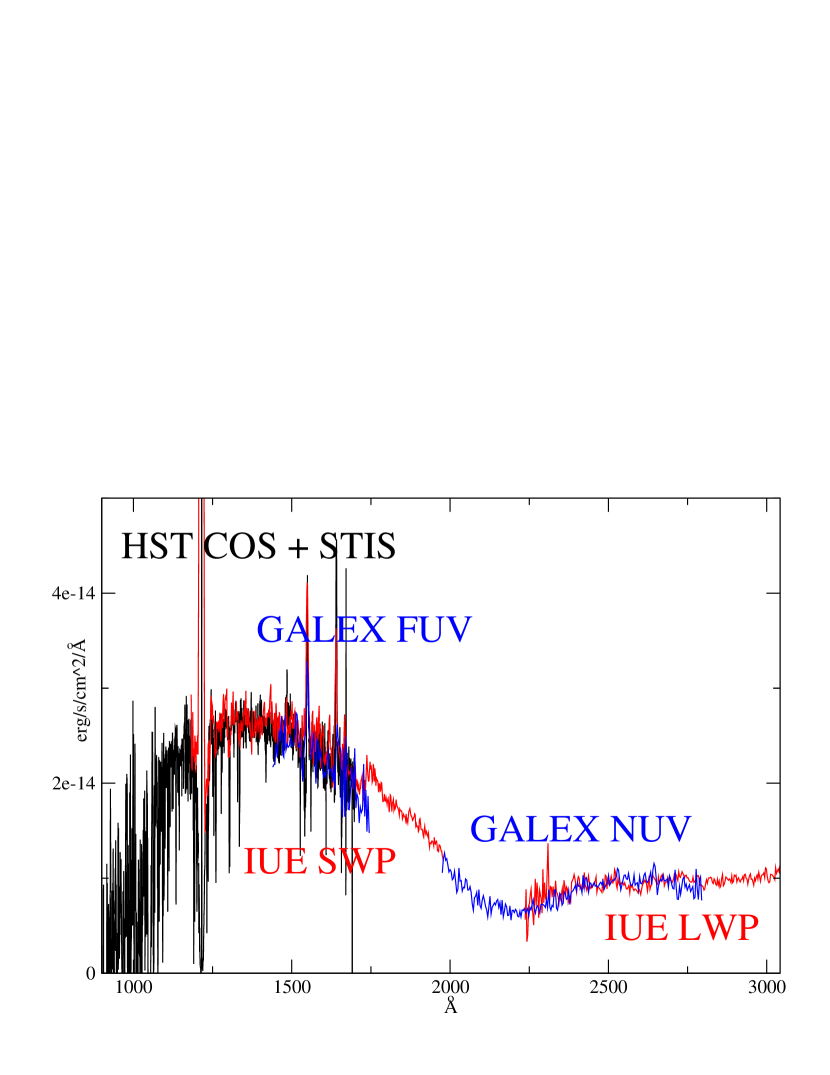
T Pyx was observed in the UV (1150Å- 3200Å) first with the International Ultraviolet Expolorer (IUE). We co-added and combined 29 IUE spectra obtained with the Short Wavelength Prime (SWP; 1150Å - 2000Å ) camera and 11 IUE spectra obtained with the Long Wavelength Prime (LWP; 1850Å - 3200Å ) camera. These spectra, obtained between 1986 and 1996, exhibit the same continuum flux level. The IUE spectra show that the UV continuum of T Pyx remained nearly constant in slope and intensity, without any indication of long term trends, while the emission lines exhibit changes in both intensity and detectability as already mentioned by Gilmozzi & Selvelli (2007).
T Pyx was observed with the Galaxy Evolution Explorer (GALEX) at the end of 2005. The GALEX spectrum is composed of two spectra, one in the FUV band (1350Å -1800Å) and one in the near UV (NUV) band (1800Å -3000Å). In spite of detector edge problems, the GALEX and IUE spectra match remarkably well in those regions away from the edges, in agreement with the suggestion (Gilmozzi & Selvelli, 2007) that the UV continuum remains constant over the years. This is an indication that the mass accretion rate itself is constant, since the UV emission comes mainly from the accretion disk. Consequently, the steady decline of the optical magnitude of T Pyx, observed since 1890, does not indicate a decrease in the mass accretion rate.
FUV (1150Å- 2250Å) spectra of T Pyx were obtained with the HST/Space Telescope Imaging Spectrograph (STIS) during the eruption and the decline to quiescence (Shore et al., 2013). We further followed T Pyx into quiescence, obtaining HST/STIS spectra (1150Å - 1700Å ) together with HST/Cosmic Origins Spectrograph (COS) spectra (900Å - 1200Å ) in March 2012, December 2012 and July 2013. While the March 2012 spectrum still exhibits strong emission lines and a flux larger than the pre-outburst flux level, the December 2012 and July 2013 spectra have weak emission lines and have reached the pre-outburst flux level of the IUE and GALEX spectra. Except for small differences in emission lines, the December 2012 and July 2013 HST spectra are identical, and show that T Pyx has now returned precisely to its pre-outburst value (i.e. IUE flux level). This indicates that the mass accretion rate has returned to its pre-outburst value.
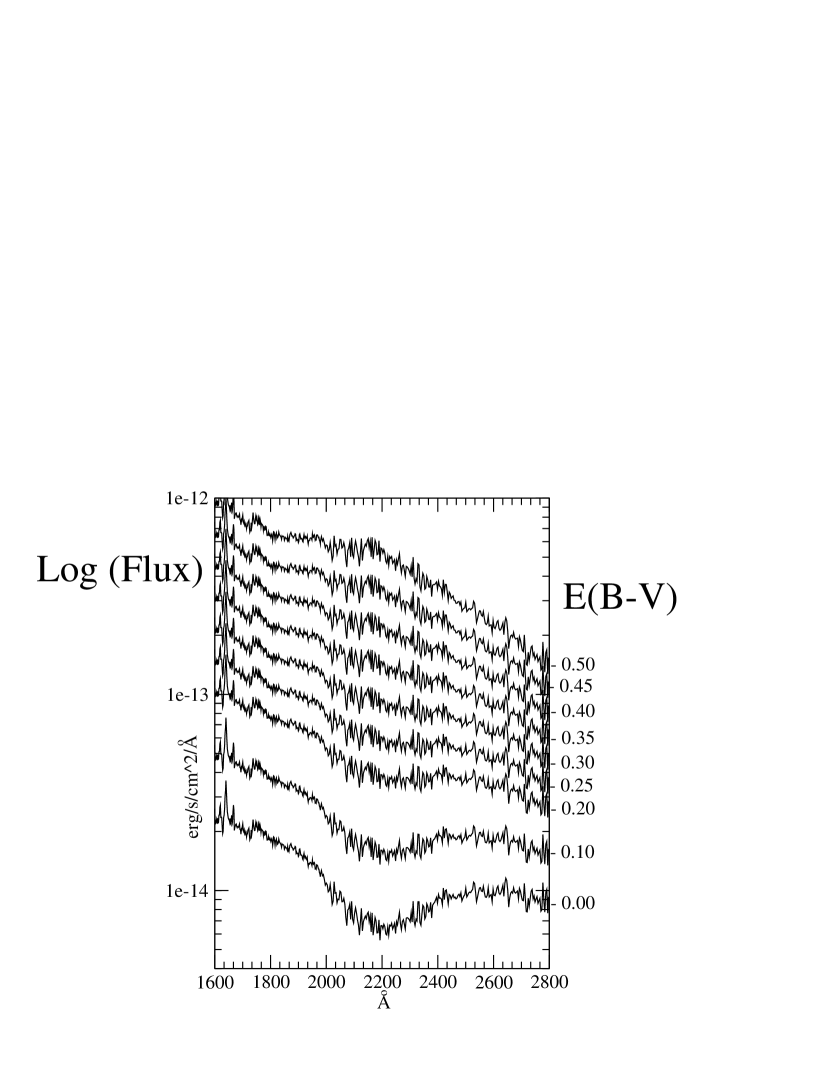
Since the December 2012 and July 2013 HST spectra are almost identical, we co-added them to improve the signal-to-noise (S/N) in preparation for the spectral model fit. In Fig.1 we show the quiescent co-added IUE, GALEX and co-added HST spectra after removal of the noisy detector edges. The spectra, though acquired with different telescopes and instruments, match accurately. The minimum near 2175Å is due to interstellar extinction. Since the GALEX spectrum is the most reliable in that wavelength region, we combine it with the IUE co-added spectrum to determine E(B-V). We then deredden the combined spectrum for different values of E(B-V). The E(B-V) value for which the 2175Å feature disappears, E(B-V)=0.35 (see Fig.2), is taken as the E(B-V) value towards T Pyx, in agreeement with Bruch et al. (1981). We use this value to deredden the IUE, GALEX and HST spectra, but we also consider the effects of different reddening values on our results.
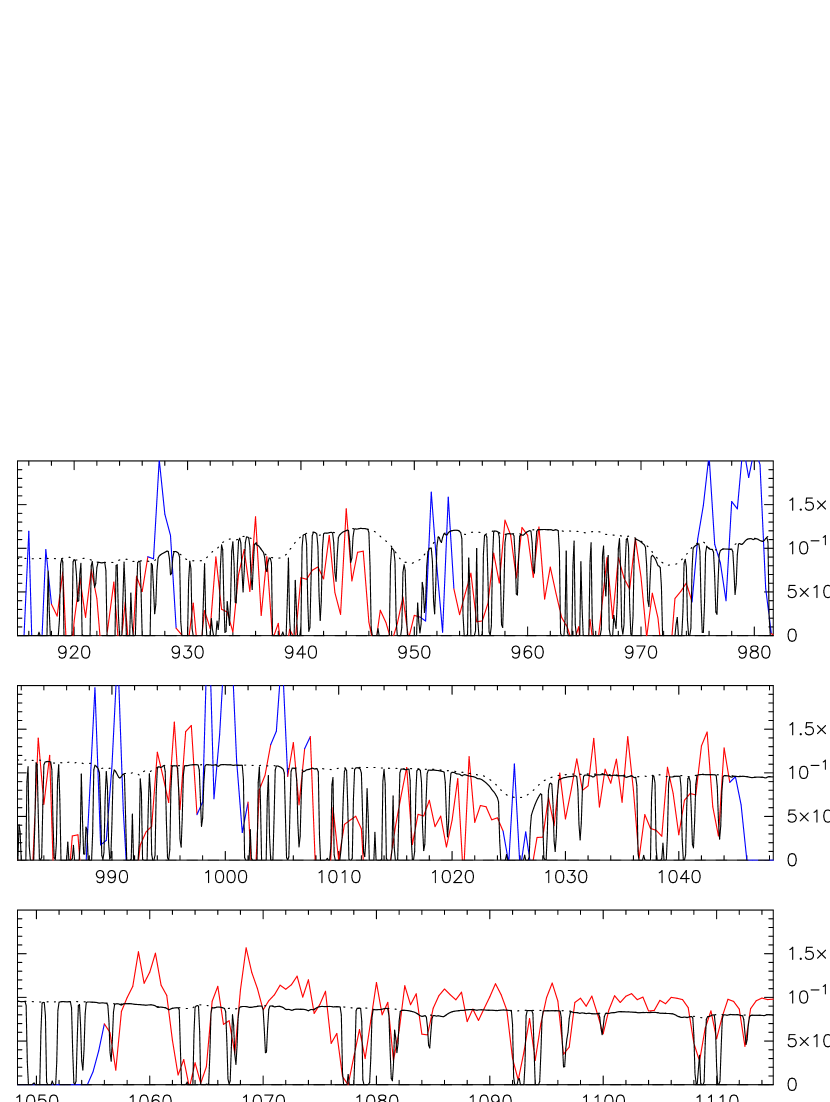
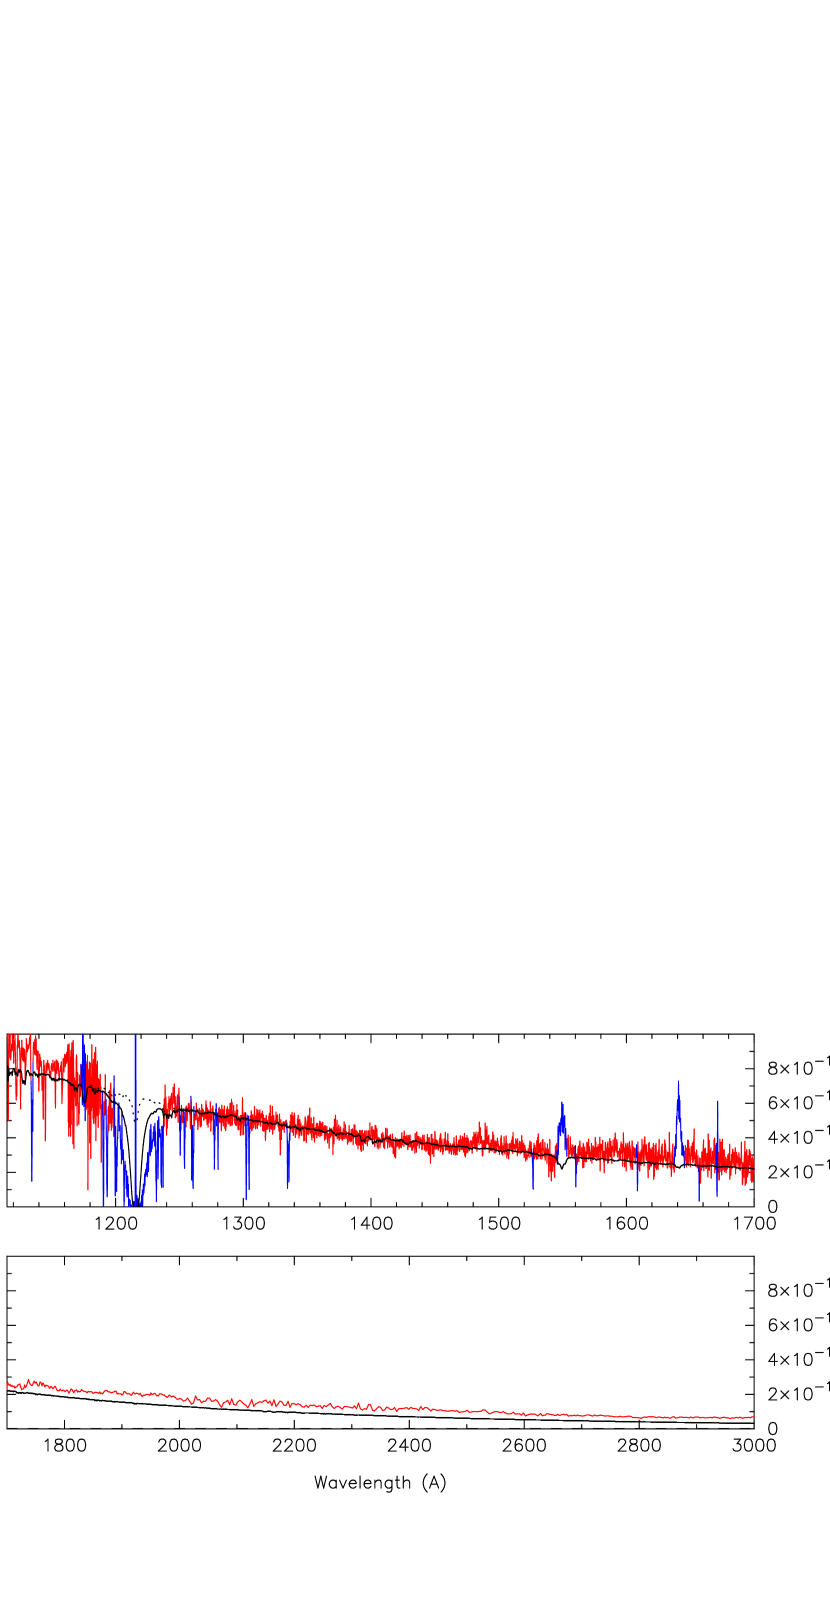
We combined the HST (STIS+COS), IUE and GALEX spectra, excluding the noisy portions, and obtained a spectrum from Å to Å. While we modeled the entire spectrum, we never expected the model to fit in the NUV range (2000Å- 3000Å), because we only modeled the hottest component of the system, the accretion disk, which mainly contributes to the FUV (900Å- 1700Å) and extreme UV (100Å- 900Å). The shorter wavelengths of the spectrum covered by COS are crucial in the determination of the mass accretion rate as this is where the spectrum is expected to peak if the accretion rate is large.
2.2 Modeling
The disk is the standard disk model (Shakura & Sunyaev, 1973; Pringle, 1981), and for a given mass accretion rate and a given WD mass it is divided in rings with temperature located at , where , and is the radial temperature profile of the standard disk model (e.g. Pringle (1981)). Each ring is modeled using the stellar atmosphere code TLUSTY, then a synthetic spectrum is computed with the code SYNSPEC for each ring, and the spectra are finally combined together with DISKSYN taking into account Keplerian broadening, inclination and limb darkening (Hubeny, 1988; Hubeny & Lanz, 1995; Wade & Hubeny, 1998). For rings with K TLUSTY and SYNSPEC are run with basic NLTE options.
To emphasize the importance of modeling the disk in the UV, we use our disk modeling to check what fraction of the disk luminosity is emitted in the UV band (900Å 3200 Å). For a cannonical WD mass of , at a mass accretion rate of yr-1 the disk emits 58% of its luminosity in the UV band (), and most of the remaining luminosity (40%) is emitted at longer wavelengths. As the mass accretion rate increases, so does the temperature in the disk. At the disk emits 66% of its luminosity in the UV, about 30% at longer wavelengths and only a few percent in the EUV (Å). As the mass accretion rate keeps increasing, the disk starts emitting more flux in the EUV and less flux in the UV and optical, as the Planckian peak shifts to shorter and shorter wavelengths. At yr-1, the disk emits 50% in the UV with about 25% emitted at shorter wavelengths and 25% emitted at longer wavelengths. The amount emitted in the visual band is just a fraction of the 25% and is always much less than the amount emitted in the UV band. This justifies the modeling of accretion disk in the UV band. The main source of the optical luminosity is not from the disk, but most likely arises from the contribution from the hot spot, the secondary, and possibly from some of the nebular material.
From theoretical predictions, to reproduce an outburst every 20yrs or so, the WD mass in T Pyx is expected to be very large (almost near-Chandrasekhar). On the other hand, the derived mass ratio in the system together with an anticipated secondary mass of imply a WD mass of only (Uthas et al., 2010). However, the secondary has never been spectroscopically detected to verify the assumption . Consequently, due to the uncertainty in the WD mass, we generated disk models for an accreting WD with a near Chandrasekhar mass of as expected from the observed short recurrence time of T Pyx (Starrfield et al., 1985; Webbink et al., 1987; Schaefer et al., 2010), and for a lower mass WD, , as inferred by Uthas et al. (2010). The latter low mass, if confirmed, raises serious problems for the theory of recurrent shell flashes. We varied the mass accretion rate, , from yr-1 to yr-1. The inclination () of the system is low with a lower limit of about (Uthas et al., 2010) and an upper limit of (Webbink et al., 1987). Since we model only the continuum, the effect of the inclination on the results is very small, as long as the inclination is low. For a given WD mass (and therefore radius), the fitting of the observed spectrum with a theoretical accretion disk spectrum is carried out by scaling the theoretical flux to the distance of 4.8kpc, which has been recently derived using the light echo technique (Sokoloski et al., 2013).
3 RESULTS
We first fit the dereddened spectrum assuming E(B-V)=0.35. For the case, we found a mass accretion rate of yr-1 for and yr-1 for . The total mass accreted over 44yr (since the previous explosion) is and , for and respectively. For the case, the mass accretion rate needed to fit the spectrum increases to yr-1 and yr-1, for and respectively; and the total accreted mass becomes and . A synthetic accretion disk model spectral fit to the HST/COS spectrum is presented in Fig.3, for and an inclination of . The exact same spectral fit to the HST/STIS spectrum and combined GALEX IUE spectrum is presented in Fig.4. The synthetic spectrum is deficient in flux in the longer wavelength range, Å , indicating the possible contribution of a colder component ().
Even though we derived a reddening of 0.35, which is consistent with the originally derived E(B-V) value from the IUE data in Bruch et al. (1981), we nevertheless checked the effect of the reddening on the results (since different methods and reddening curves for evaluating E(B-V) lead to different results (e.g. Shore et al. (2013); see also Gilmozzi & Selvelli (2007)).
Based on IUE data alone, Gilmozzi & Selvelli (2007) derived a reddening value of . We therefore checked our fitting results for the value of , and we found that to fit the distance of 4.8kpc one needs a mass accretion rate of yr-1 (i=20deg). However, this synthetic spectrum does not fit the slope of the observed spectrum, the observed spectrum is too red. To fit the slope of the spectrum one needs a much lower mass accretion rate, namely yr-1, but the resultant produced flux level is lower which requires a distance to T Pyx of only 1250pc. Similar results are obtained for this reddening when assuming a 1.35 WD mass.
Next, for a larger reddening value of (Shore et al., 2013) the observed spectrum is too blue, and our models are limited by the constraint that TLUSTY does not handle mass accretion rates greater than yr-1 for a WD mass and yr-1 for a WD mass. We extrapolated linearly our results by matching flux level; namely, we assume that the flux level is a linear function of the mass accretion rate and we ignore Wien’s displacement. Since the Planckian peaks move towards shorter wavelengths as increases, this extrapolation understimates , and this effect is more pronounced as increases. Using this technique, we found that the mass accretion rate needed to fit the observed spectrum assuming for a (as in Shore et al. (2013)) is yr-1, implying a total accreted mass of . For the WD mass case, this linear extrapolation gives a mass accretion rate of yr-1 and a total accreted mass of .
4 CONCLUSIONS
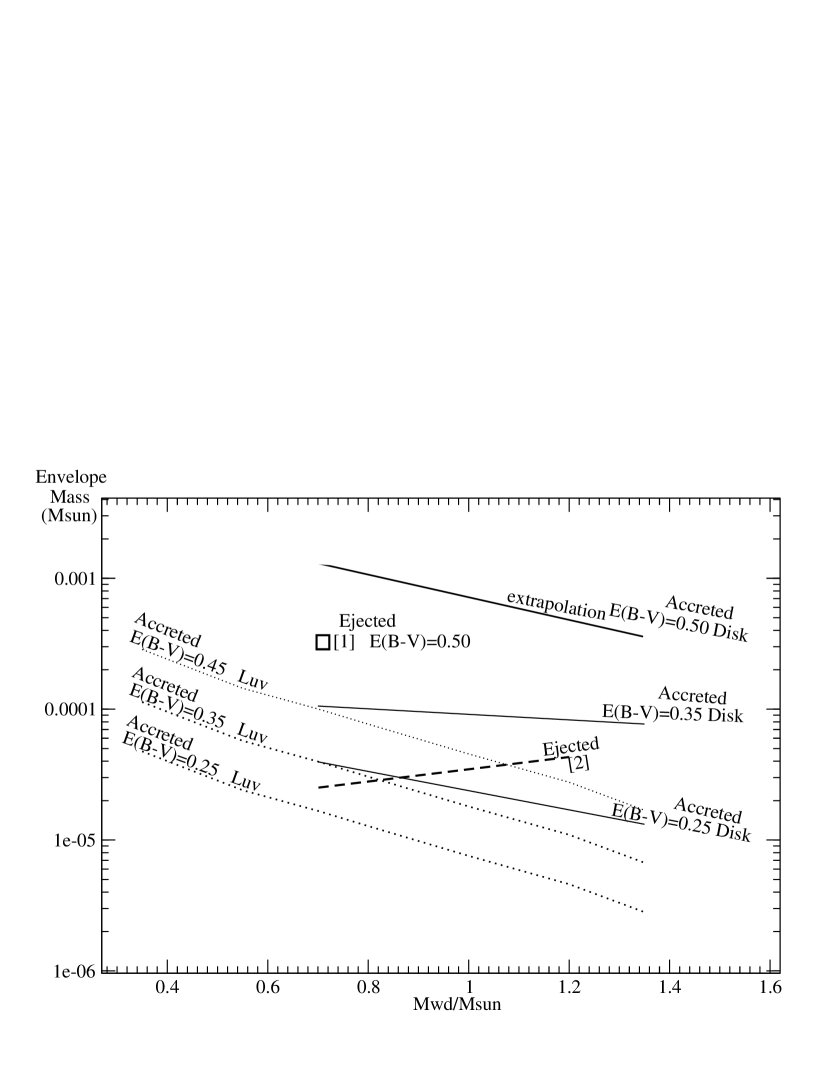
Our results are recapitulated in Fig.7, where we draw (solid lines) the mass accreted over 44 years as computed from our model fittings, for 3 different values of the reddening. We also draw (dotted line) the lower limit for the mass accreted derived from integrating the UV flux over the wavelengths 900Å to 3200Å
Since the disk at high mass accretion rate emits only a fraction of its energy in the UV (and a much smaller fraction is emitted in the optical), the integrated UV flux is clearly a lower limit for the mass accretion rate. We draw this lower limit for three different values of the reddening as well. For comparison we draw the ejecta mass as derived by radio observations by Nelson et al. (2012) (denoted with a square, #1), who assumed and E(B-V)=0.50. This ejecta mass is to be compared with our accreted mass derived from our disk modeling assuming E(B-V)=0.50. Our results show that the accreted envelope (for the particular values of the parameters) is about 4 times larger than the mass ejected as estimated by Nelson et al. (2012). On the graph, we also show the mass of the ejected envelope as estimated by Patterson et al. (2013) assuming that energy and momentum are conserved (dashed line, #2). We see that the disk model fittings imply that more mass is accreted than ejected, except when assuming a reddening of E(B-V)=0.25 in combination with a WD mass . However, for this value of the reddening, the disk model (for all WD masses considered) did not fit the observed spectrum, indicating that the reddening might indeed be larger (i.e. 0.35).
We note that the % error in the distance kpc translates into an error of the order of 20% in the mass accretion rate, which does not change our results significantly. We also emphasize that the difference between our results and previously derived mass accretion rates is due mainly to the now larger distance estimates (4.8kpc vs 3.5kpc) as well as a larger reddening (0.35 against 0.25).
Our results are: (i) the determination of the long-time-baseline accretion rate in T Pyx, using for the first time realistic disk models, (ii) the demonstration that the accretion rate in T Pyx has returned to exactly its pre-outburst UV spectral energy distribution. This accretion rate, yr-1 (and higher for increasing values of the reddening), is much higher than previously estimated.
It is possible that T Pyx sustains such a high mass accretion rate because of irradiation of the secondary star. The irradiation of the donor star by the extremely hot WD and inner disk will not only “puff up” the donor’s radius but may also drive a wind off the secondary (Knigge et al., 2000). Since the orbital period and binary separation of T Pyx are smaller than all other known recurrent novae, the effects of irradiation may be more pronounced.
Several different authors reported that quasi-static evolutionary sequences of accreting WDs expand in to red giant structures at accretion rates exceeding yr-1 (Paczyński & Zytkow, 1978; Sion et al., 1979; Iben, 1982) but other evolutionary accreting WD sequences followed hydrodynamically through multiple nova outbursts (e.g. Prialnik & Kovetz (1995); Yaron et al. (2005); Starrfield et al. (2012); Idan et al. (2013)) reveal thermonuclear shell flashes at these high rates.
References
- Bruch et al. (1981) Bruch, A., Duerbeck, H.W., Seitter, W.C. 1981, Mitt.Astr.Ges., 52, 34
- Gilmozzi & Selvelli (2007) Gilmozzi, R. & Selvelli, P. 2007, A&A, 461, 593
- Hubeny (1988) Hubeny, I. 1988, Comput. Phys. Comm., 52, 103
- Hubeny & Lanz (1995) Hubeny, I. & Lanz, T. 1995, ApJ, 439, 875
- Iben (1982) Iben, I. 1982, ApJ, 259, 244
- Iben & Tutukov (1984) Iben, I. & Tutukov, A.V. 1984, ApJS, 54, 335
- Idan et al. (2013) Idan, I., Shaviv, N.J. & Shaviv, G. 2013, MNRAS, 433, 2884
- Knigge et al. (2000) Knigge, C., King, A.R., Patterson, J. 2000, A&A, 364, L79
- Nelson et al. (2012) Nelson, T. et al. 2012, ApJ, submitted atro-Ph arXiv:1211.3112
- Paczyński (1965) Paczyński, B.1965, Acta Astron. 15, 3
- Paczyński & Zytkow (1978) Paczyński, B., & Zytkow, A.N. 1978, ApJ, 222, 604
- Patterson et al. (2013) Patterson, J. et al. 2013, ASP Conf. Ser. Stellar Novae: Past and Future Decades, ed. P.A. Woudt & V.A.R.M. Ribeiro, in press (7pp)
- Prialnik & Kovetz (1995) Prialnik, D. & Kovetz, A. 1995, ApJ, 445, 789
- Pringle (1981) Pringle, J.E. 1981, ARA&A, 19, 137
- Schaefer et al. (2010) Schaefer, B.E., Pagnotta, A. & Shara, M. 2010, ApJ, 708, 381
- Schaefer et al. (2013) Schaefer, B.E. et al. 2013, ApJ, 773, 55
- Selvelli et al. (2008) Selvelli, P., Cassatella, A., Gilmozzi, R. & González-Riestra, R. 2008, A&A, 492, 787
- Shakura & Sunyaev (1973) Shakura, N.I. & Sunyaev, R.A. 1973, A&A, 24, 337
- Shore et al. (2013) Shore, S.N. et al. 2013, A&A, 549, 140
- Sion et al. (1979) Sion, E.M., Acierno, M.J., Tomczyk, S. 1979, ApJ, 230, 832
- Sokoloski et al. (2013) Sokoloski, J. et al. 2013, ApJ, 770, L33
- Starrfield et al. (1985) Starrfield, S., Sparks, W.M. & Truran, J.W. 1985, ApJ, 291, 136
- Starrfield et al. (2012) Starrfield, S., Timmes, F.X., Iliadis, C., Hix, W.R., Arnett, W.D., Meakin, C., & Sparks, W.M. 2012, Baltic Astronomy, 21, 76
- Starrfield et al. (1972) Starrfield, S., Truran, J.W., Sparks, W.M., & Kutter, G.S. 1972, ApJ, 176, 169
- Uthas et al. (2010) Uthas, H., Knigge, C. & Steeghs, D. 2010, MNRAS, 409, 237
- Waagan et al. (2011) Waagan, E. et al. 2011, Central Bureau Electronic Telegram 2700, 1
- Wade & Hubeny (1998) Wade, R.A. & Hubeny, I. 1998, ApJ, 509, 350
- Warner (1995) Warner, B., Cataclysmic Variable Stars, Cambridge Astrop.Ser., Cambridge, NY: Cambridge Uni.Press 1995
- Webbink et al. (1987) Webbink, R.F., Livio, M., Truran, J.W. & Orio, M. 1987, ApJ, 314, 653
- Whelan & Iben (1973) Whelan, J. & Iben, I. 1973, ApJ, 186, 1007
- Yaron et al. (2005) Yaron, O., Prialnik, D., Shara, M.M. & Kovetz, A. 2005, ApJ, 623, 398
Acknowledgements This research is supported by HST grants GO-12799.01A and GO-12890.01A, both to Villanova University. Support for the analysis of the IUE and GALEX archival data was provided by the National Aeronautics and Space Administration (NASA) under grant number NNX13AF11G issued through the Office of Astrophysics Data Analysis Program (ADP) to Villanova University. P.G. thanks William P. Blair for his kind hospitality at the Henry A. Rowland Department of Physics and Astronomy at the Johns Hopkins University, Baltimore, MD. We also thank Steve Shore for his comments on the manuscript.