Performance of the Caltech Submillimeter
Observatory Dual-Color 180-720 GHz Balanced
SIS Receivers
Abstract
We report on balanced SIS receivers covering the astronomical important 180720 GHz submillimeter atmospheric window. To facilitate remote observations and automated spectral line surveys, fully synthesized local oscillators are employed. High-current-density Nb-AlN-Nb superconducting-insulating-superconducting (SIS) tunnel junctions are used as the mixing element. The measured double-sideband (DSB) 230 GHz receiver noise temperature, uncorrected for optics loss, ranges from 50 K at 185 GHz, 33 K at 246 GHz, to 51 K at 280 GHz. In this frequency range the mixer has a DSB conversion gain of 0 1.5 dB. The measured 460 GHz double-sideband receiver noise temperature, uncorrected for optics loss, is 32 K at 400 GHz, 34 K at 460 GHz, and 61 K at 520 GHz. Similar to the 230 GHz balanced mixer, the DSB mixer conversion gain is 1 1 dB. To help optimize performance, the mixer IF circuits and bias injection are entirely planar by design. Dual-frequency observation, by means of separating the incoming circular polarized electric field into two orthogonal components, is another important mode of operation offered by the new facility instrumentation. Instrumental stability is excellent supporting the LO noise cancellation properties of the balanced mixer configuration. In the spring of 2012 the dual-frequency 230/460 SIS receiver was successfully installed at Caltech Submillimeter Observatory (CSO), Mauna Kea, HI.
Index Terms:
Superconducting-Insulating-Superconducting (SIS) mixer, balanced mixers, amplitude noise rejection, Wilkinson in phase power combiner, AlN tunnel barrier, heterodyne receiver, high-current-density, multiple Andreev reflection (MAR), broadband waveguide transition, system stability, Allan variance, synthesized local oscillator (LO), quantum noise limit.I Introduction
The Caltech Submillimeter Observatory (CSO) is located on top of Mauna Kea, Hawaii, at an altitude of 4.2 km. To facilitate deep integrations, stable baselines, and automated high resolution spectral line surveys significant efforts [1, 2] have been expanded to develop a family of synthesized, remote programmable dual-color balanced SIS receivers. To this effect four tunerless balanced-input waveguide receivers have been developed to cover the important 180720 GHz frequency range [3, 4]. The new heterodyne facility instrumentation allows dual-frequency (two-color) observations in the 230/460 GHz and 345/660 GHz atmospheric windows. The 230/460 balanced receiver system has been installed and is operational at the observatory since May 2012. Unfortunately, deployment of the 345/650 balanced receiver(s) is presently on hold due to funding difficulties.
Dual-frequency observation is an important mode of operation offered by the new facility instrumentation. Dual band observations are accomplished by separating the horizontal (H) and vertical (V) polarizations of the incoming signal and routing them via folded optics to the appropriate polarization sensitive balanced mixer. Scientifically this observation mode facilitates pointing for the higher receiver band under mediocre weather conditions and a doubling of scientific throughput under good weather conditions.
Balanced configurations were chosen for their inherent local oscillator (LO) spurious tone and amplitude (AM) noise cancellation properties. (It was also judged to be an optimal compromise between scientific merit and finite funding). Unique to the CSO, wide RF bandwidth is favored [2], allowing the same science to be done with fewer instruments. In all the upgrade covers ALMA bands 59.
In principle, the balanced receiver configuration has the advantage that common mode amplitude noise in the local oscillator system is canceled, while at the same time utilizing all available LO power. Both of these features afford automation over unprecedented wide RF bandwidth, covering the entire 180720 GHz submillimeter atmospheric windows with just four LOs.
Receiver noise temperatures and in situ measured instrumental Allan Variance stability times are excellent and are consistent with the use of balanced receiver technology.
The SIS junctions are capable of a 13 GHz bandwidth, though due to band limiting isolators and low noise amplifiers the operational IF bandwidth of the CSO receivers is presently 48 GHz.
To maximize the RF bandwidth, we explore the use of high-current-density AlN-barrier SIS technology combined with a broad bandwidth full-height waveguide to thin-film microstrip transition [5]. Compared to AlOx-barriers, advantages of AlN tunnel barriers are a low RC product (increased RF bandwidth) and enhanced chemical robustness. Even if optimal RF bandwidth is not a requirement, a low RC product provides a more homogeneous frequency response and increased tolerance to errors in device fabrication.
To process the required IF bandwidth, the CSO has acquired a Fast Fourier Transformer Spectrometer (FFTS) from Omnisys Instruments, Sweden. 111 Omnisys Instruments AB., August Barks gata 6B, SE-421 32 Västra Frölunda SWEDEN. [Online] Available: http://www.omnisys.se This spectrometer facilitates 8 GHz of processing bandwidth with a resolution of 268 KHz/channel, or 3724 channels/GHz. The 8 GHz Omnisys FFTS comes in a 19” rack and has two built-in IF processor modules (48 GHz each), an embedded controller module, a synchronization module, and power supply.
II The single-balanced mixer
As discussed in [1], the single balanced mixer can be formed by connecting antipodal biased (SIS) mixers to a 180∘ or 90∘ input hybrid. The 180∘ hybrid, though having superior fundamental and intermodulation product suppression capabilities, is larger and more difficult to implement at submillimeter frequencies. At submillimeter and terahertz frequencies the harmonic and intermodulation products are however severely attenuated by the inherent device capacitance of the mixing element. For this reason, submillimeter or terahertz mixers may be configured with quadrature hybrids (Fig. 1) [6, 7] rather than the larger and more complex 180∘ hybrids couplers.

In [1] the amplitude rejection of a balanced mixer relative to an ideal single-ended mixer was derived as
| (1) |
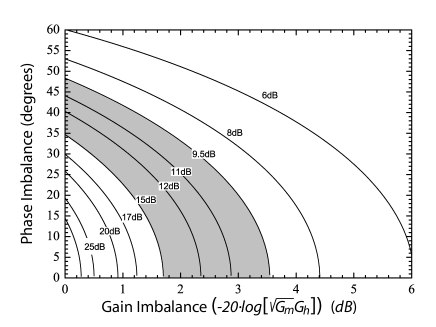
which is graphically depicted in Fig. 2. Here is the mixer gain imbalance, the quadrature hybrid imbalance, and is the combined phase error of the RF hybrid, device placement, wire bond length, and IF summing node. As will be discussed in section IV-D, the measured spurious rejection of the 230 GHz & 460 GHz balanced mixers is 9.515 dB.
III Hardware
III-A Instrument Configuration
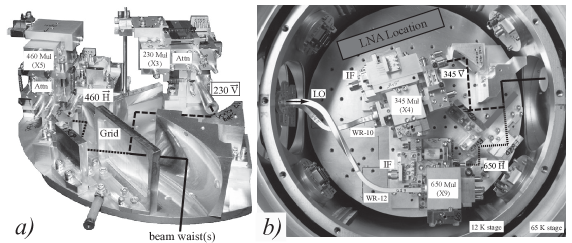
Fig 3 shows two views of the CSO dual-frequency receiver configurations. One cryostat houses the 180280 GHz / 400520 GHz balanced mixers while a second cryostat houses the 280420 GHz / 580720 GHz focal plane unit (PFU).
The 63105 GHz LO carrier signal enters the cryostat via an (inner wall) Au-plated stainless steel waveguide (WR-10/12). The submillimeter multipliers 222 Virginia Diodes Inc., 979 2nd Street SE, Suite 309 Charlottesville, VA 22902, USA. [Online] Available: http://http://vadiodes.com// are mounted on the 15 K stage of a Precision Cryogenics 333 Precision Cryogenics Systems Inc., 7804 Rockville Road, Indianapolis, IN 46214, USA. [Online] Available: http://www.precisioncryo.com/ hybrid cryostat. The latter is important in that multipliers are inefficient with most of the RF input power converted into heat.
Each cryostat receives two (orthogonally polarized) beams from the sky, which are routed via a cold wire-grid to the appropriate mixer. Keeping the RF path length to a minimum the calculated intrinsic mixer block waveguide loss (4K) ranges from 0.18 dB (24.2 mm) at 230 GHz to 0.34 dB (9.3 mm) at 650 GHz. This technique facilitates dual-frequency (2 color) observations, improves observing efficiency, and assists pointing of the high frequency receivers in mediocre weather.
We estimate that the required LO pump power ranges from 100-1000 nW for each (twin) SIS junction depending on LO frequency (= 0.78 on average) [9]. And since two SIS junctions are used as part of the balanced configuration we require, including waveguide loss in the mixer block, 0.52.5 W of local oscillator power at the mixer LO input port.
Given that the cooled frequency multipliers are 1) able to produce ample LO power over the described frequency bands and 2) increase 2540% in efficiency upon cooling, it is necessary to add attenuation in the LO-mixer path [1]. In practice, this may be accomplished with a directional coupler or fixed tuned (preset) attenuator. A preset attenuator has the advantage of being simple, relatively inexpensive, and manually adjustable at room temperature. The effect of employing a cooled attenuator is similar to the use of a beam splitter with quasi-optical LO injection; it reduces the multiplier-mixer cavity standing wave, and minimizes additive thermal noise from the local oscillator. Additional reduction in LO amplitude and spurious noise is provided by the “noise canceling properties” of the balanced mixer as observed from Eq. 1.
III-B Waveguide to Thinfilm Microstrip Transition
Traditionally the majority of SIS waveguide mixers employ planar probes that extend all the way across the waveguide [10]-[13]. Unfortunately, the “double-sided” (balanced) probe exhibits a rather poor RF bandwidth ( 15%), when constructed in full-height waveguide. When the height of the waveguide is reduced by 50%, the probe’s fractional bandwidth improves dramatically to a maximum of about 33%. These results can be understood in that the double-sided probe is essentially a planar variation of the well known Eisenhart and Khan waveguide probe [14]. Borrowing from Withington and Yassin’s assessment [15], the real part of the probe’s input impedance is influenced in a complex way by the parallel sum of individual non-propagating modal impedances, and as such, is frequency dependent. By lowering the height of the waveguide, the effect of non-propagating modes may be reduced [16]-[19].
| Parameter/band (GHz) | 230 | 345 | 460 | 650 |
|---|---|---|---|---|
| Quartz Substrate Thickness (m) | 50 | 50 | 50 | 50 |
| Waveguide a-dimension (m) | 889 | 579 | 450 | 310 |
| Waveguide b-dimension (m) | 414 | 290 | 211 | 145 |
| Probe radius (m) | 170 | 112 | 86 | 59 |
| Substrate width (m) | 304 | 204 | 152 | 111 |
| Height above Substrate (m) | 38 | 25 | 16 | 16 |
| Height below Substrate (m) | 100 | 76 | 50 | 41 |
| Backshort-substrate (m) | 205 | 102 | 70 | 51 |
| Backshort radius (m) | 100 | 71 | 50 | 50 |
| Probe impedance locus () | 49-0 | 48+4 | 46+3 | 42+2 |
An alternative approach is to use an asymmetric probe that does not extend all the way across the waveguide. For this kind of probe, the modal impedances add in series. The real part of the input impedance depends only on the single propagating mode and is relatively frequency independent. These probes are typically implemented in full-height waveguide, which minimizes conduction loss and reduces the complexity of fabrication. A rectangular version of the “one-sided” probe has been used quite extensively by microwave engineers [20, 21], was introduced to the submillimeter community by Kerr et al. [22] in 1990, and is currently part of the baseline design for ALMA band 3 and 6 [23, 24] amongst others. The radial probe waveguide to thinfilm microstrip transition employed here represents an attempt to extend the use of radial modes to the waveguide coupling problem [25]. Design parameters and radial probe dimensions for all four waveguide bands are provided in Table I. Simulations indicate that misalignment errors are to be kept less than 34% of the waveguide height as misalignment of the probe varies the ’effective’ radius of the probe, thereby altering the shape (bandwidth) of the probe’s response [5].
III-C High current density AlN barrier SIS junctions
To facilitate the CSO heterodyne upgrade a suite of high-current-density AlN-barrier niobium SIS junctions (4 bands) have been fabricated by JPL [4]. These devices have the advantage of increasing the mixer instantaneous RF bandwidth while minimizing absorption loss in the mixer normal or superconducting thinfilm front-end RF matching network.
| Measured | Measured | Design | Design | |
|---|---|---|---|---|
| Band | Rn () | R / Rn | Rn () | Area (m2) |
| 230 GHz | 6.2 | 12.75 | 6.33 10% | 0.6 |
| 345 GHz | 5.1 | 10.86 | 5.43 10% | 0.7 |
| 460 GHz | 5.2 | 12.54 | 5.43 10% | 0.7 |
| 650 GHz | 4.1 | 12.39 | 4.22 10% | 0.9 |
The tunnel junctions under discussion are from batch B030926 and have a measured RnA product of 7.6 m2. At the CSO, on top of Mauna Kea, a lower LHe bath temperature (3.67 K) results in a subgap leakage current reduction of 10%. Relevant twin-SIS junction parameters are shown in Table II. For a description of the device fabrication we refer to [2].
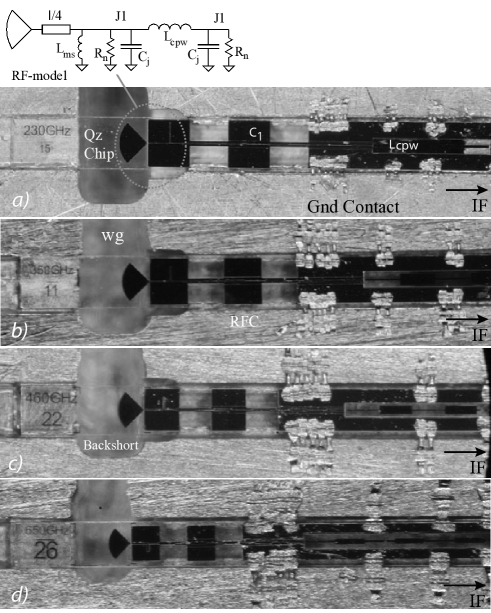
a) 230 GHz, b) 345 GHz, c) 460 GHz, d) 650 GHz. The radial probe waveguide to thinfilm microstrip transition is visible on the left side.
| Parameter | Measured | Design |
|---|---|---|
| Cs (fF/m2) | 80 | 80 10% |
| RnA (m2) | 7.63 | 7.6 15% |
| Jc (kA/cm2) | 24.9 | 25 15% |
| Vgap (mV) | 2.69-2.79 | 2.8 5% |
| Vgap (V) | 50-70 | —- |
| Nb Top (nm) | 420 | 400 20% |
| SiO (nm) | 320 | 300 15% |
| Nb Bottom (nm) | 210 | 200 20% |
III-C1 Integrated RF matching
The new SIS tunnel junctions of Fig. 4 all share the same 50 m thick quartz wafer [26]. This has as benefit that the successful wafer run contains all the mixer chips needed for the 180720 GHz facility receiver upgrade. Supermix [27], a flexible software library for high-frequency superconducting circuit simulation, was used in the design process.
In general, the junction characteristics are well matched, with slight variations in the definition of the energy gap and device area. The depicted devices were selected on merit of matching I/V curves, e.g. normal state resistance (), leakage current at 2 mV bias, gap voltage (Vgap=2e), and sharpness of the energy gap.
A limitation of the quadrature hybrid (balanced) design is that the LO power as a function of frequency is not necessarily equally split between the two (twin) SIS junctions. From detailed analysis we conclude that gain imbalance due to device characteristics and LO power imbalance does not significantly affect the overall balanced mixer performance. This is important since it means that the individual SIS junctions may be biased at similar, but opposite polarity. The simulation results are derived from harmonic balanced superconducting SIS mixer simulations [27] in combination with extensive Sonnet 444SONNET, Sonnet Software Inc. [Online] Available: http://www.sonnetsoftware.com/ and HFSS 555HFSS, Ansys Inc. [Online] Available: http://www.ansys.com/ analysis of the RF and IF mixer circuitry, and have been confirmed by measurement (section IV-C).
Based on extensive computer simulations, the twin-junction RF matching network was found to exhibit a slightly larger RF bandwidth than the more common single-junction RF matching network [28, 29]. The AlN-barrier SIS junction [RnC]-1 product is 262 GHz, significantly larger than the bandwidth afforded by the thin-film waveguide transition. This enables uniform conversion gain (with margin) across the band of interest. As part of the AlN-barrier characterization process at JPL, the specific junction capacitance was estimated 80 fF/m2. To minimize saturation (V), while maintaining reasonably sized junction areas, we decided on a 57 twin-junction normal state resistance design shunted by an IF embedded impedance of 14 (Fig. 5). Above 13 GHz the integrated capacitor (C2) short circuits the IF signal thereby lowering Zemb 0 . Between dc and 1 GHz the IF embedding impedance maybe 14 however this is a small fraction of the total available IF bandwidth. Note that the IF embedding impedance is in parallel with the LO pumped junction impedance, which from measurements takes on values between 30 to 150 Ohm. From this, and assuming a 160 GHz RF noise bandwidth (section IV-B), we calculate a bias voltage variation (Vsis) between 0 K and 300 K loads of 80 V rms (or less). Given this analyses we estimate the gain compression on a hot-load 1%, which is supported by the high Y-factors.
III-C2 Integrated IF matching
| Section/Band | 230 GHz | 345 GHz | 460 GHz | 650 GHz |
|---|---|---|---|---|
| S1 (lw) m | 130.33.0 | 85.83.2 | 66.83.3 | 45.14.0 |
| S2 (lw) m | 4.05.0 | 4.15.0 | 4.155.0 | 4.55.0 |
| S3 (lw) m | 116.65.0 | 54.95.0 | 35.35.0 | 14.55.0 |
| S4 (lw) m | 2.55.0 | 2.55.0 | 2.55.0 | 2.55.0 |
| RFCh (25 ) m | 1272 | 832 | 642 | 432 |
| RFCl (10 ) m | 1226 | 806 | 626 | 416 |
| CPW (Zh/Zl) | 169/77 | 196/84 | 202/95 | 190/134 |
| RFC sections | 10 | 10 | 10 | 10 |
| CPW sections | 3 | 5 | 7 | 9 |
| C2 (pF) | 0.883 | 0.843 | 0.820 | 0.798 |
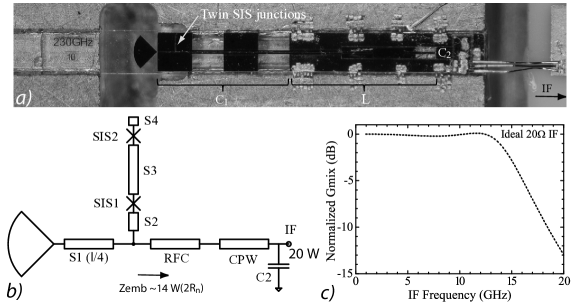
Matching to an intermediate IF impedance of 20 is realized on-chip (Fig. 5). The choice of this impedance is dictated by the limited available real estate, and the need to minimize gain compression (Zemb 2Rn) [30]. The mixer design has been optimized for minimum noise temperature and optimal conversion gain, while simultaneously regulating the RF and IF input return loss to 8 dB. The latter is important as reflections from the RF or IF port can lead to mixer instability. In Fig. 5, we show a photograph of the mixer chip positioned in the waveguide with associated IF model and IF response. Short parallel wire bonds provide the ground contact. To transform the 20 mixer-chip IF output impedance to a 50 load, an external matching network is employed (Fig. 6).
III-D Wilkinson in-phase Summing Node
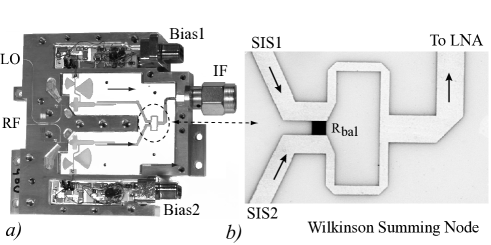
In a mixer configuration, the active device is typically terminated into a desired IF load impedance, the bias lines EMI-filtered and injected via a bias Tee, and the IF output dc-isolated (Fig. 6a). The balanced mixer has the additional constraint that the individual junction IF output signals need to be combined either in phase, or 180∘ out of phase, putting tight limits on the allowed phase error (). Since in our application the SIS junctions will be biased antipodal (Fig. 1) we conveniently combine the bias-Tees, electrical isolation of the IF port, band pass filters, IF matching networks, and an in-phase Wilkinson power combiner [8] on a single planar circuit. The 100 balancing resistor of the Wilkinson power combiner (Fig. 6b) is a 1% laser trimmed thinfilm NiCr resistor, lithographically deposited on a 635 m thick Alumina (=9.8) circuit board 666American Technical Ceramics, One Norden Lane, Huntington Station, NY 11746, USA. This compact choice conveniently avoids the use of a physically larger (commercial) 180 degree hybrid.
The IF bandpass filter is comprised of a set of parallel coupled suspended microstrip lines [31]. For this filter to work, the ground plane directly underneath the filter has been removed, and the IF board positioned on top of a machined cutout (resonant cavity). There are several discontinuities in this structure. When combined, they form the bandpass filter poles. The advantages are; simplicity of design (only one lithography step), accurate knowledge of the phase, and reliability. The disadvantage is possibly its size, /4 (6 mm at 6 GHz).
III-E IF Noise Characterization
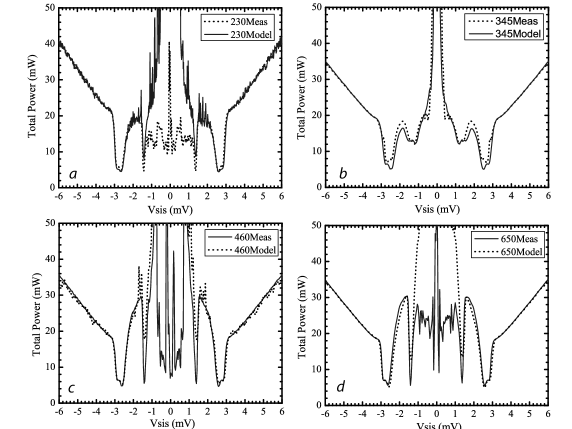
It is found, not surprisingly, that high-current-density (Jc) AlN-barrier tunnel junctions exhibit a slightly larger leakage current than commonly used lower-Jc AlOx tunnel junctions (Rsg/Rn ratios of 1014 vs 2035). To derive the IF noise contribution of the receiver, and to investigate charged quantum transport current by means of multiple Andreev reflections (MAR) through pinholes in the AlN barrier we apply a technique described by Dieleman et al. [32]. In the analysis, the current spectral density below the energy gap () is modeled by summing the thermalized single-electron tunnel current (Itun) with a charged quantum transport current (Imar). In this case
| (2) |
with = 2.75 mV for our AlN junctions. Rearranging Eq. 2 by defining r=Itun/I with I=(Itun+Imar) gives
| (3) |
The noise contribution of a single junction to the IF output is then given by
| (4) |
where
| (5) |
GIF is the IF gain, B the IF bandwidth, Rd the differential resistance obtained from the measured unpumped I/V curve, and Zo the IF impedance (20 in this case). From the analyses we conclude that only about 12% (Table V) of the enhanced subgap noise is due to charged quantum transport (MAR).
Kerr et. al has shown [33] that an ideal (0 K) broadband DSB mixer with zero point fluctuations associated with the signal and image sidebands has a minimum mixer (IF) output noise of half a photon (). From the derived DSB mixer noise temperature (Section IV-C) we estimate the (finite temperature) mixer thermal noise contribution and subgap shot noise, due to leakage current (Table II), to contribute an additional half a photon of noise.
To calculate the IF noise contribution, Rudner et al. [34], and Woody et al. [10], proposed to use the unpumped junction biased above the superconducting energy gap as a calibrated shot noise source (Eq. 6). Studies by Dubash et al. [35, 36] quantitatively verified that the noise current of an unpumped SIS junction above the gap is in fact the shot noise associated with the direct current. Hence the current is entirely due to single-electron tunneling and Tshot may be found in the traditional way:
| (6) |
with Boltzmann constant and
| (7) |
For the balanced mixer and twin-junction design there are 4 SIS junctions. Since the noise contribution of each junction is uncorrelated, the resultant mixer output noise is obtained by adding the MAR and shot noise in quadrature (Fig. 7). Finally, to compute the IF noise contribution and mixer conversion gain (Section IV) we use a technique explained by Wengler and Woody [37].
†Taken at the same gain setting.
| Band | Tif (K) | MAR (%) | Gain (dB) |
|---|---|---|---|
| 230 GHz† | 3.51 | 0.70 | 67.1 |
| 345 GHz | 4.62 | 0.20 | 43.1 |
| 460 GHz† | 3.91 | 2.20 | 67.1 |
| 650 GHz | 4.74 | 1.50 | 53.0 |
IV Receiver Performance
IV-A Optics
The receiver noise temperature is critically dependent on optical loss in front of the mixer. This can be understood from
| (8) |
is the double-sideband mixer gain, the front-end optics transmission coefficient, the optics noise temperature, the IF noise temperature, and the intrinsic mixer noise. We have minimized the optics noise by careful selection of the vacuum window and infrared blocking filters [1], and by use of only cooled reflective optics.
For optimal RF bandwidth and performance, we use a corrugated feedhorn 777Custom Microwave Inc., 940 Boston Avenue Longmont, CO 80501, USA. [Online] Available: http://www.custommicrowave.com/ with 43% fractional bandwidth. The design is based on numerical simulations of a 180280 GHz feedhorn with 64 sections by J. Lamb [38]. Calculated input return loss of the horn is better than 18 dB, the cross-polar component less than -32 dB, and the phase front error 0.1. The horns have a frequency independent waist [39] resulting in a frequency dependent beam divergence (f/D=).
In our design the FPU output waist is positioned at the 65 K stage of the cryostat (Fig. 3). This allows the use of a 32 mm diameter pressure window (7 ).
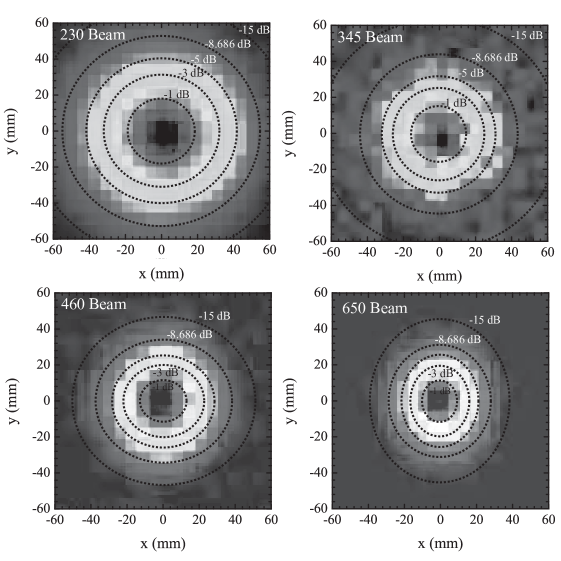
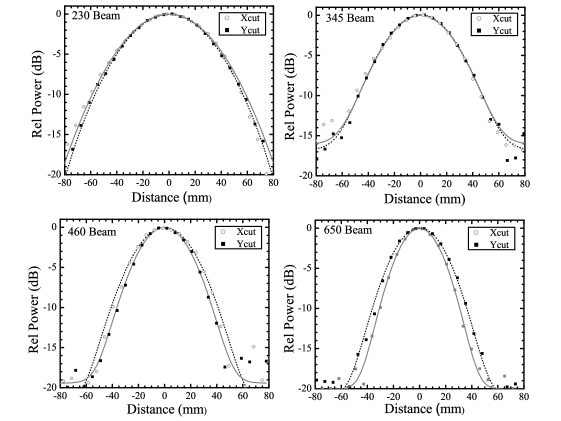
To provide a constant telescope illumination and maximum aperture efficiency, an edgetaper of 11 dB [39] was deemed optimal given the secondary mirror central blockage. To achieve this for the CSO Nasmyth focus two focusing elements (elliptical mirrors) are required. In addition, to allow for dual-band observations, a wire grid is needed to separate the incoming circular-polarized astronomical signal into the respective and linear-polarized components. Combining these requirements with the limited cold surface work space (120 mm) required the use of ’dense’ folded optics. The 230 GHz and 345 GHz beams suffer from less distortion than the 460 GHz and 650 GHz beams as the last focusing mirror could be made of a 37.5∘ off-axis elliptical mirror as opposed to a 45∘ off-axis elliptical mirror. In Figs. 8, 9 we show the measured direct detection beams. Fit parameters to a single mode Gaussian beam are tabulated in Table VI.
| Band | FWHM (mm) | Waist (mm) | f (mm) | f/D | |
|---|---|---|---|---|---|
| 230 GHz | 31.644 | 53.82 | 321 | 2.98 | 0.266 |
| 345 GHz | 25.620 | 44.109 | 347 | 3.93 | 0.023 |
| 460 GHz | 21.144 | 36.114 | 312 | 4.32 | 0.461 |
| 650 GHz | 18.264 | 31.172 | 338 | 5.42 | 0.525 |
IV-B Fourier Transform Spectrometer Measurements
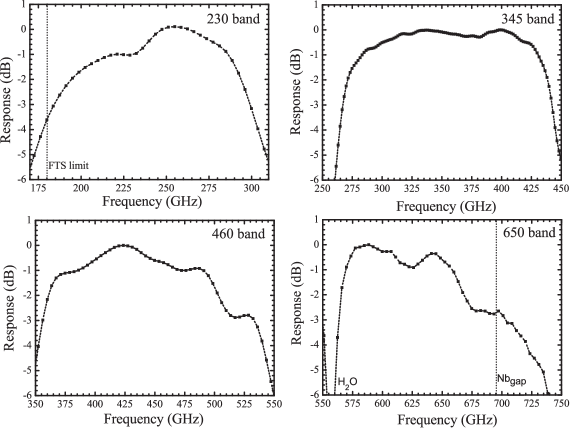
To investigate the coupling to the twin-SIS junction RF matching network (Fig. 4), we have measured the direct-detection response of the mixer with a Fourier transform spectrometer (FTS). The result is shown in Fig. 10. Mixer bias is antipodal, approximately 1/2 photon below the energy gap (2/e 2.75 mV).
For the lower frequency bands the RF passband is limited by the corrugated feedhorn and radial probe waveguide transition fractional bandwidth ( 43%), whereas for the higher frequency bands the RF passband limit is set by the twin-SIS junction RF matching network (160 GHz). In addition, the measured direct-detection responses are centered on the respective (designed) passbands. This argues for the accuracy of the computer simulations [27] and quality of the device fabrication.
IV-C Heterodyne Results and Discussion
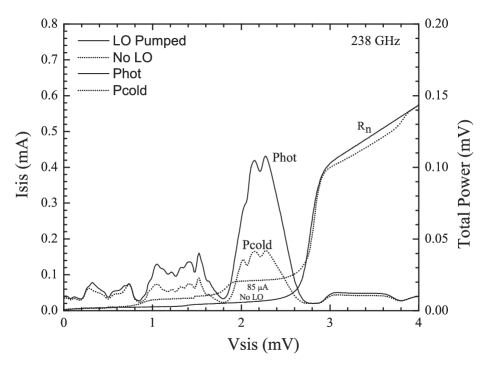
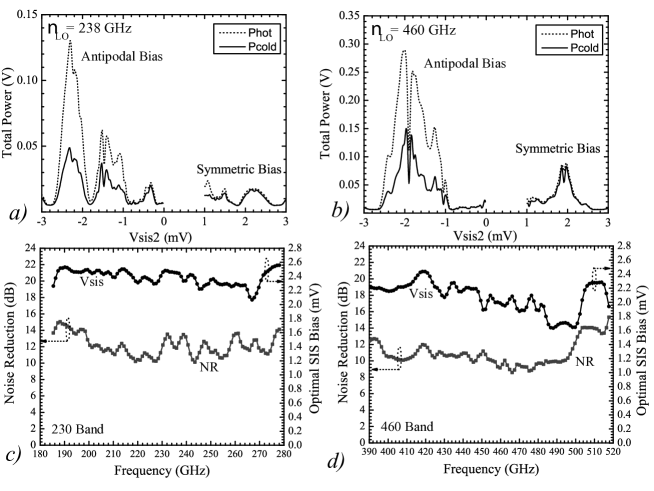
In Fig. 11 we show the down-converted (heterodyne) ’hot’ and ’cold’ load response with associated local-oscillator pumped and unpumped I/V curves at = 238 GHz. The measured result is representative of hundreds of characterization curves taken in automated fashion across the 180280 GHz frequency range. For all frequencies best 230 GHz mixer bias occurs between 2.12.2 mV (see also Fig. 16). Optimal LO pump current is 85102 A, which is 5875 A over the dark current. From this we calculate that ranges from 0.780.94, corresponding to a mean LO pump level of 110 nW.
For tuning simplicity it was decided to use only one bias setting for both electromagnets (Fig. 3b) at all frequencies. We note that the superconducting electromagnets were wound (nearly) ’identical’ for this reason. In addition, the SIS junction geometry does not have a ’diamond’ like e-beam profile [40] to facilitate homogenous suppression of the ac-Josephson effect (breaking of Cooper pairs). This could be a future enhancement. Because two twin-SIS junctions are involved it is therefore practically impossible to perfectly null Josephson oscillations with a common bias setting on both electromagnets (Fig. 3b). However since the location of the Shapiro steps are well known (S, n=1, 2, …), it is avoided by a computerized bias algorithm.
†Includes spillover due to the fast beam (Fig. 9).
| Parameters | 203 GHz | 238 GHz | 275 GHz |
|---|---|---|---|
| T (K) | 41.3 | 40.0 | 41.0 |
| †Trf (K) | 21 | 21 | 19 |
| TIF (K) | 3.5 | 3.5 | 3.5 |
| Tmix (K) | 13.4 | 13.5 | 15.5 |
| (dB) | -1.09 | -0.56 | -0.95 |
| (dB) | -0.304 | -0.304 | -0.273 |
| Tmix/() (K) | 14.3 | 14.5 | 16.5 |
| TIF/() (K) | 4.8 | 4.3 | 4.6 |
| 0.94 | 0.78 | 0.80 |
| Parameters | 406 GHz | 460 GHz | 495 GHz |
|---|---|---|---|
| T (K) | 34.0 | 37.1 | 40.2 |
| Trf (K) | 8 | 8 | 9 |
| TIF (K) | 3.9 | 3.9 | 3.9 |
| Tmix (K) | 22.5 | 28.2 | 28.4 |
| (dB) | -1.03 | 2.38 | 0.76 |
| (dB) | -0.113 | -0.113 | -0.142 |
| Tmix/() (K) | 23.09 | 28.9 | 29.3 |
| TIF/() (K) | 5.0 | 2.3 | 3.4 |
| 0.75 | 0.78 | 0.75 |
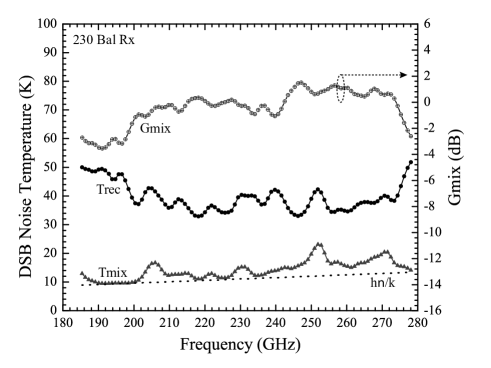
As a general principle the receivers were not biased for maximum mixer conversion gain (), which occurs when the IF output power is optimized. Rather, we developed a global search routine and obtained at 100 frequencies across each receiver band the optimal receiver sensitivity as a function of LO pumping and SIS bias. The results are shown in Figs. 12, 14.

In the measurements, the input load temperatures were defined using Callen & Welton formalism [41, 33], where the vacuum zero-point fluctuation noise is included in the blackbody radiation temperature. At the frequencies of interest this approaches the Rayleigh-Jeans limit.
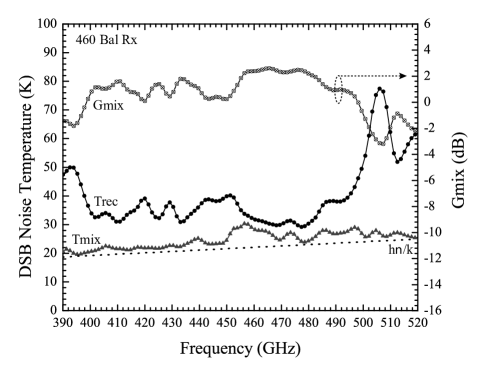
To understand the optics loss in front of the mixer, we employ a technique, commonly known as the “intersecting-line technique”, described by Blundell et al. [42] and Ke and Feldman [43]. We find between 180280 GHz a front-end equivalent noise temperature (Trf) of 1821 K and between 390520 GHz a front-end equivalent noise temperature of 89 K. These losses include vignetting and spillover and are considerably worse for the 230 receiver then the 460 receiver due to the fast optics. In addition the AR coated HDPE pressure window was optimized for the 460 GHz atmospheric band [1]. A detailed breakdown of the noise budget at three frequencies across the mixer band is provided in Tables .
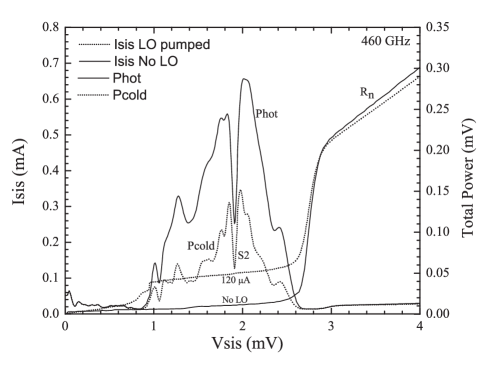
In Fig. 13 we show the measured heterodyne response and associated local-oscillator pumped and unpumped I/V curves at = 460 GHz. The measured result is again representative of hundreds of characterization curves taken. For all frequencies best mixer bias, avoiding Josephson oscillations, falls in two ranges: depending on the frequency of operation (Fig. 13). Optimal LO pump current is 105113 A, which is 7687 A over the dark current. From this we calculate that = 0.750.78 which corresponds to a mean LO pump level of 394 nW.
IV-D Spurious Signal and Amplitude Noise Rejection
An important motivation of using balanced mixers is the inherent spurious signal and amplitude noise cancellation characteristics this type of mixer configuration offers. It is of interest therefore to establish the actual vs. modeled noise rejection. It should be noted that a second, and possibly equally important, motivation for balanced mixers is the efficiency with which the local oscillator carrier signal may be injected [1].
To investigate the spurious rejection properties of the 230 GHz and 460 GHz balanced mixers we injected harmonic tones into the local oscillator path of the respective mixers by means of a second Ka-band synthesizer, connected in parallel (via a Ka-band 20 dB directional coupler) to the input of the a Pacific Millimeter Products tripler. 888 Pacific Millimeter Products, Inc., “Models: E3, E3+, W3, W3-”, 64 Lookout Mountain Circuit, Golden, Co 80401, USA. [Online] Available: http://www.pacificmillimeter.com/ [1] The result is shown in Fig. 15. Everything being the same, the mixers were biased either symmetric (in phase) or antipodal. This experiment was done at a number of LO settings. On average the spurious rejection measured in this manner was 10.1 2.8 dB for the 230 GHz balanced mixer and 11.9 1.5 dB for the 460 GHz balanced mixer. This method proved to be tedious however, so we repeated the measurement in a manner described by Westig et. al [44, 45].
In a balanced mixer with the IF signals connected to a 180∘ hybrid coupler, the down-converted RF and LO noise signals end up either at the summing node () or difference node (), depending on the bias scheme. Referring to Fig. 1, the CSO balanced receivers with integrated IF summing node do not have direct access to a difference node. However by switching the bias from antipodal to symmetric either the down-converted RF, or LO noise signal ends up at the mixer () output port, as shown in Fig. 16a, b. It should be noted that the last LO multiplier and fixed tuned attenuator are mounted on the cryostat LHe work surface and thermally strapped to the 15 K stage (Fig 3b). Thus the thermal noise contribution of the LO multiplier/attenuator may be assumed negligible compared to amplitude noise present from external sources on the LO carrier. The balanced mixer noise rejection may be obtained as follows
| (9) |
Here ’+’ indicates symmetric bias and ’-’ antipodal bias. Phot and Pcold are the averaged receiver IF output signals over 4 GHz of output bandwidth. The modulus of the antipodal bias equals the symmetric bias, and corresponds to that of the obtained receiver sensitivity of Fig. 12, 14. The measurement was done in automated fashion in 100 steps across the 230 GHz and 460 GHz frequency bands, with the derived noise rejection plotted in Fig. 16c, d.
From the discussion and derived results it is evident that the balanced receiver is capable of suppressing a significant amount of close in amplitude noise and spurious content (see also section IV-F). A YIG tracking filter [1] (or equivalent) is still needed however to remove AM and spurious noise far from the LO carrier, which can have very large amplitude.
IV-E IF Response
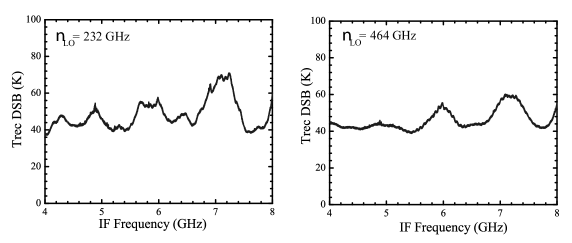
As part of a spurious investigation, the (DSB) IF response of the 230 GHz & 460 GHz receivers was obtained by stepping the LO frequency between 180280 GHz and 390520 GHz in 4 GHz steps. The data was obtained with a FFTS at an resolution of 256 MHz. A typical 230 GHz & 464 GHz receiver IF spectrum is shown in Fig. 17. As discussed in section III-C2, the twin-junction SIS design affords a 113 GHz IF passband response. However for practical reasons we have opted for a 4 GHz passband, though in principle an upgrade is possible.
IV-F Instrument Stability
Instrument stability, by means of amplitude noise and spurious tone mitigation, is one of the driving motivations for the use of balanced receivers. It is found for example that poor receiver stability leads to a loss in integration efficiency, poor baseline quality [47], and negatively effects observation modes such as “on-the-fly” mapping and “drift-scans” as more “off-source” observations are required.
Throughout the balanced receiver design process [1], much attention has been given to the multiplicity of factors that degrade the instrument stability. These include improved SIS and LNA bias electronics, voltage-divider networks in the SIS mixer and cryogenic low-noise amplifiers, enhanced thermal design of the room-temperature IF amplifiers, careful elimination of all ground loops, the use of twisted-pair wires in the cryostat to minimize electromagnetic interference (EMI), and the physical mounting of LNAs and last stage multiplier in a low vibration environment.
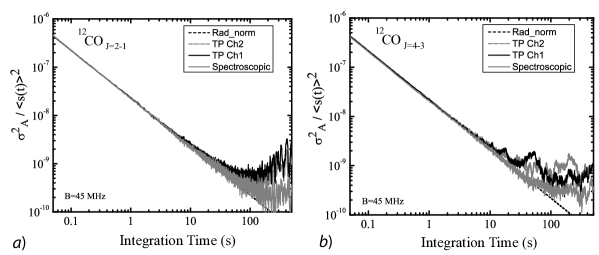
The resulting Allan variance stability plot is shown in Fig. 18. It has been found [48, 49] that fluctuations with a power spectrum show up in the Allan variance plot as , with defined as the integration time. If we let , the shape of the Allan variance is found to follow
| (10) |
where a, b, c are constants. The first term, with = -1, represents radiometric (white) noise. In a log-log plot it has a slope of -1 (Fig. 18). This type of frequency-independent (uncorrelated) noise integrates down with the square-root of time according to the well-known radiometer equation [50]
| (11) |
s(t) is the measured detector IF output signal in the time domain, and B the equivalent IF noise-fluctuation bandwidth of the system. The last term in Eq. 10 represents drift noise with drift index . In between these two limits a certain amount of gain-fluctuation or flicker noise with a 1/f noise power spectral distribution exists. The Allan minimum time () may be defined as the intercept between radiometric and drift noise [48]. However even without gain fluctuation (1/f) noise the minimum in the Allan variance plot is already significantly above the noise level predicted by the radiometer equation. Frequently however significant amounts of LO induced 1/f noise is present at the radiometer output and a more useful definition of the Allan minimum time is the integration time for which the measured noise exceeds that predicted from the radiometer equation by a factor [49].
If the stability were to be limited by drift noise alone, the Allan variance time scales with bandwidth [48] as
| (12) |
Referring the results of Fig. 18 to a 1 MHz spectrometer channel bandwidth, the 230 GHz and 460 GHz total-power and spectroscopic Allan variance times would be 500s/1350s and 335s/1000s respectively. This is with a fully synthesized LO [1]. The measured results of Fig. 18 also show that LO noise with a typical 1/f spectral distribution (=0) is not present, supporting the argument that balanced receiver noise immunity aids instrument stability. Note that electronic drift noise is present on longer time scales, as ordinarily would be the case.
For comparison, the ALMA [52] specified goal for total-power gain stability (G/G) at 1s is 10-4 (B=4 GHz). The results presented here equate to a normalized total-power gain stability () of 6.4 x 10⁻⁶ or roughly 18 below the ALMA specification.
IV-G Observations
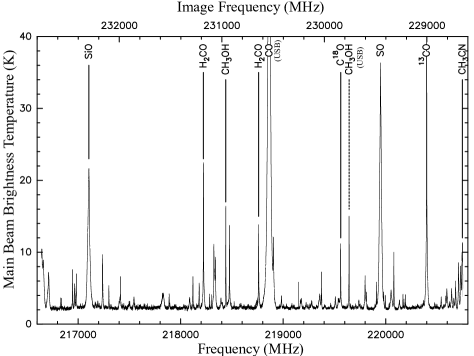
In February 2013 we observed Orion KL, the closest high-mass star-forming region. Fig. 19 shows a spectrum of Orion KL between 216.6 and 220.8 GHz. Due to its proximity (437 pc) this source exhibits an extremely rich molecular spectrum across the whole submillimeter band. The frequency range shown includes the J=21 rotational transition of carbon monoxide, CO, together with its two rare isotopologues, 13CO and C18O. In addition, lines of simple diatomic molecules silicon and sulfur monoxide, SiO and SO, are seen, as well as those of formaldehyde, H2CO, methanol, CH3OH, and many other more complex species.
The Orion KL spectrum was taken at 52∘ elevation, with a respective single-sideband (SSB) system temperature and total on-source integration time of 215 K and 2.7 min. Measured beam efficiency was 73%, consistent with a 11.5 dB Gaussian illumination (Section IV-A). The 225 GHz zenith atmospheric opacity was 0.06, which translates into upper and lower sideband, air-mass corrected, on-source opacities of 0.075, 0.073 [53].
The measured SSB system temperatures (T) are consistent with those obtained from theory [54]
| (13) |
With the antenna brightness temperature
| (14) |
is the on-source upper or lower sideband mean opacity. The physical temperature of the sky (Tsky) and antenna spillover temperature () are estimated to be 275 K. is the cosmic background temperature (2.726 K), and the antenna hot spillover efficiency (90%). Given a 40 K DSB receiver noise temperature (Fig. 12) we obtain a theoretical T of 208 K. In the event a SSB receiver with 10 dB sideband rejection (ALMA) and T = 2T had been used for the observations the SSB system temperature is estimated to have been 158 K. The gain in system noise temperature by using a SSB receiver would have been higher in “bad” weather observation conditions.
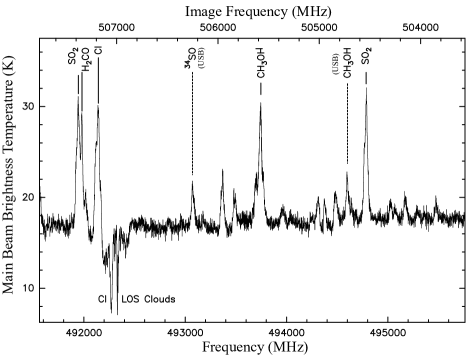
Fig. 20 shows a spectrum of Sagittarius B2(M) between 491.8 and 495.8 GHz taken in May 2012. Sagittarius B2 is the most massive molecular cloud complex in the Galactic center and an active region of high-mass star formation. Lines of sulfur monoxide, 34SO, sulfur dioxide, SO2, formaldehyde, and methanol, can be identified in the spectrum. In addition the atomic fine structure line of neutral atomic carbon, [CI], is seen in emission at velocities corresponding to the envelope of Sagittarius B2. A complex pattern of [CI] absorption is also seen at velocities corresponding to the foreground molecular clouds located in the Milky Way spiral arms between the Sun and the Galactic center.
The Sagittarius B2 spectrum was taken at 42∘ elevation, with a respective SSB system temperature and total on-source integration time of 3900 K and 11 min. Measured beam efficiency was 40%, consistent with a 11.5 dB telescope illumination (Section IV-A) and 24 m surface rms (the CSO surface correction system DSOS was not in use). Weather conditions were marginal for this wavelength band, being 0.06. These conditions translate into (averaged) upper and lower sideband, air-mass corrected, on-source opacities of 1.82 and 2.4 [53]. If a 45 K DSB receiver noise temperature is assumed (Fig. 14) we obtain a theoretical T of 3950 K. Again in the event a SSB receiver with 10 dB sideband rejection (ALMA) and T = 2T had been used for the observations, the SSB system temperature is estimated to have been 2400 K. This is a significant improvement (a factor 2.7 in integration time), arguing for the development of balanced SSB mixers. In the case of DSB receivers the IF should be chosen to minimize the atmospheric noise contribution from the image sideband.
V Conclusion
To facilitate deep integrations, automated line surveys, and remote observations a suite of fully synthesized dual-color balanced receivers covering the 180720 GHz submillimeter atmospheric frequency range (ALMA B5B9) have been developed for the Caltech submillimeter Observatory. It was judged an optimal compromise between scientific merit and finite funding. In the development wide RF bandwidth was favored [2, 1], allowing the same science to be done with fewer instruments.
High-current-density (25 kA/cm2) AlN-barrier SIS technology has been used, facilitating the very wide instantaneous RF bandwidth presented. For the 230 GHz balanced receiver we obtain in the 180280 GHz frequency range a receiver sensitivity of 3350 K DSB. The mixer conversion gain is relatively constant at 0 1 dB. The 460 GHz balanced receiver also has a noise temperature in the range 4050 K DSB, with a mixer conversion gain of 1 1 dB. In the case of the 460 GHz receiver the very low receiver noise temperature is understood to be the result if four factors: A cooled last stage multiplier, 12 dB of AM noise rejection, moderate mixer conversion gain, and high optical throughput. Conversely, the 230 GHz receiver noise temperature suffers from the fast optics required to achieve proper telescope illumination and less of a reduction in LO noise as is the case with the 460 GHz instrument.
The amplitude noise rejection is 12 dB 3 dB for both receivers. This result slightly exceeds the theoretical estimate of [1]. Instrument stability, as measured in situ at the telescope, is excellent and argues for the development of submillimeter and terahertz balanced receiver configurations. The presented results are confirmed by actual observations and the obtained high quality spectral baselines.
Unfortunately, deployment of the 345/650 balanced receiver(s) is presently on hold due to funding difficulties.
VI Acknowledgements
The authors wish to thank J. Groseth and D. Warden, California Institute of Technology, for the assembly of the needed bias electronics. Prof. S. Weinreb, Jet Propulsion Laboratory and California Institute of Technology, for making available the cryogenic low noise MMIC’s, Dr. J. Pierson of the Jet Propulsion Laboratory for his assistance with the medium power amplifiers modules, Prof. P. Goldsmith of the Jet Propulsion Laboratory for his advice on instrument stability and general support, and Prof. J. Zmuidzinas of the California Institute of Technology for providing the Ka-band synthesizers, the wideband Fast Fourier Transform Spectrometers (FFTS), and for his advise and physics insight over the years.
References
- [1] J. W. Kooi, R. A. Chamberlin, R. Monje, B. Force, D. Miller, and T. G. Phillips, “Balanced Receiver Technology Development for the Caltech Submillimeter Observatory”, IEEE Trans. Terahertz Science and Technology, Vol. 2, No. 1, pp.71-82, Jan., 2012.
- [2] J. W. Kooi, A. Kovács, M. C. Sumner, G. Chattopadhyay, R. Ceria, D. Miller, B. Bumble, R. LeDuc, J. A. Stern, and T. G. Phillips, “A 275-425 GHz Tunerless Waveguide Receiver Based on AlN SIS Technology”, IEEE Trans. Microwave Theory and Techniques, Vol. 55, No. 10, pp. 2086-2096, Oct., 2007.
- [3] J. W. Kooi, A. Kovács, S. Kaye, J. Dama, J. Zmuidzinas, and T.G. Phillips, “Heterodyne Instrumentation Upgrade at the Caltech Submillimeter Observatory” Proc. SPIE, Vol. 4855, pp. 265-278, Feb., 2003.
- [4] J. W. Kooi, A. Kovács, B. Bumble, G. Chattopadhyay, M. L. Edgar, S. Kaye, R. LeDuc, J. Zmuidzinas, and T. G. Phillips “Heterodyne Instrumentation Upgrade at the Caltech Submillimeter Observatory II” Proc. SPIE, Vol. 5498, pp 332-348, Jun., 2004.
- [5] J. W. Kooi, G. Chattopadhyay, S. Withington, F. Rice, J. Zmuidzinas, C. K. Walker, and G. Yassin, “A Full-Height Waveguide to Thin-Film Microstrip Transition with Exceptional RF Bandwidth and Coupling Efficiency” Int. J. Infrared Millim. Waves, Vol. 24, No. 3, Sep., 2003.
- [6] Y. Serizawa, Y. Sekimoto, M. Kamikura, W. Shan, and T. Ito, “A 400- 500 GHz Balanced SIS Mixer with a Waveguide Quadrature Hybrid Coupler,” Int J. IR and MM Waves, Vol. 29, No. 5, pp. 846 861, Sep., 2008.
- [7] B-K Tan, G. Yassin, P. Grimes, K. Jacobs, and S. Withington, “Preliminary Measurement Results of a 650 GHz Planar Circuit Balanced SIS Mixer”, IEEE Trans. Terahertz Science and Technology, Vol. 3, No. 1, pp.32-38, Jan., 2013.
- [8] E. J. Wilkinson, “An N-way Hybrid Power Divider”, IRE, Microwave Theory and Techniques, Vol MTT-13, pp. 116-118, Jan., 1960.
- [9] J. R. Tucker, and M. J. Feldman, “Quantum Detection at Millimeter Wavelengths”, Rev. Mod. Phys., Vol. 57, pp. 1055-1113, Oct., 1985.
- [10] D. P. Woody, R. E. Miller, and M. J. Wengler, “85-115 GHz Receivers for Radio Astronomy”, IEEE Trans. Microwave Theory and Techniques, Vol. 33, pp. 90-95, Feb., 1985.
- [11] B. N. Ellison and R. E. Miller, “A Low Noise 230 GHz SIS Receiver,” Int. J. IR and MM Waves, , Vol. 8, 609-625, Jun., 1987
- [12] J. W. Kooi, M. Chan, T. G. Phillips, B. Bumble, and H. G. Leduc, “A low Noise 230 GHz Heterodyne Receiver employing 0.25 m2 Area Nb/AlOx/Nb Tunnel Junctions,” IEEE Microwaves Theory and Techniques, Vol. 40, pp. 812-815, May, 1992.
- [13] C. K. Walker, J. W. Kooi, M. Chan, H. G. Leduc, P. L. Schaffer, J. E. Carlstrom, and T. G. Phillips, “A Low-noise 492 GHz SIS Waveguide Receiver,” Int. J. IR and MM Waves, Vol. 13, pp. 785-798, Jun., 1992.
- [14] R. L. Eisenhart and P. J. Khan, “Theoretical and Experimental Analysis of a Waveguide Mounting Structure”, IEEE Microwave Theory and Techniques, Vol. MTT-19, pp. 706-717, Aug., 1971.
- [15] S. Withington, and G. Yassin, “Analytical Expression for the Input Impedance of a Microstrip Probe in Waveguide,” Int. J. IR and MM Waves, Vol. 17, pp. 1685-1705, Nov., 1996.
- [16] C-Y. E. Tong, R. Blundell, S. Paine, “Design and Characterization of a 250-350-GHz Fixed-Tuned Superconductor-Insulator-Superconductor Receiver”, IEEE Microwave Theory and Techniques, Vol. MTT-44, pp. 1548-1556, Sep., 1996.
- [17] Y. Delorme, M. Salez, B. Lecomte, I. Pron, F. Dauplay, A. Fret, J. Spatazza, J. -M. Krieg, and K. F. Schuster, “Space-Qualified SIS Mixers for Herschel Space Observatory’s HIFI Band 1 Instrument”, Proc. 16th Int. Symposium on Space Terahertz Technology, Chalmers, Göteborg, Sweden, S08-05, May, 2005.
- [18] C. F. J. Lodewijk, M. Kroug, and T. M. Klapwijk, “Improved Design for Low Noise Nb SIS Devices for Band 9 of ALMA (600-720 GHz)”, Proc. 16th Int. Symposium on Space Terahertz Technology, Chalmers, Göteborg, Sweden, S03-05, May, 2005.
- [19] B. D. Jackson, G. de Lange, T. Zijlstra, M. Kroug, J. W. Kooi, J. A. Stern, and T. M. Klapwijk, “Low-Noise 0.8-0.96- and 0.96-1.12 THz Superconductor-Insulator-Superconductor Mixers for the Herschel Space Observatory”, IEEE Microwave Theory and Techniques, Vol. MTT-54, No. 2, pp. 547- 558, Feb., 2006.
- [20] Y-C Leong, and S. Weinreb “Full-band Waveguide-to-Microstrip Probe Transitions” IEEE Microwave Theory and Techniques, Digest of Papers, Anaheim, CA, 13-19 Jun., 1999.
- [21] J. H. C. van Heuven “A new Integrated Waveguide-Microstrip Transition”, IEEE Microwave Theory and Techniques, Vol MTT-24, pp. 144-147, Mar., 1976.
- [22] A. R. Kerr and S. K Pan, “Some recent Developments in the Design of SIS Mixers,”, Int. J. IR and MM Waves, Vol. 11, No. 10, pp. 1169-1187, Nov., 1990.
- [23] A. R. Kerr, “Elements for E-plane Split-Block Waveguide Circuits”, NRAO, Charlottesville, VA. [Online]. Available: http://www.alma.nrao.edu/memos/html-memos/alma381/memo381.pdf, Access date: Jul. 5, 2001.
- [24] S. -K. Pan, A. R. Kerr, M. W. Pospiezalski, E. F. Lauria, W. K. Crady, N. Horner, Jr., S. Srikanth, E. Bryerton, K. Saini, S. M. X. Claude, C. C. Chin, P. Dindo, G. Rodrigues, D. Derdall, J. Z. Zhang, and A. W. Lichtenberger, “A Fixed-Tuned SIS Mixer with Ultra-Wide-Band IF and Quantum-Limited Sensitivity for ALMA Band 3 (84-116 GHz) Receivers”, Proc. 15th Int. Symposium on Space Terahertz Technology, Northampton, MA, pp. 62-69, Apr., 2004.
- [25] S. Withington, G. Yassin, J. Leech, and K. G. Isaak, “An Accurate Expression for the Input Impedance of One-Sided Microstrip Probes in Waveguide”, Proc. 10th Int. Symposium on Space Terahertz Technology, Charlottesville, Va, pp. 508-518, Mar., 1999.
- [26] B. Bumble, Jet Propulsion Laboratory (JPL), Ca., Private Communication, 2003.
- [27] J. Ward, F. Rice and J. Zmuidzinas, “Supermix: a Flexible Software Library for High-Frequency Circuit Simulation, including SIS Mixers and Superconducting Components”, Proc. 10th Int. Symposium on Space Terahertz Technology, Charlottesville, VA, pp. 269–281, Mar., 1999.
- [28] D. Maier, S. Devoluy, M. Schicke, and K. F. Schuster “230 GHz SSB SIS Mixer for Band 3 of the new Generation Receivers for the Plateau de Bure Interferometer”, newblock Proc. 16th Int. Symposium on Space Terahertz Technology, Chalmers, Göteborg, Sweden, S03-02, May, 2005.
- [29] J. W. Kooi, M. Chan, B. Bumble, H. G. LeDuc, P. L. Schaffer, and T. G. Phillips, “230 and 492 GHz Low-Noise SIS Waveguide Receivers Employing Tuned Nb/AlOx/Nb Tunnel Junctions”, Int. Journal Infrared Millim. Waves, vol. 16, no. 12, pp. 2049-2068, Dec, 1995.
- [30] A. R. Kerr “Saturation by Noise and CW Signals in SIS Mixers,” Proc. 13th Int. Symposium on Space Terahertz Technology, Harvard University, pp. 11-22, Mar., 2002. [Online]. Available: http://legacy.nrao.edu/alma/memos/html-memos/alma401/memo401.pdf
- [31] W. Menzel, L. Zhu, K. Wu, F. Bögelsack On the design of novel compact broadband planar filters, IEEE Trans. Microwave Theory and Techniques, vol. 51, no. 2, pp. 364-370, Feb., 2003.
- [32] P. Dieleman, H. G. Bukkems, T. M. Klapwijk, M. Schicke, and K. H. Gundlach, “Observation of Andreev Reflection Enhanced Shot Noise , PhysRevLett, Vol. 79, pp. 3486-3489 , Nov., 1997.
- [33] A. R. Kerr, M. J. Feldman, S. K. Pan, “Receiver Noise Temperature, the Quantum Noise Limit, and the Role of the Zero-Point Fluctuations,” Proc. 8th Int. Symposium on Space Terahertz Technology, pp. 101-111, Mar., 1997. [Online]. Available: http://legacy.nrao.edu/alma/memos/html-memos/alma161/memo161.pdf
- [34] S. Rudner, M. J. Feldman, E. Kollberg, and T. Claeson, “Superconducting-Insulator-Superconducting Mixing with Arrays at Millimeter-Wave Frequencies”, J. Applied Physics, Vol. 52, pp. 6366-6371, 1981.
- [35] N. B. Dubash, G. Pance, and M. J. Wengler, “Photon Noise in the SIS detector”, IEEE Trans. Microwave Theory and Techniques, vol. 42, no. 4, pp. 716-725, Apr., 1994.
- [36] N. B. Dubash, M. J. Wengler, and J. Zmuidzinas, “Shot Noise and Photon-Induced Correlations in 500 GHz SIS Detectors”, IEEE Trans. Applied Superconductivity, Vol. 5, no. 2, pp. 3308-3311, Jun., 1995.
- [37] M. J. Wengler, and D. P. Woody, “Quantum Noise in Heterodyne Detection”, IEEE J. Quantum Electronics, Vol. QE-23, no.5, pp. 613-622, May, 1987.
- [38] J. Lamb, Caltech, Private Communication, 2003.
- [39] P. F. Goldsmith, Quasioptical Systems, Piscataway, NJ: IEEE Press, 1998.
- [40] A. Karpov, D. Miller, F. Rice, J. A. Stern, B. Bumble, H. G. LeDuc, J. Zmuidzinas, “Low noise 1 THz 1.4 THz mixers using Nb/AlAlN/NbTiN SIS junctions,” IEEE Trans. Applied Superconductivity, Vol. 17, No. 2, Part 1, pp. 343 346, Jun., 2007.
- [41] H. B. Callen and T. A. Welton, “Irreversibility and generalized Noise,” Phys. Rev., Vol. 83, no. 1, pp. 34-40, Jul., 1951.
- [42] R.Blundell, R. E. Miller, and K. H. Gundlach, “Understanding Noise in SIS Receivers,” Int. J. IR and MM Waves, Vol. 13, No. 1, pp. 3-26, Jan., 1992.
- [43] Q. Ke, and M.J. Feldman, “A Technique for Noise Measurements of SIS Receivers”, IEEE Trans. Microwave Theory and Techniques, Vol. 42, No. 4, pp. 752-755, Apr., 1994.
- [44] M. P. Westig, K. Jacobs, J. Stutzki, M. Schultz, M. Justen, and C. E. Honingh, “Balanced superconductor-insulator-superconductor mixer on a 9 m silicon membrane” Supercond. Sci. Technol. Vol. 24, No. 8, Aug., 2011.
- [45] M. P. Westig, M. Justen, K. Jacobs, J. Stutzki, M. Schultz, F. Schomacker, and C. E. Honingh, “A 490 GHz planar circuit balanced Nb-Al2O3-Nb quasiparticle mixer for radio astronomy: Application to quantitative local oscillator noise determination,” J. Appl. Phys, Vol. 112, 093919, Oct., 2012.
- [46] Pamtech Inc., 4053 CalleTesoro, Camarillo, Ca 93012, USA. [Online] Available: http://pamtechinc.com/
- [47] J. W. Kooi, G. Chattopadhyay, M. Thielman, T. G. Phillips, and R. Schieder, “Noise Stability of SIS Receivers,” Int J. IR and MM Waves, Vol. 21, No. 5, pp. 689-716, May, 2000.
- [48] R. Schieder, and C. Kramer, “Optimization of Heterodyne Observations using Allan Variance Measurements”, Astron. Astrophys 373, pp. 746-756, Jul., 2001.
- [49] V. Ossenkopf, “The stability of spectroscopic instruments: a unified Allan variance computation scheme”, A & A, 479, pp 915 926, Mar., 2008.
- [50] J. D. Kraus, Radio Astronomy, New York: McGraw-Hill, Ch. 3 and 7, 1966.
- [51] J. W. Kooi, J. J. A. Baselmans, A. Baryshev, R. Schieder, M. Hajenius, J. R. Gao, T. M. Klapwijk, B. Voronov, and G. Gol’tsman, “Stability of Heterodyne Terahertz Receivers”, Journal of Applied Physics, Vol. 100, 064904, Sep., 2006.
- [52] M. A. Holdaway, “Effects of Atmospheric Emission Fluctuations and Gain Fluctuations on Continuum Total Power Observations with ALMA”, NRAO, Charlotteville, VA, ALMA Memo 490, Mar. 30, 2004. [Online]. Available: http://legacy.nrao.edu/alma/memos/html-memos/abstracts/abs490.html/
- [53] J. R. Pardo, J. Cernicharo, and E. Serabyn, “Atmospheric Transmission at Microwaves (ATM): An Improved Model for mm/submm applications”, IEEE Trans. on Antennas and Propagation, vol. 49, no. 12, pp. 1683-1694, Dec., 2001.
- [54] P. R. Jewell and J. G. Mangum, “System Temperatures, Single Versus Double Sideband Operation, and Optimum Receiver Performance”, ALMA Memo 170, Apr., 1997.
![[Uncaptioned image]](/html/1402.1223/assets/x21.png) |
Jacob W. Kooi was born in Geldrop, The Netherlands on July 12, 1960. He received his B.S. degree in Microwave Engineering at the California Polytechnic State University in San Luis Obispo, California in 1985, a M.S. degree in Electrical Engineering from the California Institute of Technology in 1992, and Ph.D in Physics at the University of Groningen, the Netherlands in 2008. His research interests are in the area of Millimeter and Submillimeter wave technology, low energy physics, electrodynamics, thermodynamics, low noise amplifiers and associated MMIC technology, Fourier optics, instrumental stability, and their application to astronomy and aeronomy. He is currently with the Combined Array for Research in Millimeter-wave Astronomy (CARMA) at the California Institute of Technology. |
![[Uncaptioned image]](/html/1402.1223/assets/x22.png) |
Richard Chamberlin was graduated from the University of California (Santa Barbara, CA) with a B.S. in physics in 1984, and obtained his Ph.D. in physics from the Massachusetts Institute of Technology (Cambridge, MA) in 1991 under George B. Benedek. He served in the United States Air Force from 1975 to 1979 as a Weather Observer. In 1995 he was the first winter-over scientist with the pioneering Antarctic Submillimeter Telescope and Remote Observatory which he helped design, build, and test while at Boston University. From 1996 to 2010 he was the Technical Manager of the Caltech Submillimeter Observatory. His research interests include water vapor in the atmosphere and terahertz remote sensing. He is currently affiliated with the NIST lab in Boulder, CO. |
![[Uncaptioned image]](/html/1402.1223/assets/x23.png) |
Raquel R. Monje received the M.S. degree in telecommunication engineering from Universidad Europea de Madrid, Spain in 2003, the M.S. degree in digital communications system and technology from Chalmers University of Technology, Gothenburg, Sweden in 2004, and the Ph. D. degree in radio and space science from Chalmers University of Technology, Gothenburg, Sweden in 2008. Her Ph.D thesis was on low noise superconductor-insulator-superconductor (SIS) mixers for submillimeter and millimeter-wave astronomy. She is currently a senior postdoctoral scholar at California Institute of Technology, Pasadena, CA. Her research interests include microwave technology, SIS mixers, millimeter and submillimeter wave heterodyne receivers for astronomy and the associated science resulting from observations. |
![[Uncaptioned image]](/html/1402.1223/assets/x24.png) |
Attila Kovács graduated from Harvard University with an A.B. in physics, astrophysics, and astronomy in 1997, then received his Ph.D. in physics from Caltech in 2006, in the submillimeter astrophysics group lead by Tom G. Phillips. As a student, he pioneered the observing modes (e.g. Lissajous scans) and the most widely used data reduction approach (CRUSH) for ground-based total-power imaging arrays in the submillimeter, and designed the SIS mixers for this work. Later, he worked at the Max Planck Institute for Radioastronomy in Bonn as post-doc, under the mentorship of Karl Menten, taking in a lead in the optimization and commissioning of the APEX bolometer cameras LABOCA (and its polarimetry frontend PolKa) and SABOCA and conducting surveys with them. In 2009 he became an independent postdoc at the University of Minnesota, focusing on improving and commissioning the GISMO 2-mm camera for the IRAM 30-m telescope, and providing the concept of lithograhpic on-chip spectrometers for the (sub)millimeter. Since 2012 he has been back at Caltech as a post-doc with Jonas Zmuidzinas, working on SuperSpec and the MAKO KID camera. He is also part of the ongoing collaborations for the SOFIA HAWC+ upgrade and the GISMO-2 camera. Beyond the technical work, he is also very interested in studying the high-z mm-bright star-forming populations and empirical dust models for understanding them. |
![[Uncaptioned image]](/html/1402.1223/assets/x25.png) |
Frank Rice has been Lecturer in Physics at California Institute of Technology since 2001. He received his physics B.A. from Northwestern University in 1977 and earned his M.S. in physics from Caltech in 1997. Prior to coming to Caltech he served as a light-attack aviator and test pilot in the U.S. Navy. He graduated from Naval Postgraduate School and the U.S. Naval Test Pilot School with a M.S. in aerospace engineering in 1986; he later served as a flight test instructor pilot at USNTPS. At Caltech he has specialized in superconducting physics for millimeter and submillimeter heterodyne receiver design and designed a wide bandwidth, fixed-tuned SIS receiver for 230 GHz which was used as a CSO facility instrument for several years. He designed the operating and bias electronics for this new suite of CSO heterodyne instruments. |
| Hiroshige Yoshida received his M.S. degree in Physics from The University of Tokyo, Tokyo, Japan in 1994. In 1997, he became a staff member of the Caltech Submillimeter Observatory in Hawaii, and has since been developing and maintaining observatory’s software systems. |
| Brian Force is a RF/microwave engineer. Previous technical duties included work at the Caltech Submillimeter Observatory (CSO) and James Clerk Maxwell Telescope (JCMT), both located on Mauna Kea, Hawaii. Part of his assignment included support of the telescopes and help observers operate it. Currently Brian is working for a small high tech company in California designing synthesizers and RF systems. |
![[Uncaptioned image]](/html/1402.1223/assets/x26.png) |
Kevin Cooper is an electronics and software engineer who works at the California Institute of Technology. Part of his duties included designing hardware and software for testing and characterization of the balanced SIS receivers for the Caltech Submillimeter Observatory. |
![[Uncaptioned image]](/html/1402.1223/assets/x27.png) |
David Miller David Miller received his B.S. and M.S. in Electrical Engineering at California State Polytechnic University, Pomona, in 1990 and 1998, respectively. His interests include microwave engineering, low noise and high-stability electronics, and the design, construction, and testing of submillimeter receivers for airborne, satellite, and land-based observatories. He has recently graduated from Talbot School of Theology with M.A. in Theology. Currently he is working for Nuvotronics, LLC, where he designs, builds, tests, and characterizes next-generation multi-watt solid-state power amplifiers in the microwave and millimeter-wave frequency bands. |
![[Uncaptioned image]](/html/1402.1223/assets/x28.png) |
Marty Gould spent 12 years at California Institute of Technology as an Instrument Specialist Machinist, and taught machine shop in the Mechanical Engineering Department. He started Zen Machine and Scientific Instrument in 1985 and moved to Colorado in 1992 where he specializes in scientific research support along with occasionally mentoring high school students in machine shop. |
![[Uncaptioned image]](/html/1402.1223/assets/x29.png) |
Dariusz Lis received his Ph.D. from the University of Massachusetts at Amherst in 1989. He is Senior Research Associate in Physics at the California Institute of Technology and Deputy Director of the Caltech Submillimeter Observatory. His research interests include volatile composition of comets, astrochemistry, molecular spectroscopy of the interstellar medium, isotopic fractionation and deuteration, photon-dominated regions, far-IR continuum and spectroscopic studies of star-forming regions, as well as the ISM in the high-z universe. |
![[Uncaptioned image]](/html/1402.1223/assets/x30.png) |
Bruce Bumble received a B.E. degree in Engineering Physics from Stevens Institute of Technology (Hoboken, NJ) in 1982 and a M.S degree in Material Science from Polytechnic University (Brooklyn, NY) in 1989. He worked on superconducting device fabrication applications in computing at IBM Watson Research and from 1989 to the present is a Member of Technical staff at the Jet Propulsion Laboratory in Pasadena, CA working on superconducting materials and devices mainly for astronomy applications. This includes fabricating SIS and Hot Electron Bolometers for heterodyne mixers from Nb, NbN and NbTiN materials. Current work includes MKID arrays for optical cameras and TES Bolometers for mm wave spectrometers. |
![[Uncaptioned image]](/html/1402.1223/assets/x31.png) |
Tom G. Phillips was educated at Oxford, England, where he received B.A., M.A., and D.Phil. degrees. His graduate studies were in low-temperature physics. After one year at Stanford University, he returned to Oxford for two years and then moved to the Bell Laboratories Physics Research Laboratory at Murray Hill, NJ. There he developed techniques for millimeter and submillimeter wave detection for astronomy. In 1975 he spent one year at London University as University Reader in Physics. In 1980 he joined the faculty of Caltech as Professor of Physics. At Caltech he took on the task of construction of the Owens Valley Radio Observatory millimeter wave interferometer, as Associate Director of the Observatory. In 1982 he became Director Designate for the Caltech Submillimeter wave Observatory, to be constructed in Hawaii, and in 1986, on successful completion of the construction, became Director. His current research interests are in molecular and atomic spectroscopy of the interstellar medium and in the development of superconducting devices for submillimeter-wave detection. |