Parkes full polarization spectra of OH masers - I. Galactic longitudes 350∘ through the Galactic Centre to 41∘
Abstract
Full polarization measurements of 1665 and 1667-MHz OH masers at sites of massive star formation have been made with the Parkes 64-m radio telescope. Here we present the resulting spectra for 104 northerly sources, from Galactic longitude 350∘ through the Galactic Centre to 41∘. Some maser positions were previously uncertain by many arcseconds, and thus for more than 20 masers we made new measurements with the ATCA (which also revealed several hitherto unreported masers), in most cases yielding arcsecond precision to match the majority of sites. Position improvements have assisted us in distinguishing OH masers with accompanying methanol masers from those without (thought to be at a later stage of evolution). There was no existing linear polarization information at many sites, and spectral resolution was sometimes poor, or velocity coverage incomplete. These inadequacies are addressed by the present Parkes spectra. The whole OH maser sample exhibit the well-known predominance of highly circularly polarized features. We find that linear polarization is also common, but usually much weaker, and we highlight the rare cases of very pronounced linear polarization that can extend to 100 per cent. Unusually large velocity ranges of at least 25 are present at seven sites. Our spectra measurements for most sources are at two epochs spaced by nearly one year, and reveal high stability at most sites, and marked variability (more than factors of two in the strongest feature) at only five sites. The spectra also provide a valuable reference for longer term variability, with high stability evident over the past decades at 10 sites and marked variability for four of the sample. Future systematic monitoring of these variables may uncover further examples of periodicity, a phenomenon so far recognised in only one source.
keywords:
ISM: Massive Star Formation - masers - polarization - magnetic field1 Introduction
Our objective has been to obtain full polarization spectra, at high velocity resolution, of masers at the 1665- and 1667-MHz transitions of OH accessible to the Parkes telescope. We restricted our sample to sites in star formation regions (SFRs), thus excluding masers around late-type AGB stars which represent a quite different field of study. Often associated with OH in SFRs are methanol masers. Blind maser surveys are a major tool for pinpointing sites of massive star formation and, for such surveys, methanol at 6668 MHz has recently become the maser of choice (e.g. Green et al. 2009, 2010; Caswell et al. 2010b) since it is exclusively associated with high mass star formation and is commonly stronger than OH. But OH masers, none the less, retain a special role in star formation studies by virtue of their remarkable polarization properties, which are clear signatures of the strong magnetic fields where the masers originate.
Early measurements of OH masers, despite the low spatial resolution of most single dishes used more than 40 years ago, revealed remarkable circular and linear polarization, sometimes approaching 100 per cent. Reliable measurement of linear polarization, as well as circular (e.g. Robinson et al. 1970), was performed for a handful of sources, but was observationally intensive in view of intrumental limitations. As a consequence, polarization studies of OH masers thereafter have mostly been confined to the simpler measurement of circular polarization. Catalogued southern OH masers with precise positions now exceed several hundred (Caswell 1998), but some lack published spectra, especially sources discovered with the Australia Telescope Compact Array (ATCA), observed only with low spectral resolution, and restricted to total intensity information. For many other sources, published spectra are available from Parkes observations, but date from 25 years ago, and limited to circular polarization.
Notable amongst the rare studies where full polarization has been measured are those using long baseline interferometer arrays such as the VLBA (e.g. Fish et al. 2005) and MERLIN (e.g. Hutawarakorn & Cohen 1999). Such high spatial resolution might be thought essential to minimise depolarization from blending of differently polarized features; but fortunately, the high resolution studies have shown that, at any single velocity, there is often a single dominant feature, with only minor contributions from spatially nearby features, and thus depolarization in observations with low spatial resolution is not excessive. In view of this, and the slow progress in long baseline interferometry observations of most masers, a practical and faster means to advance polarization and other studies is to first acquire high quality single dish spectra of all the known OH masers.
Even for single dish observations, it is only in the past decade that instrumentation has allowed optimum spectral line observations for studying OH masers, i.e. with full polarimetry, high spectral resolution, adequate velocity coverage, and preferably simultaneous coverage of more than one transition. Further instrumental development extending such capabilities to interferometer arrays is even more recent, as provided for the ATCA by CABB (the Compact Array Broadband Backend (Wilson et al. 2011; Caswell & Green 2011)). Here we report the results of an extensive polarimetric survey of OH masers conducted in 2004 and 2005 with the Parkes telescope.
Positions for most targets have arcsecond accuracy and were primarily taken from Caswell (1998). A few southern sources discovered since 1998 were added to this sample, and some more northerly sources were also added, mostly those with positions reported by Forster & Caswell (1989, 1999) and by Argon, Reid, & Menten (2000). Where required, additional new positions were obtained with the ATCA, as described in the next section.
Contemporaneously with our observations, a similar survey targeting nearly 100 northern sources was conducted by Szymczak & Gerard (2009) with the Nancay radio telescope (hereafter the NRT as abbreviated by the authors) and this has allowed us to make valuable comparisons with the sources in common. In the region of sky overlapping the NRT observations, our measurements of about 100 sources include 50 in common with the NRT sample.
The present paper (Paper I) reports our results for sources in the Galactic longitude range 350∘ through the Galactic Centre to 40∘, thus capturing the full overlap with the NRT sample, and any VLBA or MERLIN targets. In total, we present spectra for 104 distinct maser sites, of which 23 have improved positions reported for the the first time in the present paper. A subsequent paper (Paper II) will present results for the remainder of the sample, a somewhat larger number of more southerly sites from Galactic longitude 240∘ to 350∘, for which there have been extremely few other observations.
The present large sample of full polarization spectra allows a good
assessment of the incidence of linear polarization, and reveals
some remarkable examples whose further study may elucidate reasons for
the occasional occurrence of extremely high linear polarization.
The full interpretation of the polarization spectra is beyond the
scope of the present paper, but indications of the outcomes expected
are shown in the analysis by Wright et al. (2004a,b) of the much
studied source W3(OH). The study of masers
around this young ultra-compact H ii region (ucH ii) allows uniquely
detailed characterisation of the molecular material around the ucH ii region, revealing the orientation of a slowly expanding,
rotating, torus, and its magnetic field distribution, in addition to the
physical properties of density, OH abundance and temperature implied by
the masing of the OH molecules. In other studies, Hutawarakorn & Cohen
(1999) link magnetic field orientations to outflow phenomena, and
Fish & Reid (2006) argue persuasively for magnetic field direction
preservation during collapse to a star; the high magnetic energy
density implied from the maser polarization measurements suggest that
magnetic fields may be a controlling influence in the collapse to form
the star (e.g. Asanok et al. 2010, Caswell, Kramer & Reynolds
2011a). Results of the present study reveal candidates that are
especially worthy of further exploration with the expectation of
fruitful interpretation similar to the above.
2 Observations and data reduction
2.1 Position determinations with the ATCA
Improved position determinations for more than 20 sources were made in two periods with the ATCA. The first session (within project c906f) 2005 March 28, was conducted in a 6-km configuration, yielding typical position accuracy of 1 arcsec. The second session (project c1386, 2005 May 24), specifically targeted sources close to declination zero, and used the hybrid configuration H168 which has some baselines NS as well as EW, but extending only to slightly beyond 168m. For such short baselines, the synthesised beam is approximately 2 x 3 arcmin, and rms position uncertainties, evaluated individually for each source, ranged from several arcseconds for strong sources to greater than 10 arcseconds for the weakest sources, but in all cases usefully improving upon existing information.
2.2 Parkes spectral line observations
The Parkes 64-m radio telescope was used in two observing periods, 2004 November 23-27 and 2005 October 26-30 (project p484). The receiver accepted two orthogonal linear polarizations, followed by digital filters that restricted the processed signal to a 4-MHz bandpass before entering a correlator. Several correlators are available at Parkes, and the one selected as most suitable was the ‘Parkes multibeam correlator’, with a new configuration. The 32 blocks of 1024 spectral channels were concatenated to provide single-beam full polarimetry yielding four polarization products, each with 8192 channels. These outputs can be manipulated in the software processing to provide the four Stokes parameters, I, Q, U and V, and any other equivalent representation such as RHCP and LHCP (right-hand and left-hand circular polarization respectively) for I and V; and linearly polarized flux density and its polarization position angle for Q and U. A similarly novel correlator configuration with concatenated blocks of the multibeam correlator was used in earlier Parkes observations to provide 16384 channels for each of two input polarizations when only the autocorrelations were required (Caswell 2004b).
In the present work, since two orthogonal linear polarizations are sampled, the autocorrelations are summed to provide total intensity (I), and differenced to produce Q (in the case where the Position Angle of one feed is set at zero). With IAU conventions as summarized by Hamaker & Bregman (1996), the cross-correlation provides U from the ‘in-phase’ or ‘real’ part, and V from the ‘quadrature’ or ‘imaginary’ part, provided that there is zero phase path difference between the inputs. During the hardware set-up, the phase path difference was adjusted to zero, with error no worse than 5∘, so as to minimise leakage between the in-phase and in-quadrature outputs.
For each target, an observation of 10 min was made in most cases, but reduced to 4 min for some strong sources, and increased to 20 min for weak sources. During each observation, in order to maintain a constant Receiver Position Angle on the sky, we slowly rotated the receiver at the rate needed to compensate for the parallactic angle change that occurs with an altitude-azimuth mounted telescope. No reference spectra were taken, since the digital filters provide an inherently flat baseline and we found that a linear sloping baseline subsequently proved adequate for the final processing in most cases. Man-made interference at these frequencies is rare at the Parkes observatory. Internally generated interference affected a small amount of 1667-MHz data but with negligible effect on the final results. The few instances with interference on the displayed profiles are at 1667 MHz near velocity +110 in the spectra of 12.026–0.032, 24.494–0.039, 29.862–0.040, 29.956–0.015 and 30.820–0.060.
In addition to real time display of the correlator output as it accumulated, data quality was monitored at completion of each source observation, using the ATNF spectral line reduction program spc for rapid preliminary display of RHCP, LHCP, and Q and U.
During the 2005 sessions, the Position Angle for one of the probes was kept at zero (by maintaining a Receiver Position Angle of +45∘, or alternatively at –45∘ for locations where rotation limitations of the cabling prevented +45∘). At this epoch, Q is therefore the difference of the auto-correlations, and U is the real part of the cross-correlations. During the 2004 sessions, the Position Angle for one of the probes was kept at 45∘; at this epoch, U is therefore the difference of the autocorrelations (and Q is the real part of the cross-correlations). The different observing procedure at the two epochs was intentional, since it gave the opportunity of comparing the errors arising from differencing and cross-correlation, which are quite distinct.
2.3 Alternative polarization observing strategies
Since full polarization spectroscopy from a dual-channel receiver on a single dish can be achieved by a variety of methods, we briefly review their respective advantages and disadvantages.
The Position Angle of the probes on the sky needs to be known, although not necessarily set to zero or 45∘; but if allowed to be at some intermediate angle, then each linear polarization measurement is a combination of Q and U that must later be disentangled; furthermore, if the Position Angle is changing, this must be corrected for within each short integration before summing over the typical 10-minute observation. Our procedure removes this requirement.
We note that, in an alternative strategy, if the two circular polarizations are sampled, then autocorrelations provide RHCP and LHCP, with their sum yielding total intensity, I, and their difference, V; cross-correlation (in phase and in quadrature), produces U and Q. In this observing mode, it is the circular polarization that is crucially dependent on the precise amplitude scaling of the two channels. The issue of determining the polarization position angle remains the same as for the linear probe case.
For comparison with the NRT observations (Szymczak & Gerard 2009) we note that their signal is derived from two orthogonal feeds, with receiver orientation maintained at a constant position angle. Cross correlations are not measured directly, but in parallel to the processing of the signal from each feed, the signals are fed into an RF hybrid so as to electronically generate RHCP and LHCP (and hence V as the difference in Stokes parameter terminology). The direct processing provides I as the sum, and Q as the difference; a separate observation is made after feed rotation by 45∘ which provides U as the difference and a repeat measurement of I and V.
Strategies with interferometric arrays are less varied. For the most recent capabilities on the ATCA with CABB, we note that linearly polarized feeds are used and the correlations (between antennas) of the parallel feeds are recorded, equivalent to single dish auto-correlations, and also the correlations (between antennas) of the orthogonal feeds, equivalent to the single dish cross-correlations. However, no physical receiver rotation is employed, with the corresponding equivalent rotation performed in software at the reduction stage. VLA and VLBA procedures are similar to the ATCA except that the ‘native’ polarization sampling is performed with circularly polarized feeds.
2.4 Final spectral line reduction in asap
The ATNF program asap (ATNF Spectral line Analysis Package) was used for final reduction of data. Amplitude scaling was applied so that the final intensity calibration is relative to the source 1934-638, for which a total intensity at 1666 MHz of 14.16 Jy has been adopted. This is equivalent to a flux density of 36.4 Jy for Hydra A, and thus essentially the same as used in earlier work (Caswell & Haynes 1987 and references therein) where Hydra A was used as a calibrator with assumed flux density 36 Jy.
The recorded data comprised 8192-channel spectra across 4 MHz for each of the autocorrelations from the orthogonal linear probes, XX, and YY, and for the real and imaginary parts of their cross-correlation, ReXY and ImXY.
In 2005, with the chosen orientation of the receiver, Q=XX–YY; For the receiver orientation used in 2004, U=XX–YY. It is useful to note that subsequent corrections may modify signs of Q or U, (and add a small fraction of V) but, essentially, only Q is dependent on the relative gains of the two receiver channels in 2005, whereas only U is dependent on the relative gains of the receivers in 2004. Input parameters to asap for each observation include the receiver position angle so as to distinguish these cases. Correction of any small phase error between cross-correlation inputs using the asap task ‘rotate_xyphase’ removes any small cross-contamination between V and either Q (in 2004) or U (in 2005). For the 2004 data, a phase rotation of -5∘ was required, whereas for the 2005 data, no correction was needed.
From the and spectra, we also created spectra of total
linearly polarized intensity, (which we
abbreviate to LINP in plot labels) and spectra of
position angle of linear polarization,
(subsequently referred to as ‘polarization position angle’,
abbreviated to ‘ppa’).
Concise graphical display of full polarization spectral data presents a
difficult choice, and some degree of compromise.
We choose to display the results as two panels of spectra for each
transition, showing:
1. Spectra of RHCP and LHCP, respectively (I+V)/2 and (I–V)/2,
overlaid with the linear polarization, .
2. Overlaid spectra of I with Q and U.
We note that RHCP, LHCP, Q and U are a full represntation of the Stokes
parameters; we have not chosen to display V since the individual RHCP
and LHCP spectra are usually more informative for OH masers with large
Zeeman splitting in commonly encountered magnetic fields of several mG.
Furthermore, where the percentage of circular polarization is especially
interesting (approaching 100 per cent), this is clear from the RHCP and
LHCP spectra.
The added superposed plots of LINP and I are useful as an indication of
fractional polarization. However, the presence of weak linear
polarization is most reliably seen on the Q
and U spectra. The value of linearly polarized intensity (derived from
Q and U as noted above) has a positive noise bias; we have chosen to
limit the display to values exceeding 5 times the rms
noise level, where the positive noise bias of real signals becomes
insignificant, and very few spurious emission noise spikes remain.
Features with high linear polarization are clearly evident from
comparing this plot with the plot of total intensity.
The polarization position angle is a noisy quantity which we have chosen
not to show, but the plots of Q and U indicate it qualitatively,
noting that ppa = ; in cases of special
interest, the ppa is discussed in the source notes.
3 Results
| Source Name | Equatorial Coordinates | Refpos | Vel. range | Lin(5,7) | Refpol | m/OH | ||||||
| ( l, b ) | RA(2000) | Dec(2000) | ||||||||||
| ( ∘ ∘ ) | (h m s) | ( ∘ ’ ”) | () | (Jy) | (Jy) | (Jy) | (Jy) | |||||
| 350.0111.342 | 17 25 06.50 | 38 04 00.7 | C98 | 26.5 | 17.5 | 4.3 | 4.4 | 11.0 | 4.5 | 5P; 7p | v | 1/1.9 |
| 350.015+0.433 | 17 17 45.44 | 37 03 12.9 | C98 | 35 | 32 | 1.0 | 1.1 | 0.15 | c | 1/6.5 | ||
| 350.113+0.095 | 17 19 25.58 | 37 10 04.5 | C98 | 80.5 | 65 | 33 | 2.3 | 34 | 2.6 | 5P; 7p | vc | |
| 350.329+0.100 | 17 20 01.61 | 36 59 15.6 | C98 | 67 | 63 | 0.3 | 0.15 | 0.3 | 0.15 | 5P | ||
| 350.6860.491 | 17 23 28.68 | 37 01 48.1 | C98 | 16.5 | 13 | 0.8 | 0.2 | 0.9 | 0.2 | 20 | ||
| 351.160+0.697 | 17 19 57.35 | 35 57 52.4 | C98 | 15.5 | 3.5 | 125 | 78 | 96 | 80 | 5P; 7P | vc | 1/5.6 |
| 351.417+0.645 | 17 20 53.39 | 35 47 01.8 | C98 | 13 | 6 | 390 | 80 | 400 | 79 | 5p; 7p | vc | 9.0 |
| 351.5810.353 | 17 25 25.25 | 36 12 45.1 | C98 | 102 | 89 | 7.1 | 0.3 | 7.0 | 0.2 | 5P | vc | 6.7 |
| 351.7750.536 | 17 26 42.56 | 36 09 17.6 | C98 | 36 | 8 | 190 | 22 | 85 | 22 | 5P; 7P | Vvc | 2.7 |
| 352.161+0.200 | 17 24 46.28 | 35 25 20.2 | C98 | 43 | 41 | 2.45 | 2.4 | 0.2 | 5p | c | ||
| 352.5170.155 | 17 27 11.34 | 35 19 32.2 | C98 | 56 | 43 | 3.8 | 1.9 | 3.9 | 2.2 | 5p; 7p | c | 2.5 |
| 352.6301.067 | 17 31 13.91 | 35 44 08.4 | C98 | 6.5 | 6 | 1.3 | 0.45 | 1.2 | 0.55 | 5p; 7P | 15 | |
| 353.4100.360 | 17 30 26.20 | 34 41 45.5 | C98 | 21 | 18 | 24 | 0.2 | 26 | 0.3 | 5P | vc | 4.5 |
| 353.464+0.562 | 17 26 51.56 | 34 08 24.8 | C98 | 46 | 43 | 3.3 | 4.4 | 5P | c | 2.7 | ||
| 354.615+0.472 | 17 30 17.07 | 33 13 54.6 | C98 | 34 | 13 | 4.5 | 2.7 | 5.5 | 3.0 | 5P; 7p | c | 30 |
| 354.724+0.300 | 17 31 15.52 | 33 14 05.3 | C98 | 90 | 97 | 1.15 | 0.3 | 1.2 | 0.3 | 10 | ||
| 355.344+0.147 | 17 33 29.05 | 32 47 58.2 | C98 | 13 | 23 | 21.1 | 0.7 | 22 | 0.8 | 5p | vc | 1/2.2 |
| 356.6620.264 | 17 38 29.22 | 31 54 40.6 | C98 | 57.5 | 40 | 1.5 | 0.3 | 1.15 | 0.4 | 5P; 7P | c | 7.0 |
| 357.9680.163 | 17 41 20.36 | 30 45 05.5 | C98 | 10.5 | 2 | 0.4 | 0.2 | 0.35 | 0.2 | 5p | 120 | |
| 358.3870.483 | 17 43 37.83 | 30 33 50.2 | C98 | 9 | 4.5 | 0.55 | 0.3 | 0.4 | 0.4 | 14 | ||
| 359.137+0.032 | 17 43 25.62 | 29 39 17.3 | C98 | 7 | 0.5 | 7.4 | 3.5 | 7.5 | 4.0 | vc | 2.1 | |
| 359.4360.103 | 17 44 40.54 | 29 28 15.1 | C98 | 53.5 | 50.5 | 6.6 | 0.9 | 7.0 | 0.7 | 5p | vc | 10 |
| 359.6150.243 | 17 45 39.07 | 29 23 29.1 | C98 | 10 | 26 | 7.5 | 2.3 | 8.0 | 1.9 | 5p; 7p | c | 4.9 |
| 359.9700.457 | 17 47 20.17 | 29 11 58.8 | C98 | 14 | 23.5 | 15.0 | 0.7 | 19.8 | 0.3 | 5P; 7p | vc | 1/8.3 |
| 0.376+0.040 | 17 46 21.38 | 28 35 39.2 | C98 | 28.5 | 40 | 6.3 | 3.9 | 6.0 | 3.4 | 5p; 7p | Nvc | 1/3 |
| 0.496+0.188 | 17 46 04.03 | 28 24 52.6 | C98 | 10 | 5 | 0.4 | 0.4 | 62 | ||||
| 0.5460.852 | 17 50 14.52 | 28 54 31.5 | C98 | 4 | 20.5 | 4.2 | 8.8 | 3.8 | 8.6 | 7p | Nvc | 14.8 |
| 0.6580.042 | 17 47 20.47 | 28 23 45.6 | C98 | 65 | 77 | 210 | 27 | 220 | 27 | 5p | Nvc | |
| 0.6660.035 | 17 47 20.12 | 28 23 06.2 | C98 | 45 | 62 | 30 | 29 | 30 | 37 | 5p; 7p | Nvc | |
| 2.143+0.009 | 17 50 36.13 | 27 05 47.2 | C98 | 58 | 66.5 | 8.6 | 0.5 | 8.0 | 0.9 | 5p | Nvc | 1/1.1 |
| 3.910+0.001 | 17 54 38.77 | 25 34 45.2 | C98 | 17 | 20 | 4.5 | 0.3 | 4.5 | 0.3 | 5p | c | 1.1 |
| 5.8850.392 | 18 00 30.39 | 24 04 04.2 | C98 | 44 | 18 | 5.8 | 10.0 | 6.8 | 10.0 | 5P; 7p | Vv | 1/10 |
| 6.0481.447 | 18 04 53.15 | 24 26 42.2 | C98 | 10 | 12 | 6.6 | 0.65 | 7.5 | 0.7 | Nv | ||
| 6.7950.257 | 18 01 57.72 | 23 12 34.6 | C98 | 13 | 24 | 4.6 | 1.3 | 4.6 | 1.3 | 5p | 20 | |
| 8.6690.356 | 18 06 19.01 | 21 37 32.8 | C98 | 38 | 42 | 2.5 | n | 2.4 | n | 5p | c | 4.0 |
| 8.6830.368 | 18 06 23.46 | 21 37 10.2 | C98 | 35 | 45.5 | 3.4 | 1.4 | 3.9 | 1.4 | 5p; 7P | c | 30 |
| 9.619+0.193 | 18 06 14.92 | 20 31 44.0 | C98 | 5 | 6 | 4.0 | 3.2 | 5P | NVvc | 22 | ||
| 9.620+0.194 | 18 06 14.87 | 20 31 36.7 | C98 | 3 | 25 | 1.2 | 5.0 | 1.2 | 5.0 | NVvc | ||
| 9.621+0.196 | 18 06 14.69 | 20 31 32.1 | C98 | 4 | 2 | 8.5 | 9.0 | 8.6 | 9.0 | 5p; 7P | NVvc | 578 |
| 10.4440.018 | 18 08 44.88 | 19 54 37.9 | C98 | 74 | 77 | 0.4 | 2.4 | 0.4 | 2.4 | 5P; 7P | 10 | |
| 10.473+0.027 | 18 08 38.25 | 19 51 49.4 | C98 | 43.5 | 71 | 1.2 | 1.4 | 0.9 | 1.5 | 5p; 7P | 18.7 | |
| 10.480+0.033 | 18 08 37.87 | 19 51 16.1 | C98 | 65 | 67 | 0.6 | 0.5 | n | 44 | |||
| 10.6230.383 | 18 10 28.67 | 19 55 49.1 | C98 | 3.5 | 3.5 | 25 | 20 | 27 | 21 | 5P; 7P | NVvc | |
| 11.034+0.062 | 18 09 39.86 | 19 21 21.2 | C98 (FC89) | 19 | 28 | 6.0 | 6.0 | 5p | Nc | 1/10 | ||
| 11.113+0.050 | 18 09 53.3 | 19 17 32 | text | 2.5 | 17.5 | 0.6 | 0.6 | 0.65 | 0.7 | 7p | ||
| 11.9030.102 | 18 12 02.70 | 18 40 24.7 | text | 34 | 35 | 1.0 | 1.0 | 5P | 11.3 | |||
| 11.9040.141 | 18 12 11.46 | 18 41 29.6 | C98 (FC89) | 39.5 | 45 | 10.0 | 1.6 | 11.0 | 1.7 | 5p | Nc | 5.9 |
| 12.0260.032 | 18 12 01.88 | 18 31 55.6 | text | 103 | 110 | 0.45 | 0.3 | 0.45 | 0.3 | c | 213 | |
| 12.2000.033 | 18 12 23.44 | 18 22 49.3 | text | 46 | 48 | 0.8 | 0.9 | 15.5 | ||||
| 12.2090.103 | 18 12 39.91 | 18 24 18.1 | text | 12 | 27 | 3.5 | 5.5 | 1.5 | 5p | Nvc | 2.0 | |
| 12.2160.119 | 18 12 44.45 | 18 24 24.6 | C98 (FC89) | 26 | 32 | 12.5 | 5.0 | 14.0 | 5.2 | 5p; 7p | Nvc | |
| 12.6800.183 | 18 13 54.79 | 18 01 47.9 | C98 | 55 | 67 | 14.5 | 4.8 | 14.5 | 5.6 | 5p | Nvc | 24 |
| 12.889+0.489 | 18 11 51.49 | 17 31 30.8 | C98 | 31 | 35.5 | 6.5 | 1.9 | 6.9 | 1.9 | 5P; 7P | Nv | 10 |
| 12.9080.260 | 18 14 39.53 | 17 52 01.1 | C98 | 28 | 42 | 49 | 55 | 47 | 75 | 5P; 7P | Nvc | 5.5 |
| Source Name | Equatorial Coordinates | Refpos | Vel. range | Lin(5,7) | Refpol | m/OH | ||||||
|---|---|---|---|---|---|---|---|---|---|---|---|---|
| ( l, b ) | RA(2000) | Dec(2000) | ||||||||||
| ( ∘ ∘ ) | (h m s) | ( ∘ ’ ”) | () | (Jy) | (Jy) | (Jy) | (Jy) | |||||
| 13.6560.599 | 18 17 24.27 | 17 22 13.4 | text | 40.5 | 63.5 | 31 | 2.3 | 24 | 2.4 | 5P; 7p | N | 1.1 |
| 14.1660.061 | 18 16 26.05 | 16 39 57.1 | text | 26.5 | 69 | 0.4 | 3.0 | 7p | c | |||
| 15.0340.677 | 18 20 24.75 | 16 11 34.9 | C98 (FC89) | 19 | 23 | 4.5 | 5.0 | 10.7 | ||||
| 16.5850.051 | 18 21 09.21 | 14 31 48.4 | FC89 | 56.5 | 65 | 0.8 | 0.35 | 0.65 | 0.35 | Nc | 55.4 | |
| 16.8642.159 | 18 29 24.43 | 15 16 05.0 | text | 14.5 | 24 | 4.3 | 0.65 | 4.3 | 0.6 | 5p | 6.5 | |
| 17.639+0.158 | 18 22 26.31 | 13 30 11.8 | A00 | 19.5 | 42 | 3.2 | 0.8 | 3.5 | 1.5 | 5P; 7P | v | 7.1 |
| 18.4610.004 | 18 24 36.36 | 12 51 07.5 | text | 46 | 55 | 4.5 | 1.1 | 4.6 | 1.1 | 5p; 7p | Nc | 5.4 |
| 18.551+0.035 | 18 24 38.17 | 12 45 15.4 | text | 34 | 37.5 | 0.45 | 1.6 | 0.4 | 1.6 | c | ||
| 19.471+0.170 | 18 25 54.53 | 11 52 39.5 | text | 9.5 | 16 | 3.0 | 0.2 | 4.0 | 0.3 | 5p | c | 1.0 |
| 19.473+0.170 | 18 25 54.91 | 11 52 31.5 | text | 17 | 22.5 | 24 | 5.8 | 19.0 | 6.5 | 5P; 7p | Nc | 1/1.4 |
| 19.486+0.151 | 18 26 00.48 | 11 52 21.8 | text | 23 | 25 | 2.4 | 1.3 | 2.0 | 1.0 | 5p; 7p | Nc | 2.5 |
| 19.6090.234 | 18 27 38.08 | 11 56 36.5 | FC89 | 18 | 45 | 5.1 | 1.2 | 5.0 | 1.1 | 5p | c | 1/7.7 |
| 19.6120.135 | 18 27 16.84 | 11 53 41.0 | FC89 | 51.5 | 55.5 | 0.85 | 1.1 | 5P | Nc | |||
| 20.0810.135 | 18 28 10.28 | 11 28 48 | A00 | 42 | 51 | 11.0 | 0.7 | 11.5 | 0.8 | 5p | Nvc | 1/3.7 |
| 20.237+0.065 | 18 27 44.54 | 11 14 56.3 | text | 70.5 | 77 | 3.0 | 0.55 | 3.0 | 0.6 | 5p; 7P | Nc | 27 |
| 21.7950.128 | 18 31 22.83 | 09 57 26.8 | text | 36.5 | 40 | 0.7 | 5p | |||||
| 21.880+0.014 | 18 31 01.8 | 09 49 01 | text | 19.5 | 21.5 | 0.4 | 0.35 | 43 | ||||
| 22.4350.169 | 18 32 43.83 | 09 24 32.8 | text | 24.5 | 35.5 | 9.7 | 0.2 | 10.0 | 0.2 | 5P | Nc | 2.0 |
| 23.0100.411 | 18 34 40.26 | 09 00 37.5 | FC89 | 64 | 84 | 2.6 | 1.2 | 2.4 | 0.9 | 5P | Nc | 167 |
| 23.4370.184 | 18 34 39.26 | 08 31 39.6 | FC89, text | 105 | 107 | 11.2 | 0.5 | 13.0 | 0.9 | Nc | 3.7 | |
| 23.4400.182 | 18 34 39.19 | 08 31 25.7 | FC89, text | 100.5 | 105 | 2.0 | 1.1 | 2.0 | 1.2 | 5p | Nc | 8.0 |
| 23.4560.200 | 18 34 44.70 | 08 31 03.6 | text | 67 | 69 | 2.7 | 2.6 | |||||
| 24.329+0.145 | 18 35 08.09 | 07 35 03.6 | CG11 | 63 | 112 | 0.2 | 5.9 | 0.2 | 4.6 | 7P | c | 1.4 |
| 24.4940.039 | 18 36 05.84 | 07 31 19.5 | CG11 | 108 | 117 | n | n | 1.1 | 0.9 | N | 11 | |
| 24.790+0.084 | 18 36 12.45 | 07 12 10.6 | CG11; FC89 | 100 | 114.5 | 5.0 | 0.8 | 3.5 | 0.9 | 5P | Nc | 16 |
| 28.1470.004 | 18 42 42.57 | 04 15 35.5 | A00; text | 100 | 104 | 4.5 | n | 4.2 | 0.3 | 5p | Nvc | 14 |
| 28.2010.049 | 18 42 58.07 | 04 13 57.0 | A00 | 92 | 100 | 12.0 | 2.8 | 12.5 | 2.8 | 5p; 7p | Nvc | 1/3.4 |
| 28.862+0.065 | 18 43 46.34 | 03 35 29.9 | FC89 | 100 | 108 | 13.5 | 3.4 | 15.0 | 3.7 | 5p; 7p | c | 1/12 |
| 29.8620.040 | 18 45 58.52 | 02 45 01.7 | text | 101 | 104.5 | 1.2 | 1.3 | 5P | N | 52 | ||
| 29.9560.015 | 18 46 03.74 | 02 39 21.4 | text | 97.5 | 99 | 1.3 | 1.4 | N | 143 | |||
| 30.5890.043 | 18 47 18.81 | 02 06 16.9 | A00 | 35.5 | 44.5 | 7.0 | 7.0 | 8.5 | 7.5 | 7p | Nvc | 1/1.1 |
| 30.7030.069 | 18 47 36.76 | 02 00 54.5 | A00 | 79 | 97.5 | 14.0 | 9.0 | 14.0 | 10.0 | 5P; 7P | Nvc | 6.4 |
| 30.8200.060 | 18 47 48.00 | 01 54 24.4 | text | 100 | 108 | 3.0 | 1.5 | 3.0 | 1.0 | Nc | 6.0 | |
| 30.788+0.204 | 18 46 48.1 | 01 48 54 | text | 77 | 84 | 1.0 | 1.0 | N | 22 | |||
| 30.819+0.273 | 18 46 36.73 | 01 45 21.0 | text | 99 | 105 | 3.5 | 1.1 | 4.0 | 1.1 | 5p | Nc | 2.0 |
| 30.897+0.161 | 18 47 09.14 | 01 44 17 | text | 107.5 | 108.5 | 2.0 | text | 37 | ||||
| 31.2430.111 | 18 48 45.10 | 01 33 13.3 | FC89 | 18.5 | 26 | 2.0 | 1.9 | 5p | c | |||
| 31.281+0.061 | 18 48 12.48 | 01 26 30.0 | FC89 | 103 | 108.5 | 2.2 | 1.1 | 2.2 | 1.8 | 5p | Nc | 36 |
| 31.3940.258 | 18 49 33.05 | 01 29 09 | text | 81 | 89.5 | 1.4 | 0.4 | 1.4 | 0.3 | |||
| 31.412+0.307 | 18 47 34.25 | 01 12 46.1 | A00 | 86.5 | 113 | 2.3 | 10.0 | 2.8 | 10.5 | 5P; 7p | Nv | 1.1 |
| 32.7440.076 | 18 51 21.89 | 00 12 05.5 | FC89; A00 | 25.5 | 41 | 4.5 | 1.5 | 2.8 | 1.4 | 5p; 7P | Nvc | 16 |
| 33.1330.092 | 18 52 08.01 | 00 08 12.3 | FC89 | 72 | 82 | 15.5 | 0.95 | 16.0 | 0.9 | 5p | Nc | 1/1.3 |
| 34.258+0.153 | 18 53 18.73 | 01 15 00.3 | FC89; A00 | 55 | 63 | 78 | 112 | 78 | 118 | 5p; 7P | NVvc | 1/4.2 |
| 34.411+0.231 | 18 53 18.83 | 01 25 18.2 | text | 53 | 57 | 2.5 | 1.8 | 4.5 | 2.5 | 5P | ||
| 35.025+0.350 | 18 54 00.68 | 02 01 19.3 | FC89; A00 | 40.5 | 51.5 | 19.5 | 19.5 | 0.2 | 5p | Nvc | 2.9 | |
| 35.1970.743 | 18 58 12.97 | 01 40 37.7 | FC89 | 24.5 | 38 | 15.0 | 0.9 | 13.0 | 0.3 | 5P; 7P | Nvc | 8.0 |
| 35.2011.736 | 19 01 45.60 | 01 13 33.3 | FC89 | 38.5 | 46 | 6.0 | 5.5 | 9.0 | 6.0 | 5p; 7p | Nvc | 81 |
| 35.5780.030 | 18 56 22.54 | 02 20 28.1 | FC89; A00 | 44.5 | 53 | 60 | 20 | 60 | 9.8 | 5P; 7p | Vvc | |
| 40.426+0.700 | 19 02 39.62 | 06 59 12.0 | text | 7.5 | 17 | 5.0 | 0.2 | 7.8 | 0.3 | 5p | N | 2.1 |
| 40.6230.138 | 19 06 01.64 | 06 46 36.5 | FC89; A00 | 24.5 | 36.5 | 112 | 15.0 | 119 | 15.0 | 5P; 7p | NVvc | 1/9.2 |
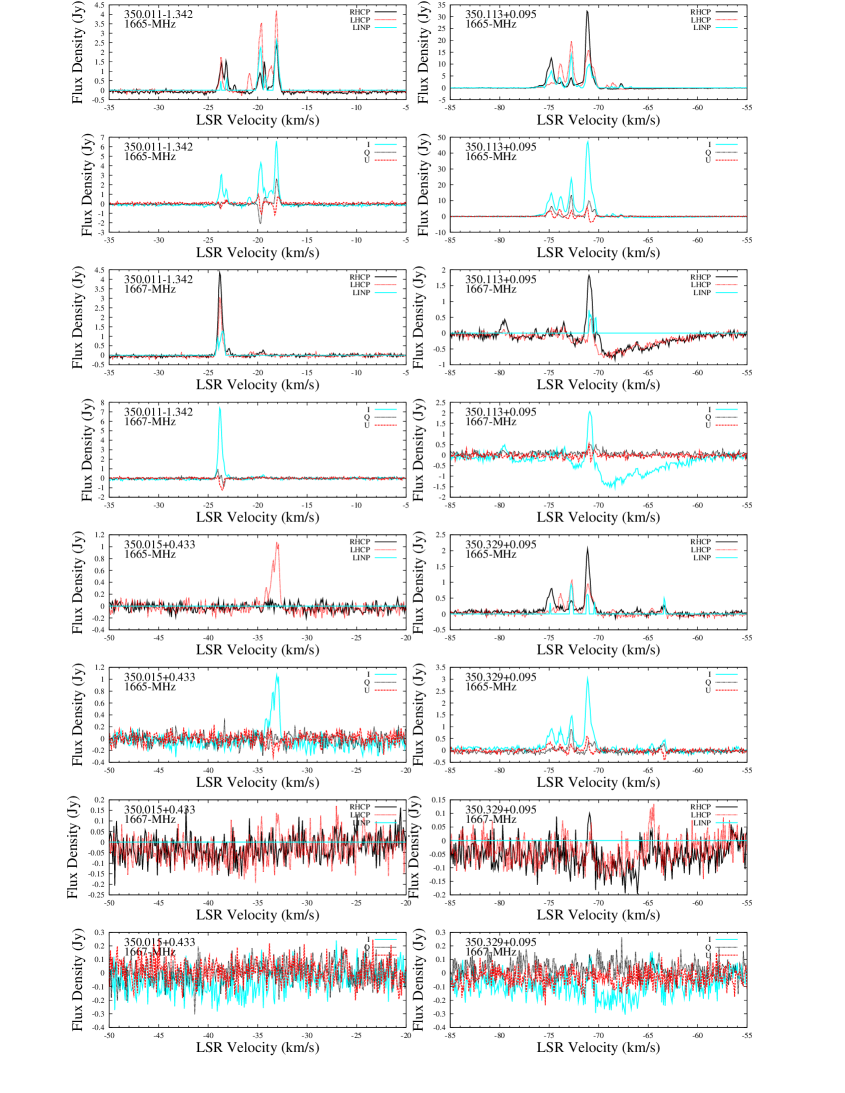
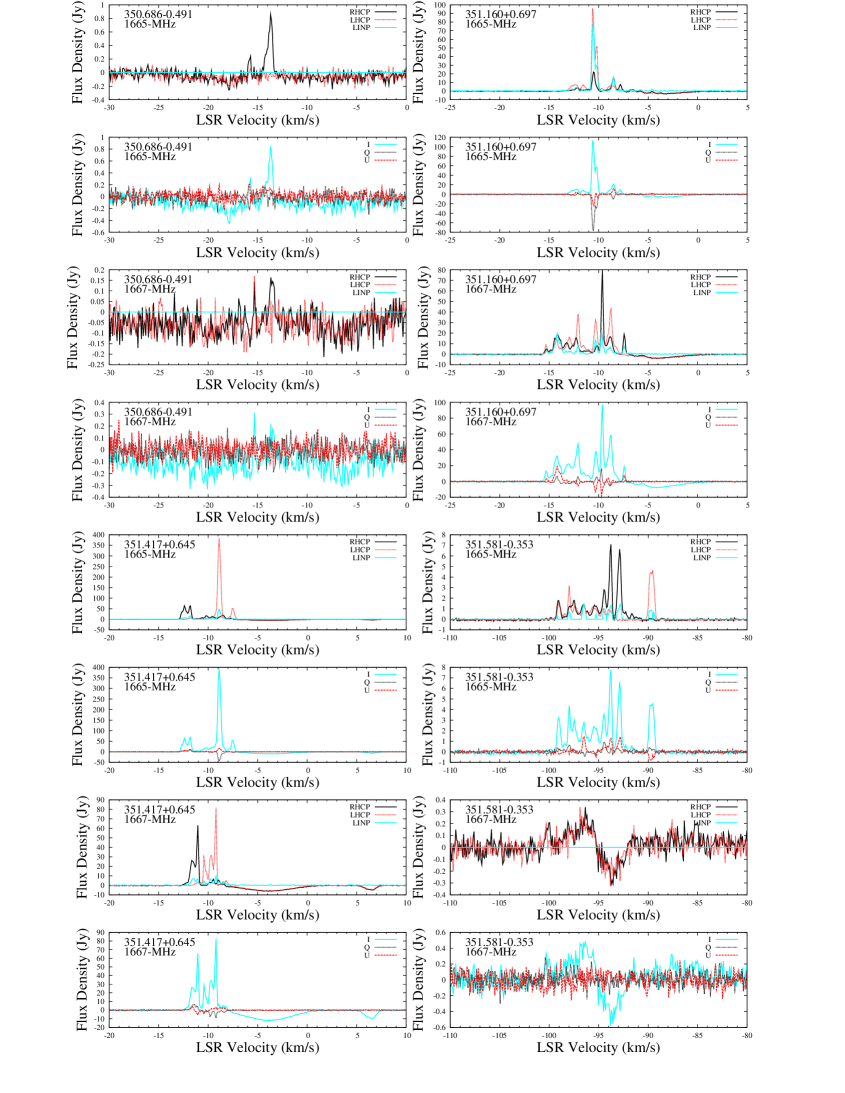
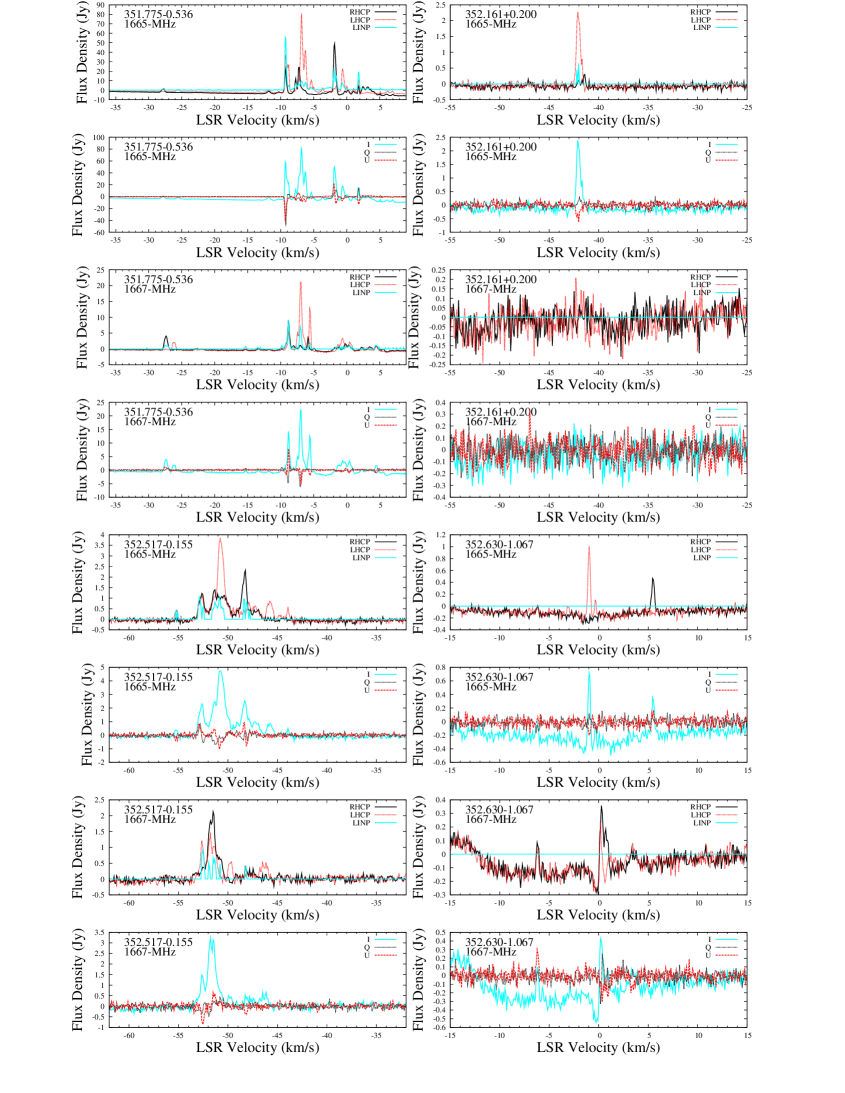
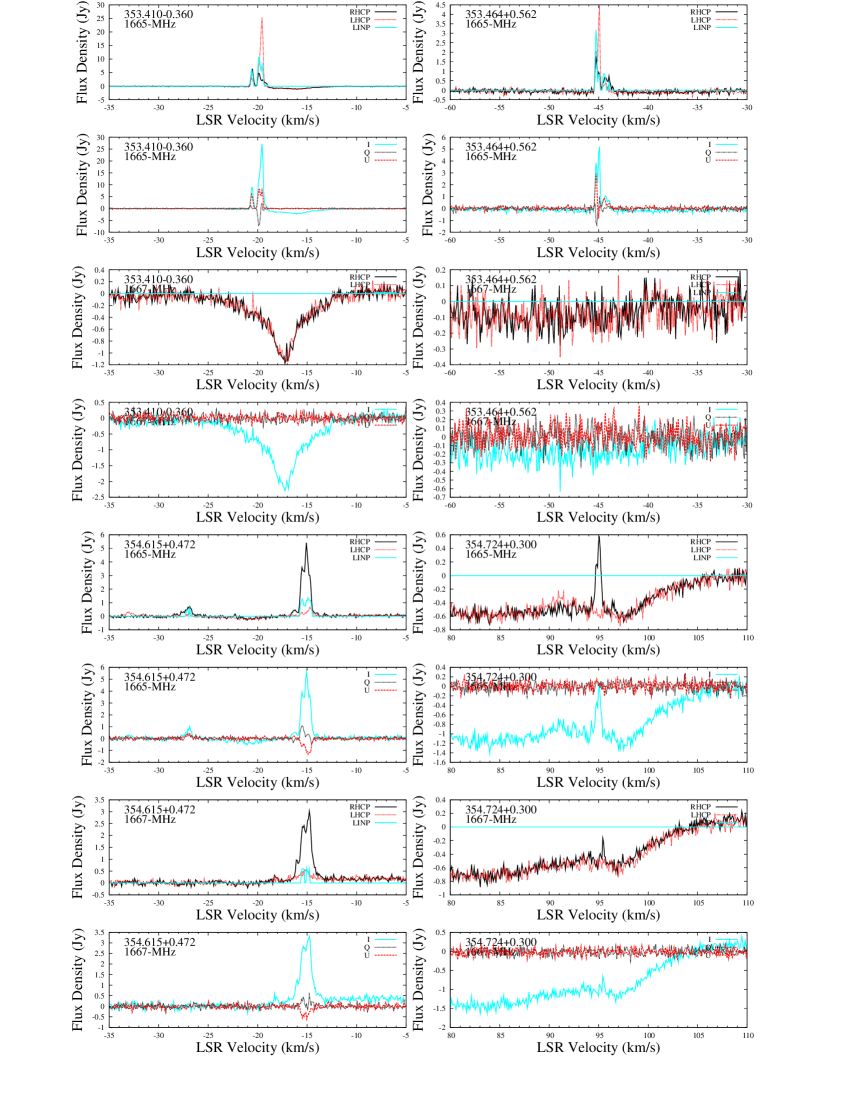
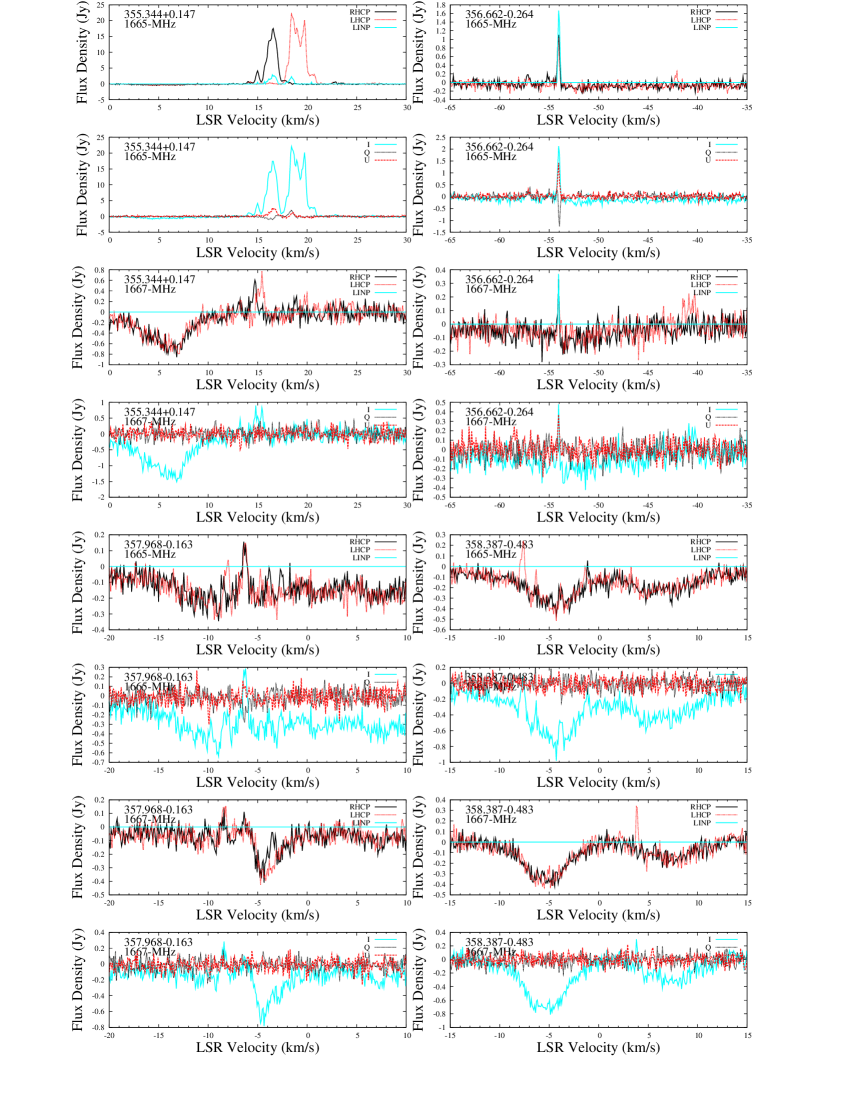
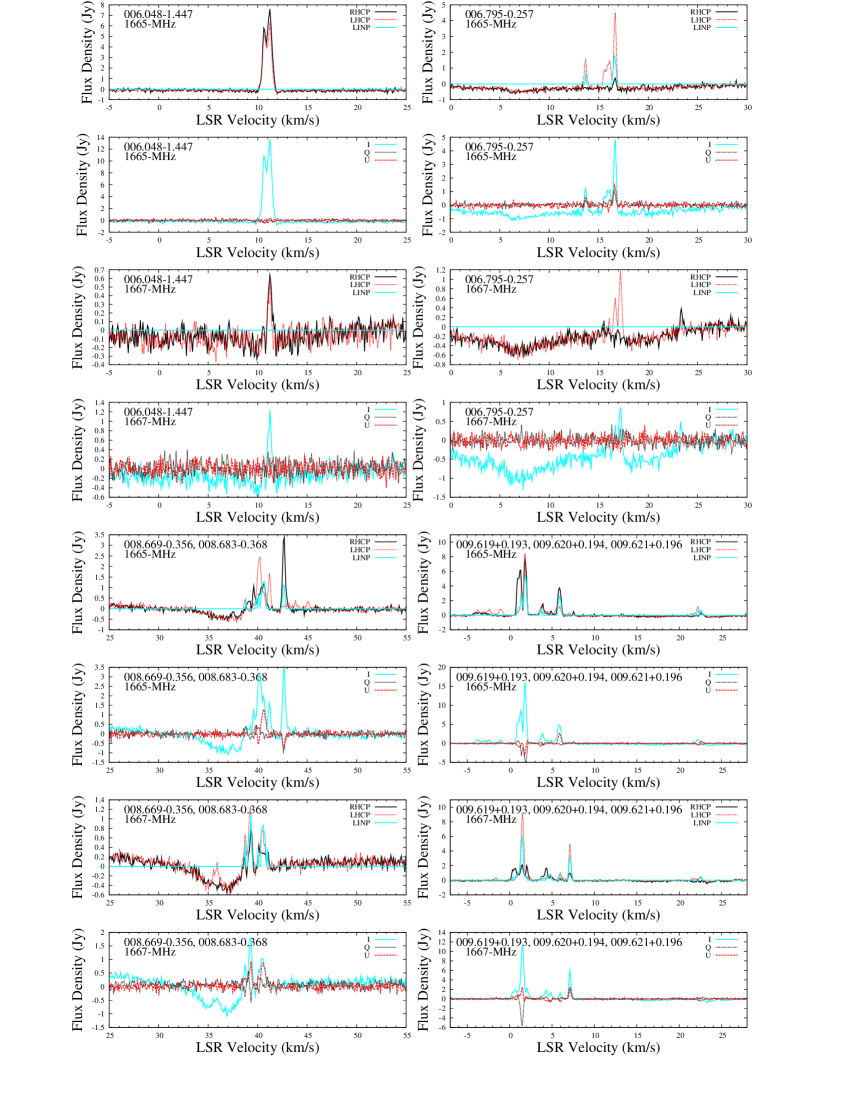
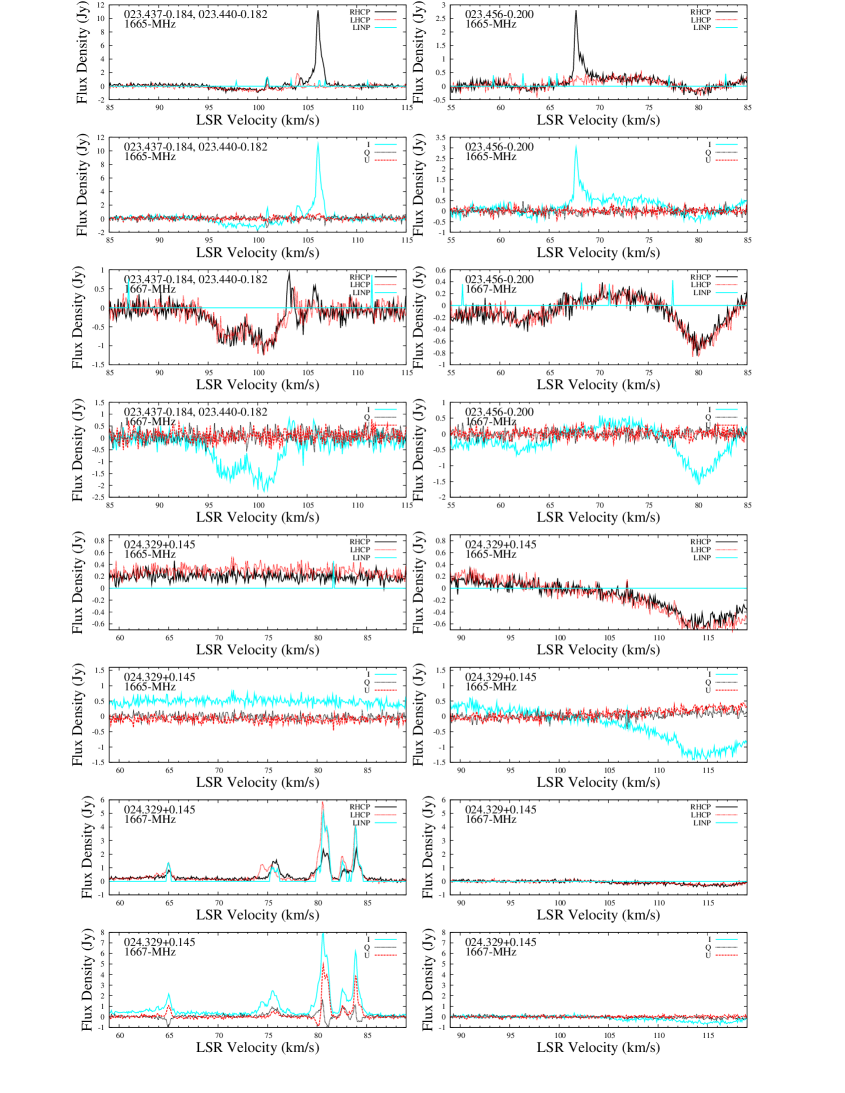
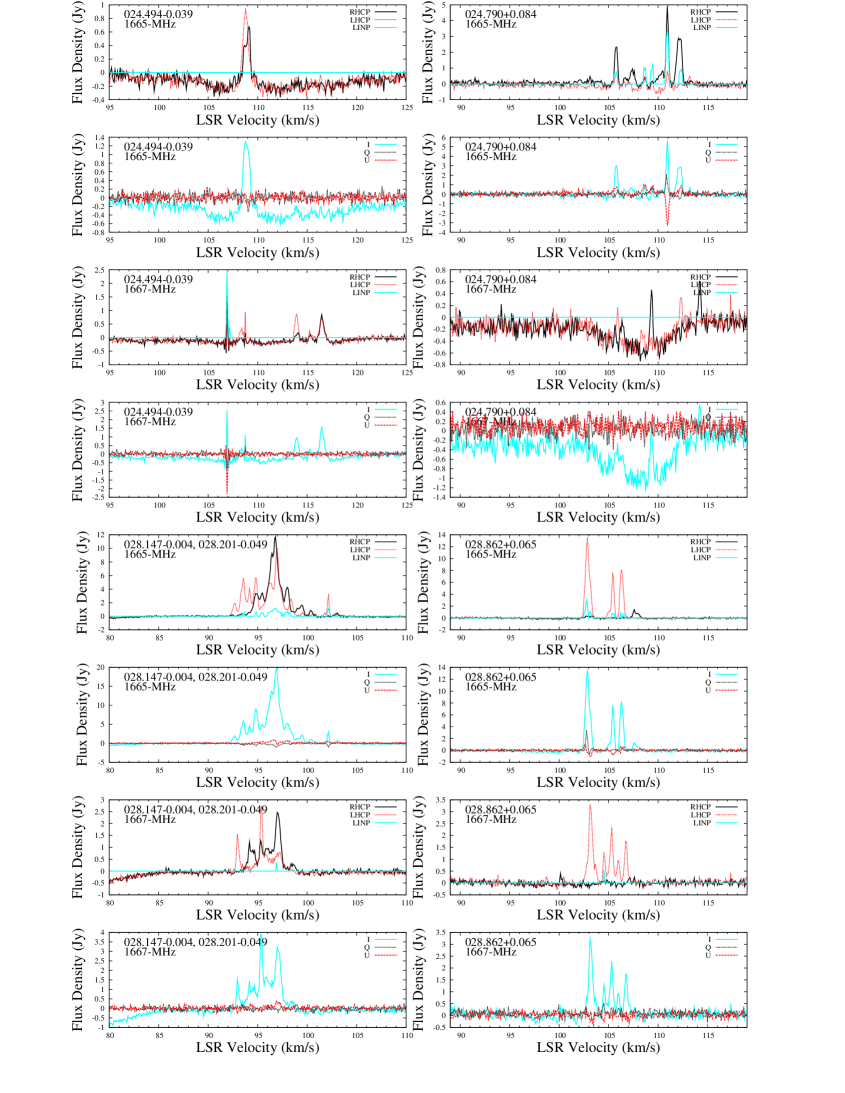
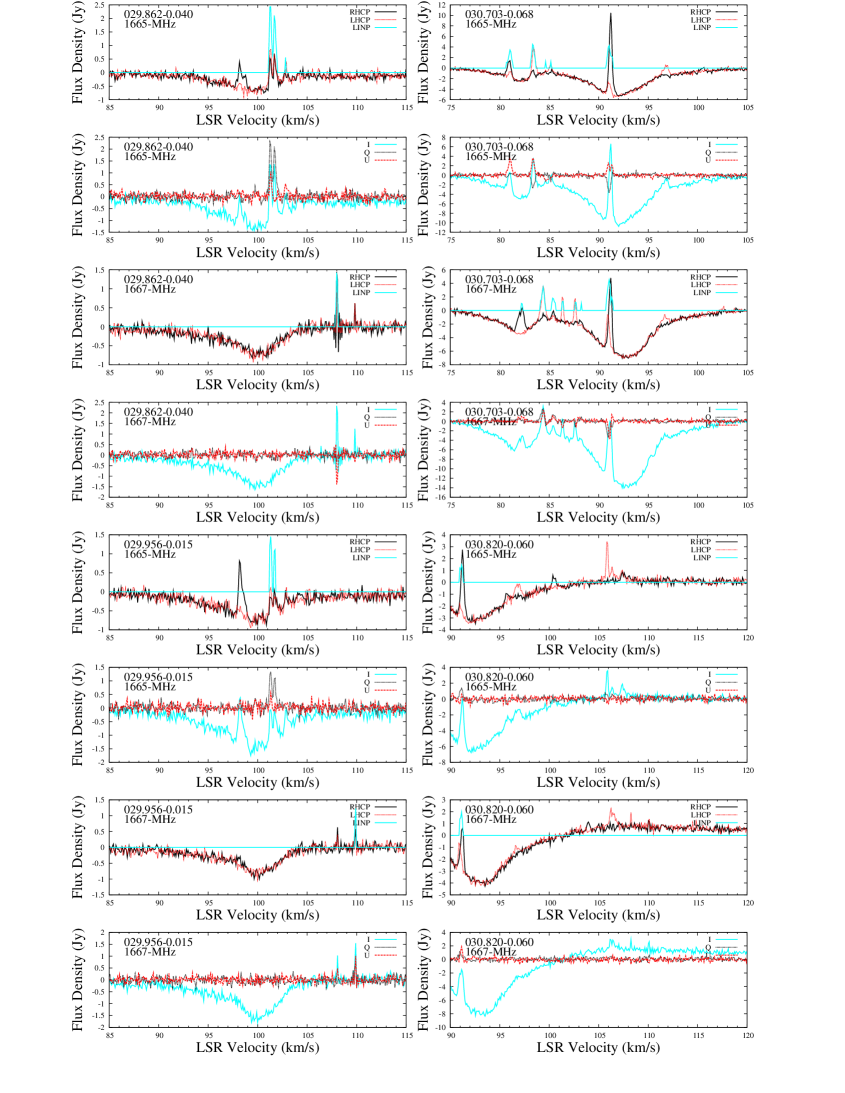
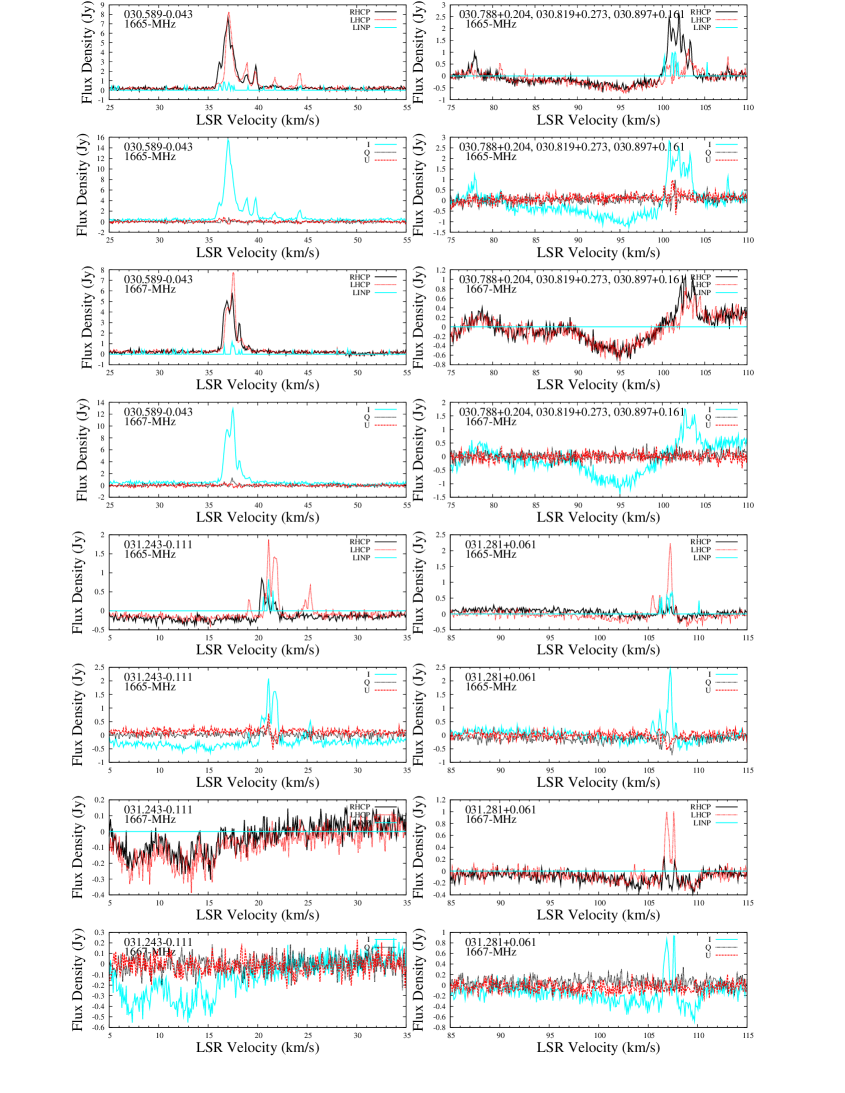
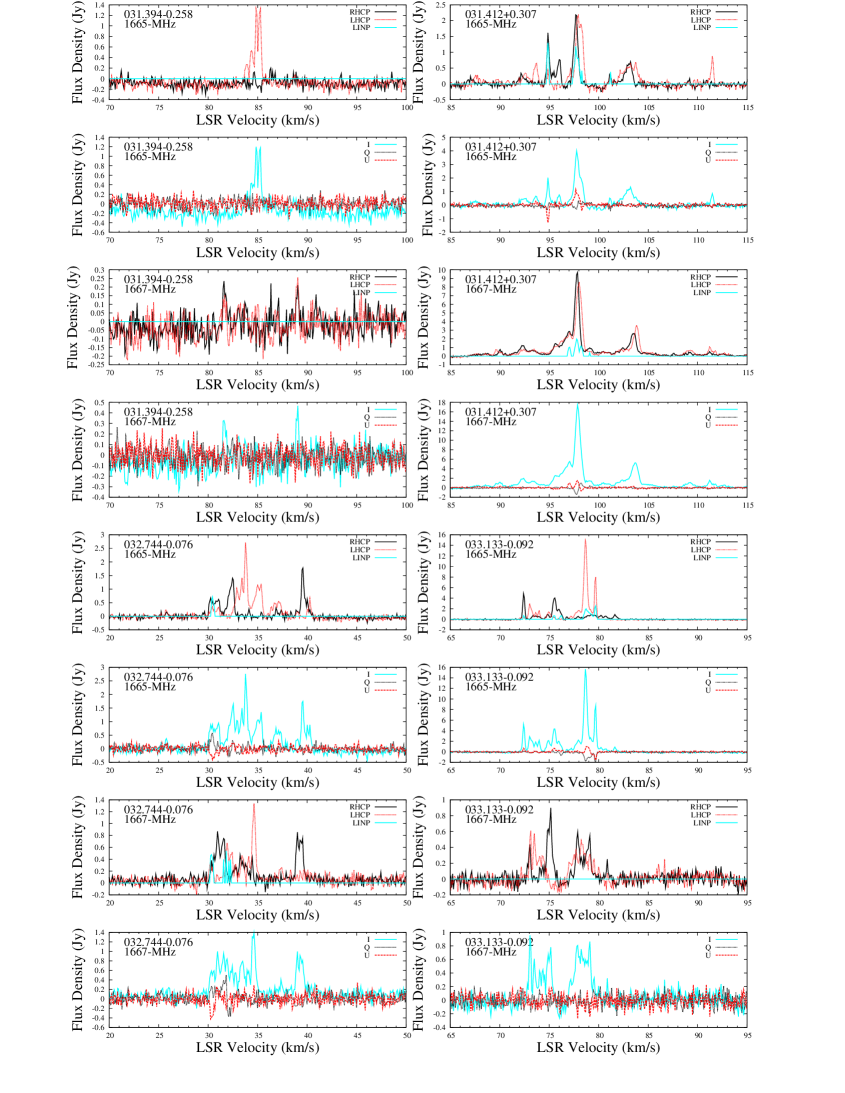
Source parameters and a summary of the new results are given in Table 1. Column 1 gives the Galactic coordinates, used also as a source name, and derived from the more precise equatorial coordinates given in columns 2 and 3. Column 4 gives a reference to a position measurement for the OH emission, with ‘text’ referring to text of Section 3.3, mostly related to previously unpublished measurements of 23 sources with the ATCA. The velocity range of emission is given in columns 5 and 6, and in a few cases is larger than seen on the displayed spectra since it encompasses features at outlying velocities that have been prominent in the past but have subsequently weakened. The values of peak intensity of emission, for epochs 2004 and 2005, at both 1665 and 1667 MHz, are given in columns 7-10, listing the highest peak seen in the circular polarization spectra; non-detections are given in the format for no features above 0.2 Jy, etc.; a dash indicates no measurement available. Boldface font identifies the epoch of the spectra selected for display in Fig. 1.
A concise indication of linear polarization detectability from the present spectra is given in column 11, with 5P and 7P (upper case P) indicating the presence of a feature with more than 50 per cent at 1665 and 1667 MHz respectively and 5p and 7p (lower case p) indicating our clear detection of linear polarization, but not above 50 per cent in any feature. References to past published polarization spectra with comparable sensitivity are given in column 12, but noting that VLA and Parkes spectra (references v and c) are limited to circular polarization.
Column 13 is an indication of the relative intensities of maser emission at the 6668-MHz transition of methanol and the stronger of the ground-state 1665 or 1667-MHz transition; this ratio, which we have evaluated from the highest peak spectral intensity from a methanol spectrum and the highest peak of OH emission (generally taken from the circularly polarized spectrum displayed here) is believed to be an indicator of the evolutionary stage of the high-mass star formation maser site (Caswell 1997, 1998) and is discussed further in Section 4.1.
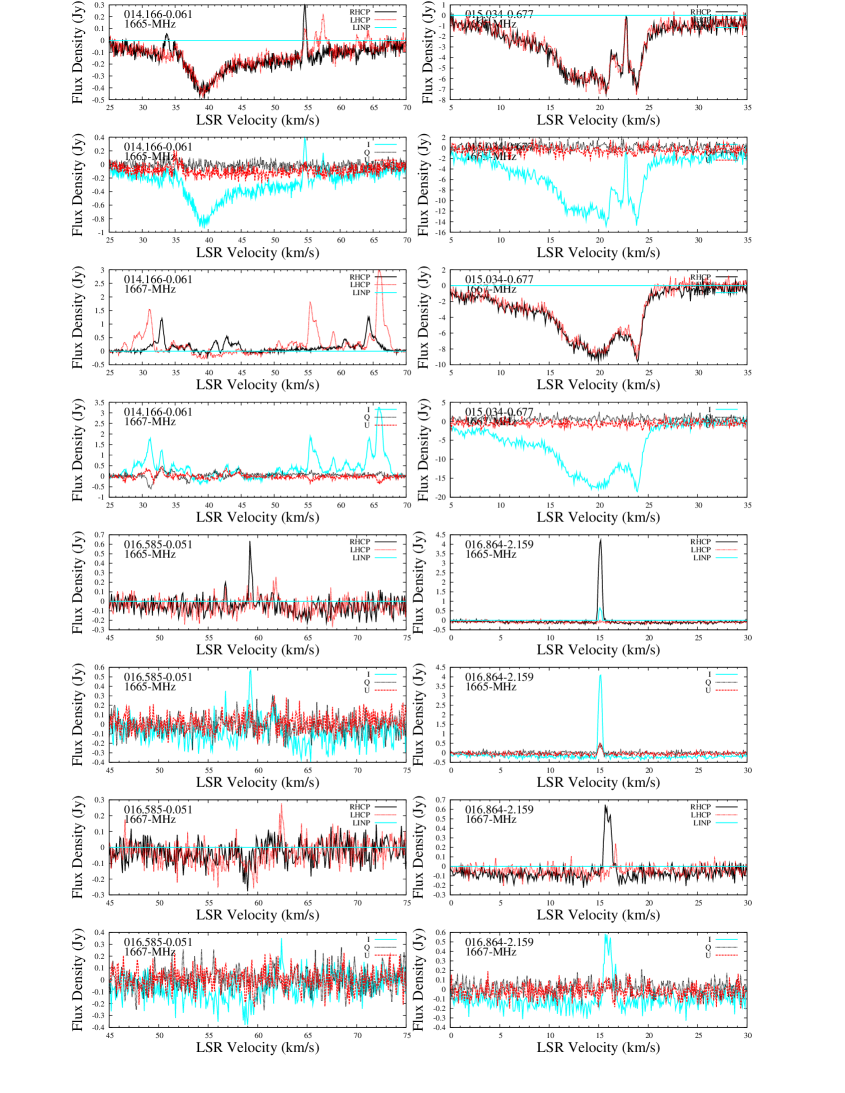
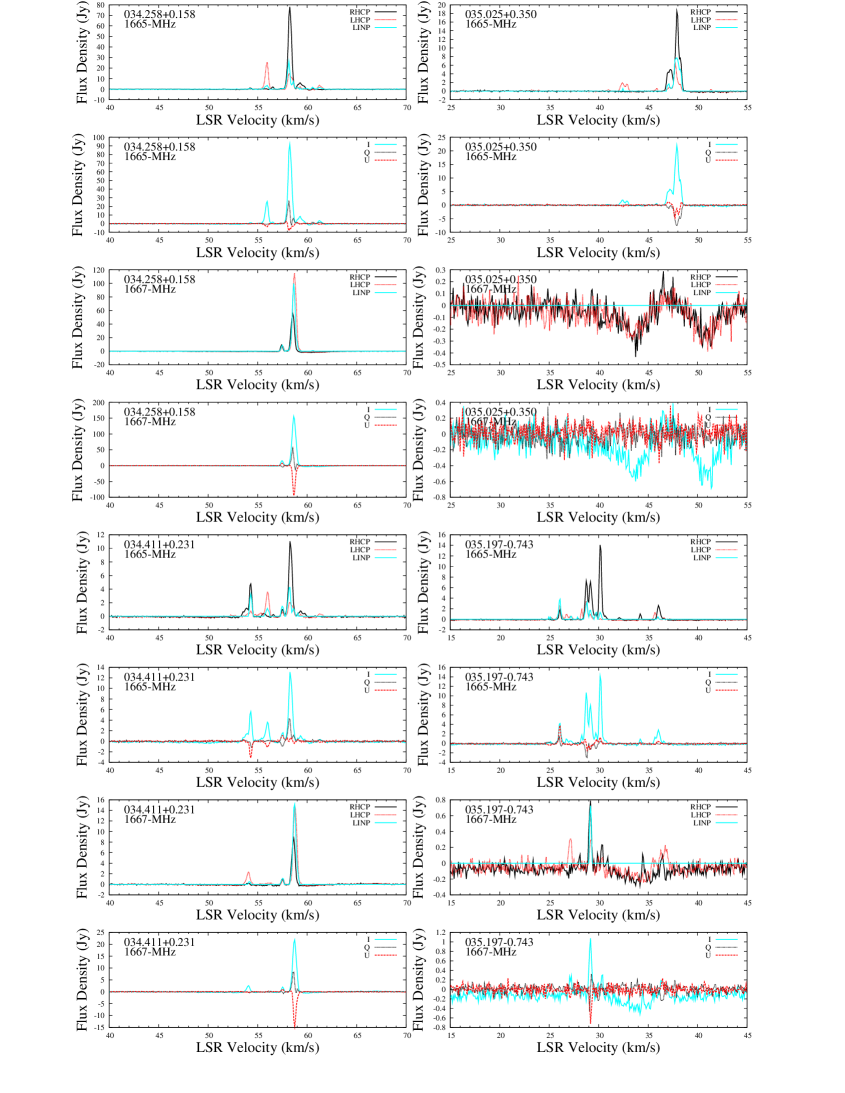
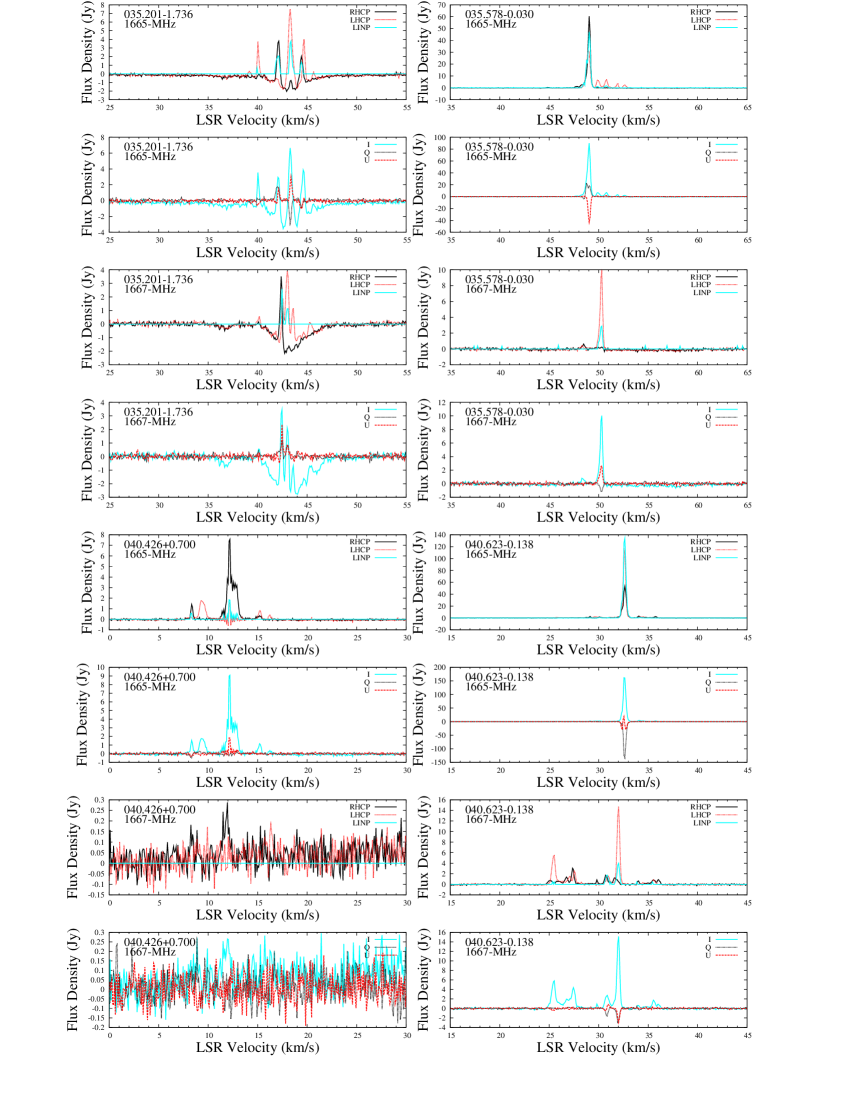
3.1 Spectra
Spectra of the 104 maser sites are presented in Figure 1, but only 92 plots were required since, in a few instances, a single plot is sufficient for several adjacent sites that are in closely spaced clusters.
For the majority (81) of the plots, a velocity range of 30 is sufficient to show all detected features, and display the fine detail present. Sources with very large velocity extents are displayed with larger ranges of up to 45 (e.g. 351.775–0.536 and 14.166–0.061). In two cases (5.885–0.392 and 24.329–0.039), a velocity range of at least 60 was required, and has been split between two adjacent spectra so as to allow recognition of fine detail over this large range.
Spectra have a channel separation of 0.488 kHz (equivalent to 0.088 ) and have not been smoothed, so the ‘resolution’, full-width to half-maximum (FWHM), is 1.21 times the channel separation. For comparison, we note that this is the same resolution used for the VLBA data of W3(OH) by Wright et al. (2004a,b), who were able to derive simultaneous spectra for all four ground-state transitions (in the four IFs available), but limited to a velocity coverage of 11 (i.e. 128 channels over 62.5 kHz for each transition). In VLBA measurements by Fish et al. (2005), a wider velocity range was chosen, but at the expense of lower spectral resolution.
For our data, and for a typical source observed with integration time of 10 min, the rms noise level on a spectrum at full spectral resolution is 0.05 Jy. Some targets have higher noise due to a high background sky noise, the most extreme example being 15.034–0.677. Other targets were observed with longer integration times, as long as 40 min for 14.166–0.061, and have accordingly lower noise levels. By chance, these two examples are close in Galactic longitude, and thus displayed side by side, so that the factor of 10 in noise level is very noticeable.
In some spectra, most notably 15.034–0.677, there are absorption features which have velocity ranges of at least a few and occasionally as much as 20 . Absorption features are spatially much broader (e.g. several arcmin) than the maser features (typically less than 0.01 arcsec) and thus, in single dish spectra, absorption features can be very prominent relative to the maser emission because they fill a much larger fraction of the beam. Since they represent real structure, we have not attempted to remove these broad features in our reduction procedure. Narrow spikes of radio frequency interference are evident on 1667-MHz spectra of 12.026–0.032, 24.494–0.039, 29.862–0.040, 29.956–0.015 and 30.820–0.060, as detailed in the notes for these sites.
3.2 Other OH data sets consulted for comparison
Earlier OH observations have been consulted for each source, and reveal that many sources merit individual discussion highlighting unusual properties. For compiling the resulting source notes, four datasets have been especially useful, all of them providing high spectral resolution and sensitivity comparable to ours. The measurements from the NRT (Szymczak & Gerard 2009) and from the VLBA (Fish et al. 2005) provide full Stokes polarization information, whereas the VLA (Argon et al. 2000) and earlier Parkes data (Caswell & Haynes 1983a,b) are limited to circular polarization. We now summarize some aspects of these earlier datasets that are especially relevant to the comparisons presented in the source notes.
3.2.1 NRT observations
Our convention for the calculation and scaling of I, Q, U and V is the same as for the NRT results (Szymczak & Gerard 2009); our display is also similar to their Fig. C1 but with a difference in the display of RHCP and LHCP, where our convention, I=R+L, contrasts with the NRT display which uses the less common convention, I=(R+L)/2, (with the consequence that individual RHCP or LHCP can be as much as twice as large as total intensity, I).
The NRT coverage does not include Galactic longitudes 350∘ to 360∘. Between 0∘ and 40.6∘, we have 50 targets in common, amongst which we note in the NRT data an interchange of R and L labels for 0.546–0.852 at 1665 MHz (but not 1667 MHz); and 24.51–0.05 for both 1665 and 1667 MHz. However, all values for V are plotted with correct sign (with the same convention as ours, V=R–L).
In Table B1, it appears that the listed polarization position angle for the strongly linearly polarized 1667-MHz feature of source 34.25+0.16 at velocity 58.62 should be –42.31∘ rather than +42.31∘, presumably a printing error since no other discrepancies were evident.
Source names and positions.
The NRT labelled source names are the approximate coordinates of the methanol targets, and thus sometimes significantly differ from ours, which used the best available OH maser positions. The equivalence of the NRT approximate position with the more precise position is usually obvious, but here we note a few instances where it may not otherwise be clear: 10.96+0.02 is 11.034+0.062; 12.21-0.09 is 12.209-0.102; 13.72-0.52 is 13.656-0.599; 19.49+0.14 is a blend of 19.486+0.151 (weak) and 19.474+0.169 (stronger but off centre); 22.34-0.16 - all features in the displayed spectrum are sidelobe responses to 22.45-0.17 (=22.435-0.169); 24.51-0.05 is 24.494-0.039; 31.27+0.06 is 31.281+0.061.
Blending of nearby sources.
Szymczak & Gerard (2009) remark on the blending of 0.658-0.043 with 0.666-0.034, 12.21-0.09 with 12.216-0.117 and 43.165+0.015 with 43.167+0.010. In our notes of section 3.3, we draw attention to blending of several other sites, and incomplete velocity coverage (e.g. 0.666-0.035). The site 9.622+0.195 includes blended features from 9.619+0.193 and 9.620+0.194, the latter with incomplete velocity coverage. For 29.86-0.05, features at velocity greater than +100 are from this site (more precisely 29.862-0.040) and emission at lower velocities arises from 29.956-0.015, offset about 6 arcmin, chiefly in declination; the spectrum of 30.82-0.05 (more precisely 30.820-0.060) shows a sidelobe response to 30.703-0.069 (offset by 7.2 arcmin).
3.2.2 VLBA comparisons
The 18 fields studied by Fish et al. (2005) provide observations of 9 discrete sites in our observing list. We note that their analysis, where some parameters are derived using fitting to individual spots, but others using peak channel brightnesses, can lead to some anomalies where there is a sweep of ppa across a feature; the linearly polarized fraction can then be underestimated, and thus expectations that the VLBA high spatial resolution will lead to higher percentages of linear polarization are not necessarily realised. The available total bandwidth was small and causes incomplete velocity coverage for several sources.
3.2.3 VLA comparisons
The VLA dataset of Argon et al. (2000) provides an excellent set of reference spectra with good spectral resolution, although limited to the two circular polarizations. They provide good comparisons with the present Parkes data at both 1665 and 1667 MHz for 23 sources, and for a further 18 sources at just 1665 MHz. While making the comparisons, we noted two small errors which it is convenient to list here and minimize confusion when consulting this widely-used database.
For 351.582-0.352, there appears to be an error of about 1 in the velocity labelling, both on the plot and in the listed features, e.g. the strongest feature listed at -93.86 is actually at -92.86 .
The source listed as 351.232+0.682 is spurious, and merely a sidelobe (about 2 per cent) of 351.161+0.697 (offset by several arcmin), clearly seen from their Fig. 34, which shows 1667-MHz spectra for each source (thus allowing a simple comparison), and from the identical velocities of listed features for each source in Tables 83 and 84.
3.2.4 Earlier Parkes data
Many of the subsequent comparisons regarding variability relate to earlier Parkes data, with spectra from 1980 onwards (Caswell & Haynes 1983a,b) displaying good sensitivity and spectral resolution in the two circular polarizations.
3.3 Source notes
The source notes that follow draw attention to unusual features such as exceptionally high linear polarization, large velocity widths, unusual ratio of 1665 to 1667 MHz intensity, comparison with earlier data, and variability. In the case of linear polarization, we make several comparisons with measurements from the VLBA, which cite polarized intensity and the polarization position angle (ppa) in the range 0∘ to +180∘, rather than values of Q and U. For a quick qualitative comparison with our displayed values of Q and U, it is useful to recall that the values of Q and U for unit linearly polarized signal as a function of ppa are: ppa 0∘ (Q=+1); 45∘ (U=+1); 90∘ (Q=-1); 135∘ (U=-1).
Information on methanol maser emission at each site was summarized in Table 1 by listing the relative peak maser intensities of methanol and ground-state main-line OH. The methanol values were taken from the Methanol Multibeam survey (Caswell et al. 2010b, Green et al. 2010), except for the 36 sites with Galactic longitude between 20 and 41∘ (a region where the MMB catalogue is in preliminary form and not yet published). For these, available methanol data from the literature and our unpublished data are summarized in the source notes, and values in Table 1 are based on these assessments. The comparison of methanol to OH intensity is now better than in the Caswell (1998) investigation owing to some improved positions of OH in the present paper, and many improved methanol positions from Caswell (2009) as well as from the Methanol Multibeam survey, allowing confirmation or rejection of some earlier apparent associations.
Source notes are omitted for sites which are adequately described by the parameters of Table 1 and the spectra, with no known strongly unusual properties.
350.011–1.342
Emission at 1665 and 1667 MHz shows negligible change between our observations of 2004 (shown here), our earlier unpublished Parkes observations of 1993, and those from the VLA, also taken in 1993 (Argon et al. 2000). However there are marked differences from the discovery observation in 1985 (Cohen Baart & Jonas 1988). Our spectra from 2005 remained similar to those of 2004, except for the 1665-MHz feature at –18.1 , for which RHCP flared from 2.5 Jy to 11 Jy, whereas LHCP and linearly polarized emission increased by less than a factor of 2. All other features remained the same to within 10 per cent. Our 2004 and 2005 observations are the first to record linearly polarized emission for this source, with a high linearly polarized fractional emission of 50 per cent in the 1665-MHz feature at –19.8 .
350.329+0.100
Weak features at 1665 and 1667 MHz are confined to the velocity range –67 to –63 , and high linear polarization at 1665 MHz is seen in the strongest feature, 0.3 Jy, at -63.5 . The spectra have been aligned with those of 350.113+0.095 which is offset slightly more than 10 arcmin and causes a prominent sidelobe response in the velocity range –77 to –67 .
351.160+0.697
A long history of this source shows that its many strong emission features at both 1665 and 1667 MHz from –16 to –3 are still prominent, and of similar strength. There is also deep absorption of the strong background emission. Linear polarization is present in several features, and notably very high in the three strongest 1665-MHz features, remaining similar in 2004 and 2005.
351.417+0.645
This strong OH maser is well-known, and often referred to by its associated strong compact H ii region NGC6334f, with OH spectra showing deep absorption of the intense background emission. Since 1980, the maser emission has shown variations exceeding a factor of two for many features, but remains strong at 1665 and 1667 MHz, with peaks exceeding 250 and 75 Jy respectively.
Linear polarization of several features is weak but persistent from 2004 to 2005.
Detailed maps with the Australian LBA (Long Baseline Array) have been made of the accompanying strong excited-state OH emission at 6035 and 6030 MHz, showing a wealth of Zeeman pairs and a well-characterized magnetic field (Caswell Kramer & Reynolds 2011a).
351.581–0.353
The multiple 1665-MHz features from 100 to 88 seen in 1980 persist, but with considerable variability. The 1667-MHz spectrum is dominated by absorption, with several very weak peaks of emission. High linear polarization is present at 1665 MHz in our 2005 spectrum (as displayed) at –96.5 . The two strongest maser features are at 1665-MHz RHCP, at velocities –93.8 and –92.8 , similar to our unpublished spectra of 1989; the feature at –92.8 was the strongest in the 1980/1981 published spectrum of Caswell & Haynes (1983).
We note that the spectrum and table of features for the 1993 VLA observation published by Argon et al. (2000) indicate similar peaks but at velocities of –94.81 and –93.86 . The overall similarity with our spectrum, but shifted by approximately 1 , suggests that the velocity scale of the VLA spectrum is incorrect.
351.775–0.536
This site is of special interest since the OH maser peak at some epochs has exceeded 1000 Jy, the largest known. Multiple features over the wide range -31 to +8 occur at both 1665 and 1667 MHz, and have remained prominent throughout the period 1980 to 2004. The strongest feature at most epochs has been LHCP at 1665 MHz near -2 , which in 1980 exceeded 1000 Jy, but is now only 10 Jy; its close neighbour, a RHCP feature at slightly more positive velocity, remains prominent but its peak has varied from 190 Jy in 2004 to 85 Jy in 2005 whereas historically it has commonly been near 200 Jy.
The large fractional linear polarization of 1667-MHz emission in our spectra from 2004 and 2005, at velocity -8.9 , with U positive and Q negative (average ppa approximately 67.5∘) is similar to that seen with the VLBA in 1996. The strongest 1667-MHz feature in our 2004 and 2005 spectra is at velocity -7 , primarily LHCP but with significant (but lower) linear polarization (Q and U negative with Q stronger and thus ppa approximately 110∘). The corresponding VLBA feature in 1996 was also chiefly LHCP polarized but with much lower linear polarization, most likely an indication of variability since there is no plausible reason why linear polarization in the higher spatial resolution data could be reduced instrumentally.
At 1665 MHz, the feature at -9.2 in our 2004 and 2005 data is stable with high linear polarization (U and Q both negative, and thus ppa approximately 115∘) and it has similar high linear polarization in the 1996 VLBA observations, with ppa 106∘. In contrast, emission near -2 which at most epochs has been the strongest feature, was relatively weak in 2004, and even weaker in 2005, and primarily RHCP; the VLBA 1996 data showed strong LHCP emission, 433 Jy (at -1.98 ), weaker RHCP emission 131 Jy (at -1.87 ) and significant linear polarization of 147 Jy (at -1.92 ), clearly a complex feature with significant blending, and at least some parts variable.
The velocity range of this source is very wide, much wider than the range covered by VLBA observations. Outside of the VLBA range, a likely Zeeman pair near velocity -27 , well-isolated from all other features, was first noted at both 1665 and 1667 MHz in the 1980 data of Caswell & Haynes (1983); it persisted in the 1991 VLA observation (Argon et al 2000) and remains prominent in our present 2004 and 2005 spectra. The most extreme velocity feature recorded was at 1665 MHz, 1993 July 21 (unpublished Parkes data), at -35.8 .
352.630-1.067
Features are present at both 1665 and 1667 MHz but strong variations have occurred since the ATCA measurements of 1996. The Q and U spectra show that pronounced linear polarization is present in the weak 1667-MHz features.
353.410-0.360
Currently similar at 1665 MHz to 1980 observations but the main feature is three times stronger; these first full polarization measurements show that significant linear polarization is present. The 1667-MHz spectrum is dominated by deep absorption, with a single weak feature of emission (LHCP) at both epochs 2004 and 2005.
A complementary high resolution study of excited state OH maser emission at 6035 and 6030 MHz has been made with the Australian LBA (Caswell Kramer & Reynolds 2011a), showing many Zeeman pairs, all implying the same direction of the magnetic field.
353.464+0.562
1665-MHz emission remained closely similar between 2004 and 2005, but several times stronger than in 1989. The dominant feature is LHCP, and an almost equally strong adjacent feature has high linear polarization, with persistent ppa at our two epochs. There has been no confident detection at 1667 MHz.
354.615+0.472
Emission is present over a wide velocity range spanning -34 to -14 , but dominated by a RHCP triple-peaked feature near -15.5 at both 1665 and 1667 MHz. Significant linear polarization in several features is seen in these first full polarization observations.
354.724+0.300
Prominent absorption is present at both transitions, but maser emission is clearly recognised from its circular polarization; strongest 1665-MHz emission, wholly RHCP, is accompanied at similar velocity by weaker emission at 1667 MHz, also wholly RHCP. Weaker features at 1665 MHz are offset to more negative velocity, and wholly LHCP.
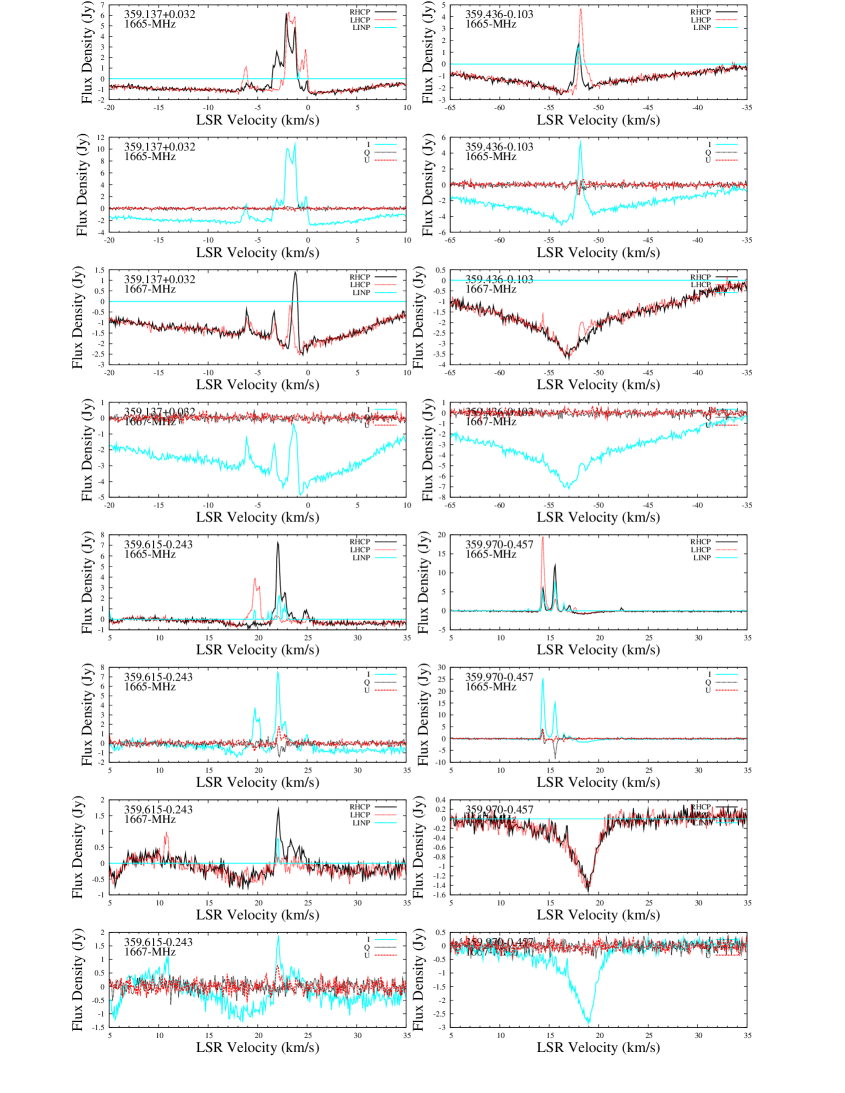
355.344+0.147
Prominent emission at 1665 MHz shows a clear Zeeman pattern of multiple features in a field of -4.3 mG, which has not changed since 1980 (Caswell & Haynes 1983a; Caswell & Vaile 1995). Weak features at the 1667-MHz transition, seen for the first time in the present sensitive observations, show a similar Zeeman pattern. Weak linear polarization at 1665 MHz is seen in some features.
356.662-0.264
Earlier spectra from 1980 and 1989 showed a 1665-MHz feature (LHCP) and a slightly weaker 1667-MHz feature at slightly more negative velocity (-54 ), but RHCP. The current spectrum shows both emission features weaker, but 1665-MHz emission is now highly linearly polarized with no significant circular polarization, and the 1667-MHz feature, while showing net RHCP, is also chiefly linearly polarized. The sensitivity of the current spectrum allows weaker features to be seen extending over a wide velocity range.
357.968-0.163
Weak emission features with some circular polarization are clearly present at both 1665 and 1667 MHz, but somewhat confused by the broad absorption feature.
358.387-0.483
Positions for two 1665-MHz features detected with the ATCA were listed by Caswell (1998), showing a separation of 4 arcsec but believed to be a single large site; we cite it here as a single source at the mean position, . Both of the earlier measured features prove to be LHCP; a weaker feature near -4 shows no net polarization and the emission near velocity -1.2 is suggestive of a RHCP and LHCP close pair. A weak 1667-MHz feature is now seen, near velocity +4 , of low intensity, and wholly LHCP.
359.970-0.457
Emission features between 14 and 18 at 1665 MHz, seen in 1980, persist, with a new RHC polarized feature extending the velocity range to +22.5 , on the high velocity side of a deep absorption trough. The long-established 1665-MHz features at 14.2 and 15.6 remain predominantly LHCP and RHCP, respectively, but in these first full polarization measurements, linear polarization is also seen, notably 50 per cent in the latter.
Increased sensitivity allows us now to see weak 1667-MHz emission in the main velocity range, and also near 23 in 2004, with peak of 0.7 Jy and 40 per cent linearly polarized.
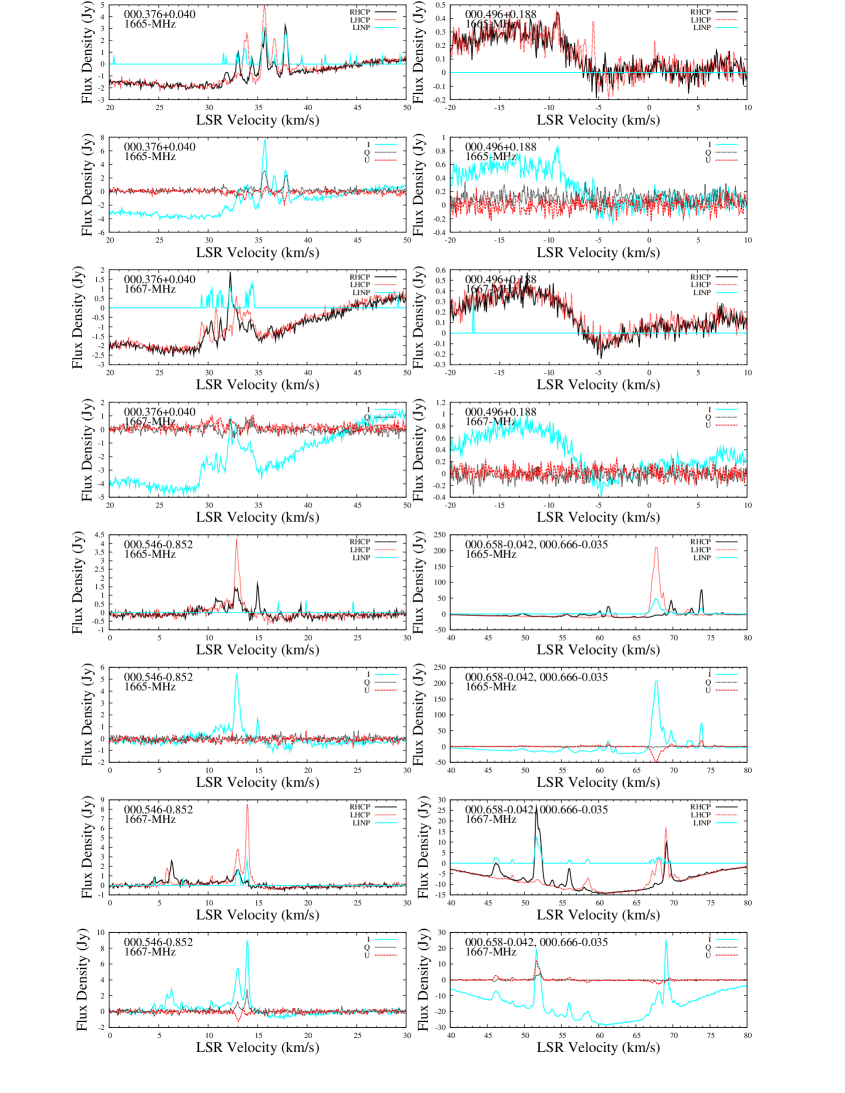
0.376+0.040
An increase in the source intensity, and higher instrumental sensitivity, now reveal multiple features at both 1665 and 1667 MHz over the velocity range 28.5 to 40 , all lying within a deep absorption trough. There were no apparent changes between 2004 and 2005, and the 2003 epoch measurements with the NRT confirm the significant linear polarization.
0.658-0.042, 0.666-0.035 and nearby locations
Our 12-armin beam combines the emission from the cluster of sites in the Sgr B2 region. Multiple strong features are present over the wide velocity range 45 to 77 , at both 1665 and 1667 MHz. There is prominent wide absorption of the strong background continuum emission.
The higher spatial resolution of VLA measurements (Argon et al. 2000), although limited to circular polarization, clearly demonstrate that our spectra are dominated by 0.658-0.042 in the velocity range 66 to 77 , and by 0.666-0.035 in the range 45.5 to 64 . Weaker sites, 0.678-0.027, only at 1665 MHz and with peak of 6 Jy near 70 , and 0.672-0.031, with peaks of only 4 and 2.5 Jy at 1665 and 1667 MHz, in the velocity range 45.5 to 56 , contribute only weakly to the overall emission of the two dominant sites.
The 1667-MHz feature of 0.666-0.034 at 52 shows the most significant linear polarization, of 20 per cent in a predominantly RHCP feature; it lies outside the velocity range covered by the NRT (the only other high sensitivity linear polarization measurements towards the source).
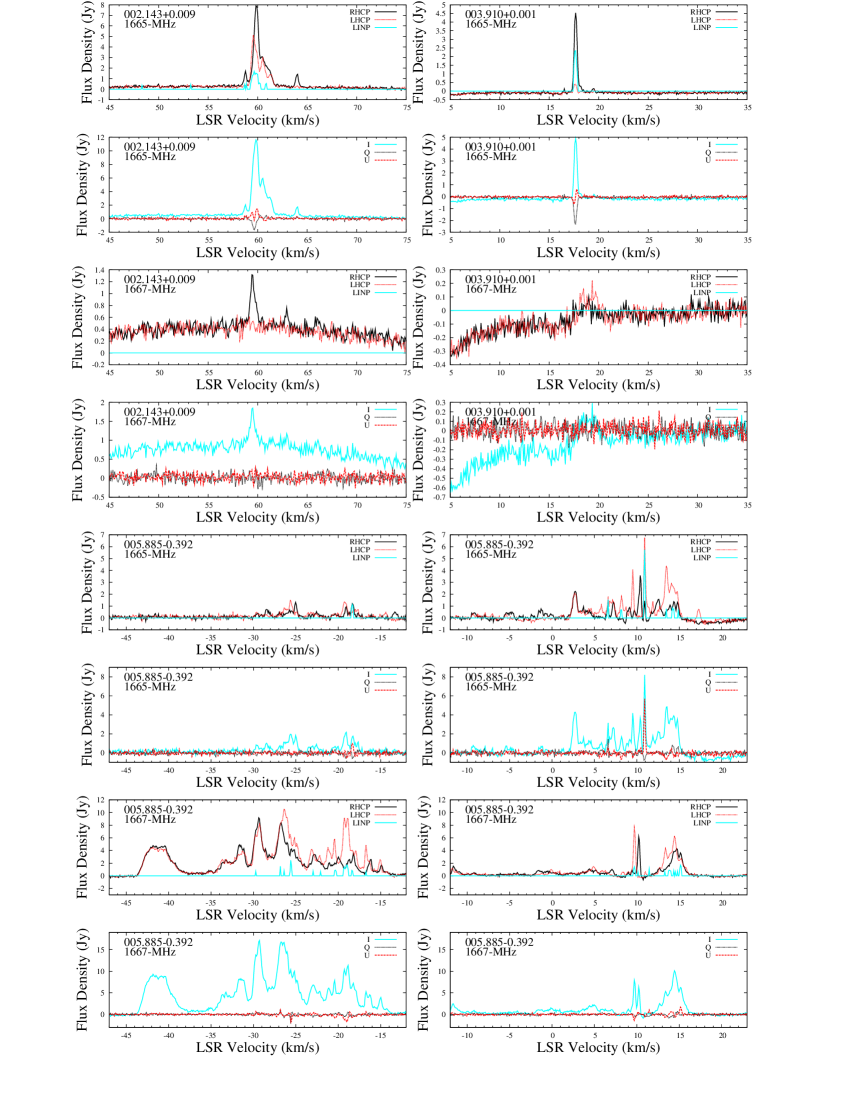
5.885-0.392
The remarkably wide velocity range of emission seen at 1665 and 1667 MHz has been known for many years, but only limited portions have been studied in depth, and the full wealth of detail remains to be interpreted.
We show the spectrum from 2005, noting that the spectrum from 2004 is similar. The observations are the first with full polarization coverage of the whole velocity range, and the display is spread over two adjacent panels to capture this wide range with adequate detail; it emphasises that the 1665 and 1667-MHz emission is comparably strong at positive velocities, whereas at negative velocities, 1667-MHz emission is even stronger, and 1665-MHz emssion is markedly weaker. Prominent linearly polarized emission is present at 1665 MHz, with an especially strong feature at +10.9 , a feature also displaying strong LHCP; for this feature, a comparison with VLBA measurements taken in 2001 (Fish et al. 2005) is in good agreement with our results. We also find significant polarization evident in features at -18.2 and -19.2 , velocities not covered by the VLBA, nor by any previous linear polarization measurements. 1667-MHz emission shows only weak linear polarization at both high and low velocities.
We note that an astrometric parallax distance (with uncertainty 7 per cent, based on water masers at this site) has recently been reported (Motogi et al. 2011a), yielding 1.28 kpc, much smaller than previous estimates between 1.8 and 3.8 kpc. This resolves a previous puzzle whereby the angular extent of the maser spot distribution and associated continuum H ii emission is large and the corresponding overestimated linear extent was improbably large; the linear extent is now estimated to be 45 mpc, no longer an extreme value, and comparable to several other similar objects (Caswell et al. 2010a).
6.795-0.257
Predominantly LHCP emission features are present, stronger at 1665-MHz and weaker at 1667-MHz; some linear polarization is present at 1665 MHz.
8.669-0.356 and 8.683-0.368
Significant changes have occurred over the past 20 years. ATCA data of 1995 suggest that the first source is weaker and accounts merely for some 1665-MHz emission features near 40 and at lower velocity. The strong narrow RHCP 1665-MHz feature at 42.8 , and perhaps all of the emission at 1667 MHz, most likely arises only from the the second source (offset by 1 arcmin). Linear polarization exceeding 50 percent is present at 1667 MHz.
At 8.669-0.356, Forster & Caswell (2000) show compact H ii emission and there is no clearly associated mid-IR source in GLIMPSE (Gallaway et al 2013) so we interpret the site as evolved, with methanol maser emission in decline. In contrast, 8.683-0.368 has no compact continuum, but has a mid-IR point source counterpart, indicative of a younger object with higher methanol to OH ratio, and no obvious radio H ii region. A detailed interpretation based on thermal lines of other molecular species is in agreement with this (Ren et al. 2012).
9.619+0.193, 9.620+0.194 and 9.621+0.196
The three distinct sources, spread over 15 arcsec, have 1665-MHz emission peaks near velocities 5.5, 22.5 and 1.4 respectively, according to ATCA measurements of 1996 (Caswell 1998). Emission from the first site is probably confined to this single 1665-MHz feature (now seen to be chiefly RHCP at 6 ).
Some features in our spectra may be confused, with emission contributed from more than one site. However, the second source, 9.620+0.194, has a wide velocity range, accounting not only for all 1665 and 1667-MHz emission near +22 , but also for 1665 and 1667-MHz emission near 4 , and for 1667-MHz emission near 7 . The emission near +20 is not within the velocity range of published data from either the NRT, VLA or VLBA. At 9.620+0.194, there is no detectable methanol maser nor any ucH ii region.
The third site, 9.621+0.196, accounts not only for emission at 1.4 (probably extending to 2 ), but for all features at negative velocity; it coincides with the most intense known maser on the 6668-MHz methanol transition, peaking, like the OH, at velocity 1.4 .
Strong linear polarization is evident, especially at 1667 MHz, where it exceeds 50 percent, confirming VLBA and NRT measurements.
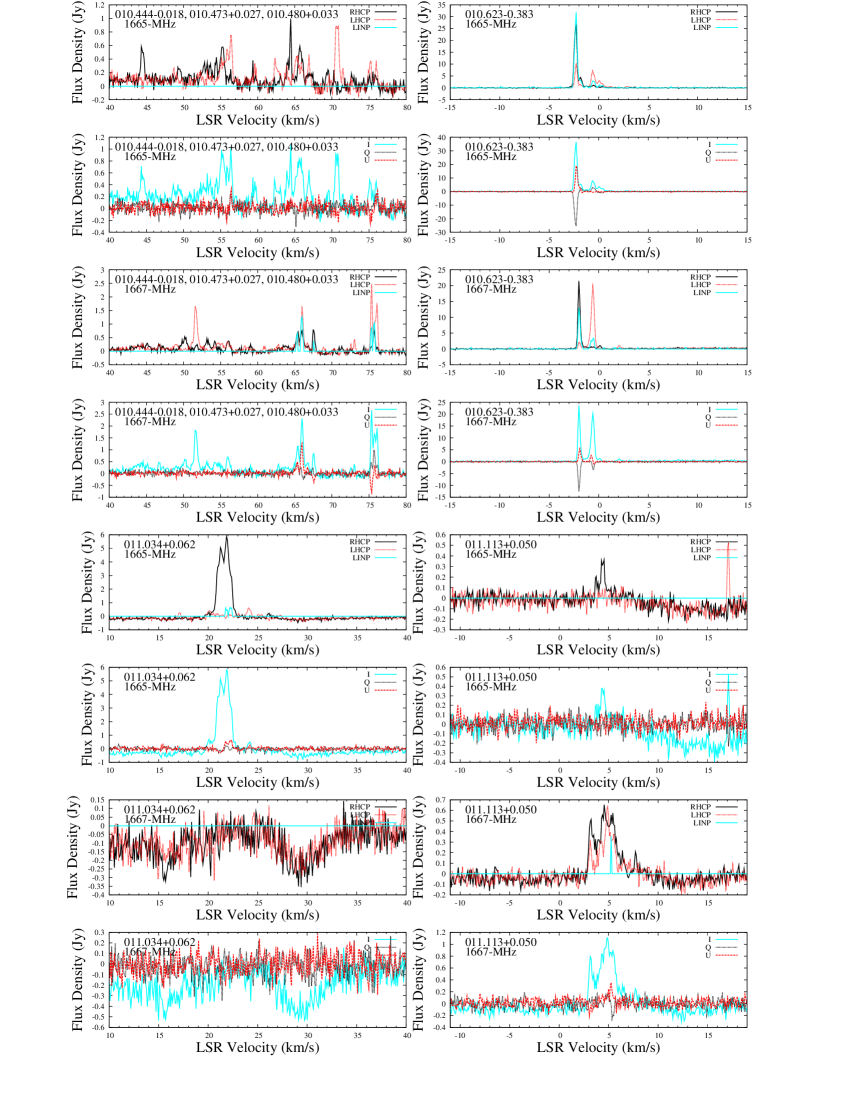
10.444-0.018, 10.473+0.027 and 10.480+0.033
There are no previous detailed OH spectra published for these three sites. The sites are spread over 3 arcmin and show 1665-MHz emission peaks at velocities 75.5, 51.5 and 66 respectively, according to ATCA measurements of 1996 (Caswell 1998). Emission from the first site is 6 times stronger at 1667 than at 1665 MHz, and is confined to a narrow velocity range from 74 to 77 . The third site, 10.480+0.033, is detected only at 1665 MHz, confined to a narrow single feature. Emission from the second site is stronger at 1667 than at 1665 MHz, and extends over the range 50 to 68 , at least.
With regard to the present observations, the 1667-MHz spectrum is thus wholly accounted for. However, it is not clear where 1665-MHz features at velocities 70.5 (LHCP) and 44.5 (RHCP) arise from, although the second site (with a known wider velocity range) seems most likely, and the site then has one of the largest velocity spans of our sample.
The first site shows strong linear polarization at both 1665 and 1667 MHz. At the second site, features of 1667-MHz emission near 65 show 50 per cent linear polarization, in contrast to the feature at 51.8 which is wholly LHCP with no detectable linear polarization.
10.623-0.383
Strong emission, at both 1665 and 1667 MHz, has remained very stable since 1982. The prominent linear and circular polarization at both transitions in 2004 and 2005 shows excellent agreement with the NRT and VLBA measurements taken in 2003 and 2001 respectively.
11.034+0.062
Emission is limited to 1665 MHz: a broad RHCP feature which has changed only slightly since 1982, a weak LHCP feature at 24 , and even weaker features near 26 (RHCP) and 27 (LHCP). An apparent weak (0.4-Jy) LHCP feature at velocity 17.1 is not at this position, but arises from a previously unreported source 11.113+0.050, offset 5 arcmin (see next note).
11.113+0.050
This source was first noted in Parkes observations in 2004 while targeting 11.034+0.062. From subsequent ATCA observations (2005 May), a position measurement of the strongest emission, at 1667 MHz, at 5 , yielded 11.113+0.050 ( with rms errors of 8” (=0.6s) and 4.2”), offset 5 arcmin from 11.034+0.062; thus each site lies near the half-power point of the Parkes beam when targeting the other. There is no reported methanol maser at this site (Green et al. 2010)
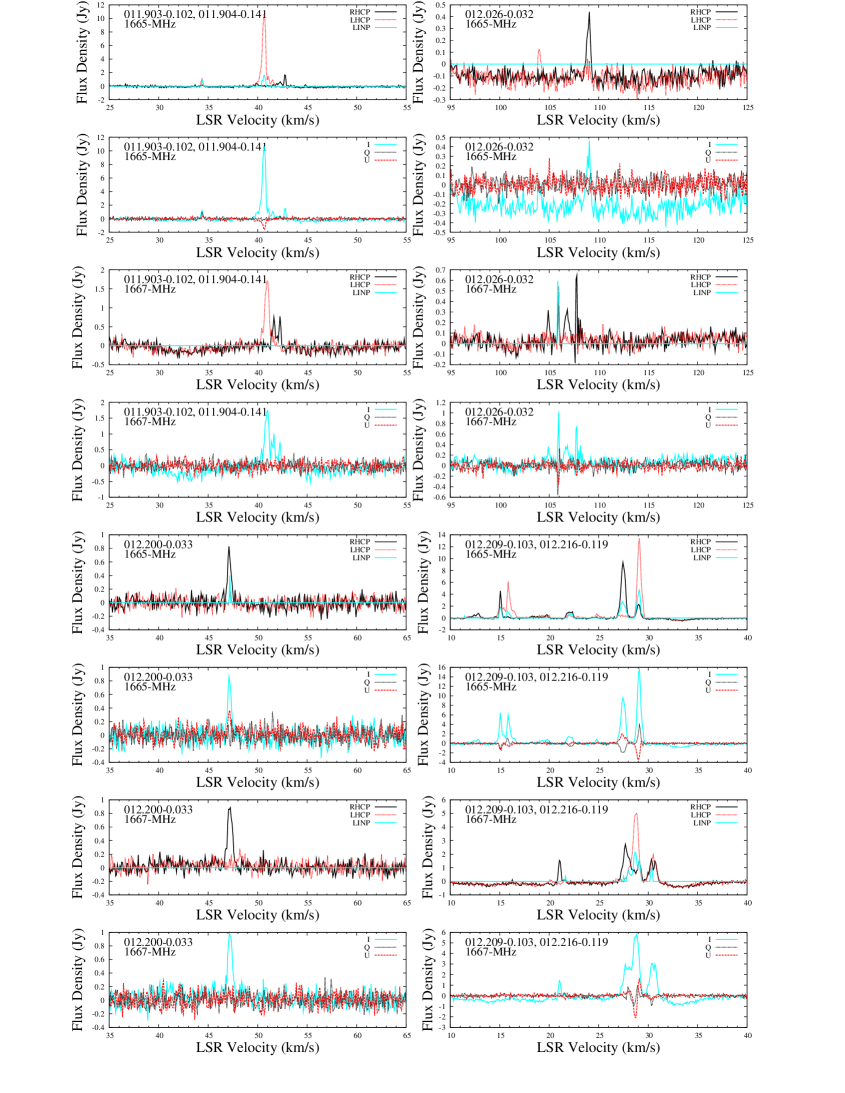
11.904-0.141 and 11.903-0.102
11.904-0.141 is a well-known source with emission in the range 39.5 to 45 . Our 2005 spectrum shows it to be similar, though stronger, than seen in 1982.
The second source is a weak solitary 1665-MHz feature at 34.3 . We discovered it on our 2004 and 2005 spectra and noticed its absence from the NRT spectrum of 11.900.16 (Szymczak & Gerard 2009) despite the NRT observation epoch (2005 August) lying between our measurements. We suggest that the absence of emission from the Nancay spectrum is not due to variability, but because it arises from a different site, offset in RA from the centre of the narrow Nancay beam. A likely location is the methanol maser site 11.903-0.102 (Green et al. 2010) with methanol emission in the range 32 to 36.7 , at an offset in RA from the Nancay target by about 3 arcmin. Any Nancay response to OH at this location would thus be reduced in amplitude by 90 per cent, whereas the expected reduction for the Parkes, larger, 12 arcmin, beam, at an offset from the pointing target of 2 arcmin, is less than 10 per cent. We therefore list 11.903-0.102 as an additional OH maser site, citing the precise methanol maser position, pending precise measurement of the OH position.
12.026-0.032
This source had a peak of 4 Jy in 1982 (Caswell & Haynes 1983b) but, because of variability, no precise position measurement was possible until our present measurements with the ATCA (OH rms position uncertainty 0.4 arcsec) confirming its coincidence with a methanol maser. It remains weak, but clearly detectable at both 1665 and 1667 MHz. Note that two narrow spikes of interference are evident on the 1667-MHz spectrum at velocities 105.9 and 107.9 .
12.200-0.033
This is a weak new source at 1665 and 1667 MHz discovered while targeting 12.216-0.119 (about 6 arcmin away, but at quite different velocity) and with ATCA rms position uncertainty 0.4 arcsec. A methanol maser coincides (Caswell 2009; Green et al. 2010).
12.209-0.102 and 12.216-0.119
The two sources are shown in a single spectrum since they are spatially close, but are clearly distinct in velocity, with only slight overlap. Their spatial separation is 70 arcsec and 6.5 arcsec in RA and declination respectively, as found from our ATCA measurements (including new ones) and those of Argon et al. (2000). NRT spectra 2003 and 2005 are similar to our 2004 and 2005 spectra, and corroborate the linear polarization detection.
The Parkes spectrum 12.22-0.12 (Caswell & Haynes 1983b) is a 1982 epoch measurement of both sites and shows the absence of the currently dominant features of 12.209-0.103 near 15 and 16 . The Argon et al. (2000) spectrum taken 1993 does not cover these velocities. The principal features of 12.216-0.119 have persisted from 1982 to 2005, with intensity variations typically less than a factor of 2.
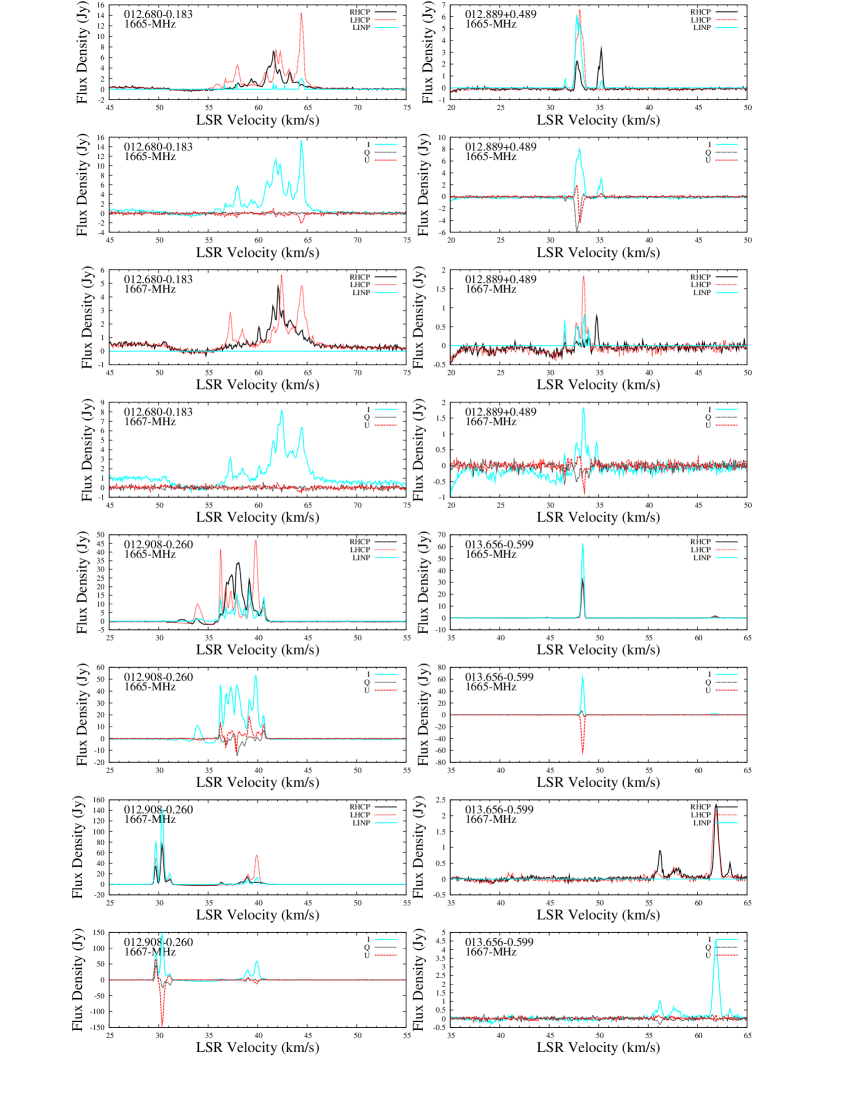
12.889+0.489
A detailed discussion of this source is given by Green et al. (2012a) where flux density variations measured with the ATCA in 2010 and 2011 were shown to match the 29.5-day periodicity of the associated methanol maser. We note that the high linear polarization seen in many features of our Parkes spectra closely match those measured more than 5 years later with the ATCA.
12.908-0.260
Despite great variability since 1982, at each subsequent observing epoch, there have always been very strong features at both 1665 and 1667 MHz, within the velocity range 28 to 42 .
In the velocity range of strongest persistent emission, 35 to 41 , where methanol maser emission is also strong indicative of this being the systemic velocity, there is widespread but modest linear polarization, corroborating the NRT results.
Of greater interest is the remarkable flaring 1667-MHz emission, velocity +29 to +32 , and thus blue-shifted relative to systemic. The strongest emission, seen in 2005 (displayed spectrum), was an order of magnitude weaker in 2004 (6 Jy RHCP, 6 Jy LHCP), but 100 per cent linearly polarized at both epochs. The flaring emission was present in the NRT spectrum of 2003 June, and highly polarized, but less than 1 Jy total intensity at that epoch.
13.656-0.599
The present position, in Table 1, is a new ATCA measurement (rms uncertainty 0.4 arcsec), following from the discovery report by MacLeod et al. (1998).
Our 2004 and 2005 observations provide the first good OH main line spectra from Parkes. Features between 55 and 63.5 , at both 1665 and 1667 MHz, with peaks of up to several Jy remain similar to the spectrum by MacLeod et al taken before 1998. The total range, best seen at 1667 MHz, extends from 40.5 to 63.5 , and is closely centred on the methanol maser emission from the site, near 50 , and likely to be a good approximation to the systemic velocity.
Remarkably, 1665-MHz emission near velocity +48.5 which peaked pre-1998 at about 1 Jy in each circular polarization (MacLeod et al. 1998) now has a peak of approximately 30 Jy in each circular polarization (no significant net circular polarization) and is nearly 100 percent linearly polarized. NRT measurements (2005oct) confirm the linear polarization, but the intensity was underestimated since it was not observed at the best position.
Elsewhere, at velocities further from the centre, both 1665 and 1667-MHz features, in both 2004 and 2005, show only circular polarization, systematically with RHCP components at slightly higher velocity than nearby LHCP components, and thus (interpreted as Zeeman pairs) indicative of the same magnetic field direction.
14.166-0.061
A longer than usual integration time of 40 min was used for our 2004 observations of this weak maser so as to achieve a very low noise level; it was not observed in 2005. The only previous detailed spectrum was from a 1982 Parkes observation (Caswell & Haynes 1983b), when it had flared since an earlier 1975 measurement. Variability continued, with non-detection by Forster & Caswell (1989) and eventual detection with the ATCA in 2005, when a precise position was obtained (rms position uncertainty 0.4 arcsec), as given in Table 1. 1667-MHz emission is stronger than 1665-MHz by an order of magnitude, and the velocity range, from 26.5 to 68 , is one of the largest known. It has no 1612-MHz OH counterpart (Sevenster et al. 2001) and is thus unlikely to be an AGB star. It does have a water maser counterpart (Forster & Caswell 1989), but has no detected methanol counterpart (Caswell et al 1995). The absence of methanol and the wide velocity range suggests it is approaching the end of its maser emitting phase.
15.034-0.677
As remarked in Section 3.1, the sky background temperature in this direction is the highest for any source in our list, and causes high rms noise on the spectra, despite a 20 min integration. Current spectra (2004 displayed, and 2005) show stable spectra with no net circular or linear polarization. The relatively smooth absorption spectra seen at 1667 MHz have been stable over all high spectral resolution measurements since first recorded in 1976 (Haynes, Caswell & Goss 1976), and are assumed as a baseline to derive the peak intensity of 1665-MHz emission given in Table 1. 1665-MHz spectra are barely distinguishable from those in 1989 (unpublished Parkes data), but significant changes have occurred since 1976 when the feature at 21.5 was stronger and showed net RHCP, and was used for the VLA position measurement by Forster & Caswell (1989).
16.864-2.159
The position given in Table 1 is from new ATCA observations, with rms uncertainty 0.4 arcsec. The strong solitary 1665-MHz feature is primarily RHCP, but with 10 per cent linear polarization; its intensity has doubled since 1993. 1667-MHz emission is also present, again mainly RHCP, but a weak LHCP feature in the displayed 2004 spectra was confirmed in the 2005 spectra. Weak 1665-MHz LHCP emission (0.2 Jy) seen in 1989 and 1993 (unpublished Parkes spectra) is currently below our detection limit.
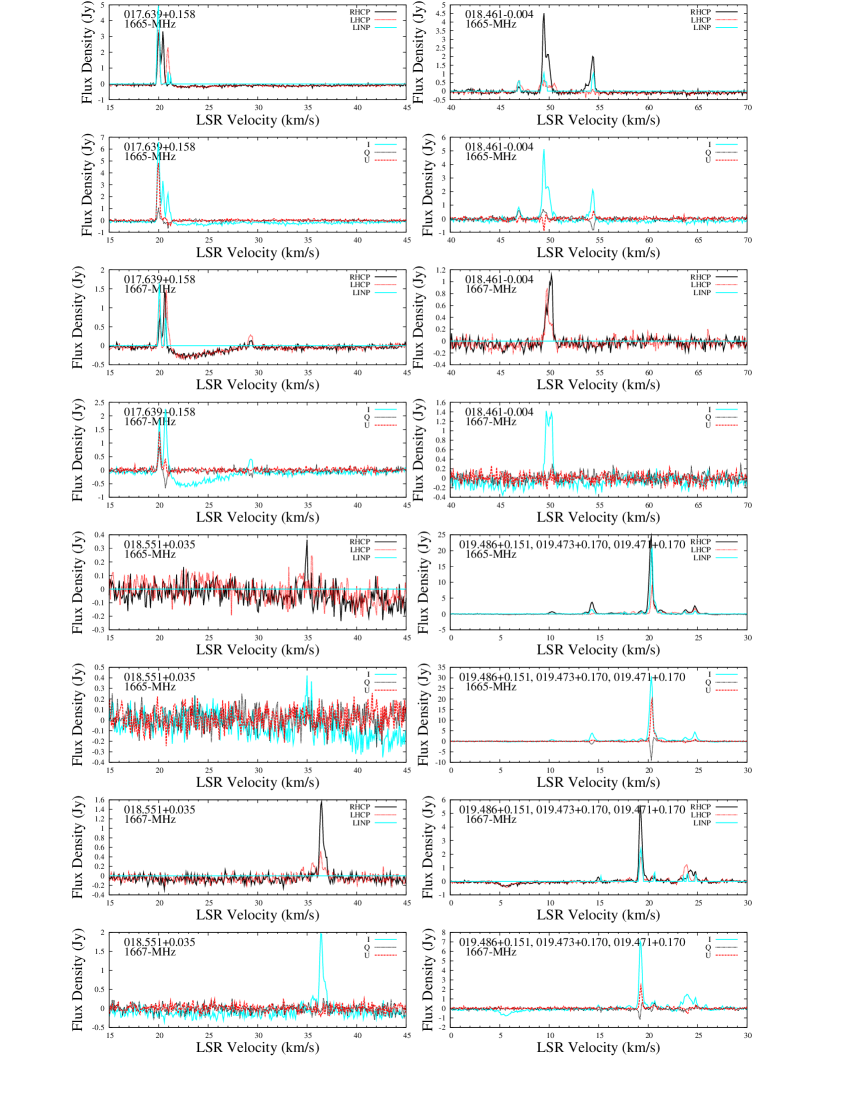
17.639+0.158
1665-MHz emission remains similar to 1993, except there is now no emission between 40 and 42 . 1667-MHz emission matches 1665-MHz in main features, and weak new emission near 29.2 in 2005 was undetectable in 2004, less than half the 2005 value. Both 1665 and 1667-MHz emission displays strong linear polarization of the 20 feature, and a Zeeman pair of circularly polarized features implying a magnetic field of -1 mG at velocity 20.7 . Nearby 1720-MHz emission is discussed in detail by Caswell (2004a) revealing dominant 1720-MHz emission at velocity 28 (extending with weaker emission to 35 ), offset by 4 arcsec from the position of 1665-MHz emission (Argon et al. 2000); there is also weak 1720-MHz emission corresponding to a Zeeman pair near 20.5 , magnetic field -2 mG, that agrees better in position with the 1665-MHz position. 1667-MHz absorption of -0.3 Jy at 22.5 matches 1720-MHz at the same velocity, with similar depth.
18.461-0.004
The position in Table 1 is a new ATCA measurement with rms uncertainty 0.4 arcsec. The full velocity range is 42 to 55 at 1665 MHz, with linear polarization of up to 30 per cent in some features, as also seen from NRT observations. There is weaker accompanying 1667-MHz emission. Emission remains generally similar to 1982. Note that a 1612-MHz single feature is present at this position, with velocity 49.9 (Sevenster et al. 2001).
18.551+0.035
This is a new source offset by 6 arcmin from the previous source 18.461-0.004, with ATCA position measured from the same dataset. A feature of 1.6 Jy at 1667 MHz is accompanied by weaker 1665-MHz emission at velocity 36.5 .
19.486+0.151, 19.473+0.170 and 19.471+0.170
Our new measurements reveal that OH maser emission in this direction is distributed over an 80 arcsec extent, and arises from three distinct OH sites that coincide respectively with the more precisely positioned methanol maser sites 19.486+0.151, 19.472+0.170n and 19.472+0.170 (Green et al. 2010); slight discrepancies in the Galactic source names are caused by larger uncertainties in the OH positions, which were measured by the ATCA in a short baseline hybrid configuration,
The current overall spectrum is generally comparable to that in 1982, with major 1665 and 1667-MHz features still recognisable; however, the 1665-MHz feature at velocity 20.2 flared from 3 Jy to 17 Jy in 1990 and as high as 24 Jy in 2004 (displayed) followed by a slight decrease in 2005. The total velocity range is now seen to be 10 to 26 .
In detail, we find that 19.486+0.151 accounts only for weak 1665 and 1667-MHz features between 23 and 25 , but is also the site of 6030 and 6035-MHz excited-state OH emission (Caswell 2003) and 6668-MHz methanol emission. The position in Table 1 is from ATCA measurements of 1665 and 1667-MHz features, with rms uncertainties of 3 arcsec (0.2 s) and 2 arcsec.
The strongest emission, the 1665-MHz flare of 24 Jy at 20.2 and 1667-MHz 7 Jy at 19.1 , together with emission adjacent in velocity, arises from , with rms uncertainty 2.2 arcsec (0.15 s), 1.4 arcsec, a site with approximate Galactic coordinates 19.474+0.169, and probably coinciding with the more precisely determined position of methanol maser 19.472+0.170n (Green et al. 2010). Taking all position information into account, we adopt the preferred name of 19.473+0.170.
The third source, with 1665-MHz emission of 2 Jy at 14.2 , is at with rms errors 4.3 arcsec (0.29 s), 2.6 arcsec, and corresponding to 19.471+0.170, matching methanol maser 19.472+0.170 (Green et al. 2010). The weak 1665-MHz feature of 0.3 Jy at 10.1 is also most likely at this position, although not yet well determined.
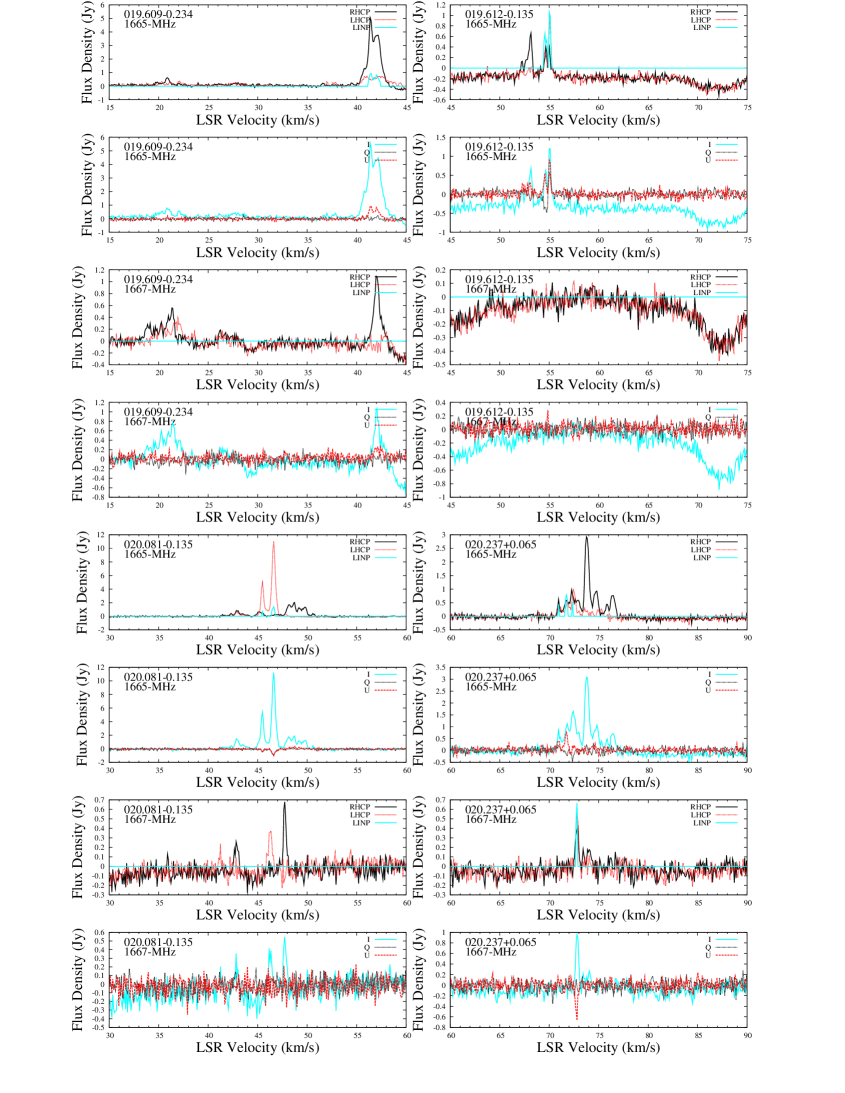
19.609-0.234
The major 1665-MHz feature of 4 Jy at 41 is unchanged since 1982. Our present increased sensitivity shows that it is accompanied by weaker 1667-MHz emission, and at both transitions is predominantly RHCP, and extends to 18 .
There is associated methanol emission with mid-velocity 39 which, regarded as the systemic velocity for this site, implies that the OH emission near 19 is a highly blue-shifted outflow.
19.612-0.135
19.612-0.135 is a pair of 1665-MHz features at 53 and 55 , with no evident 1667-MHz emission. It is now slightly weaker than in 1982 or 1989. The prominent double-peaked feature near +55 has strong linear polarization that has been stable over the 2004, 2005 period (including NRT observations 2005).
Although the methanol maser 19.612-0.134 is nearby (Green et al. 2010), its precise position suggests a separation of more than 5 arcsec from the precise OH position measured by Forster & Caswell (1989), and hence interpreted here as indicating a likely non-detection of methanol at the OH site.
20.081-0.135
Remarkably, the current spectrum is almost indistinguishable from 1982 and 1993 for all 1665-MHz features in the range 42 to 51 , and shows high levels of circular polarization. Current sensitivity reveals accompanying 1667-MHz emission. Coincident with the OH is a methanol maser (Walsh et al. 1998).
20.237+0.065
There is clear evidence of long term variability, with the 1665-MHz main peak 3 times weaker in 1982 or 1989 than values at epochs 2004, 2005 and 2003 (NRT). Circular polarization dominates, but several features show linear polarization, mostly weak, but exceeding 50 per cent for one 1667-MHz feature, with corroboration 2004, 2005 (displayed) and 2003 (NRT).
The ATCA OH position (cited in Table 1) was first reported by Caswell (2003) and, coincident, is a methanol maser (Caswell 2009), the stronger of a close pair.
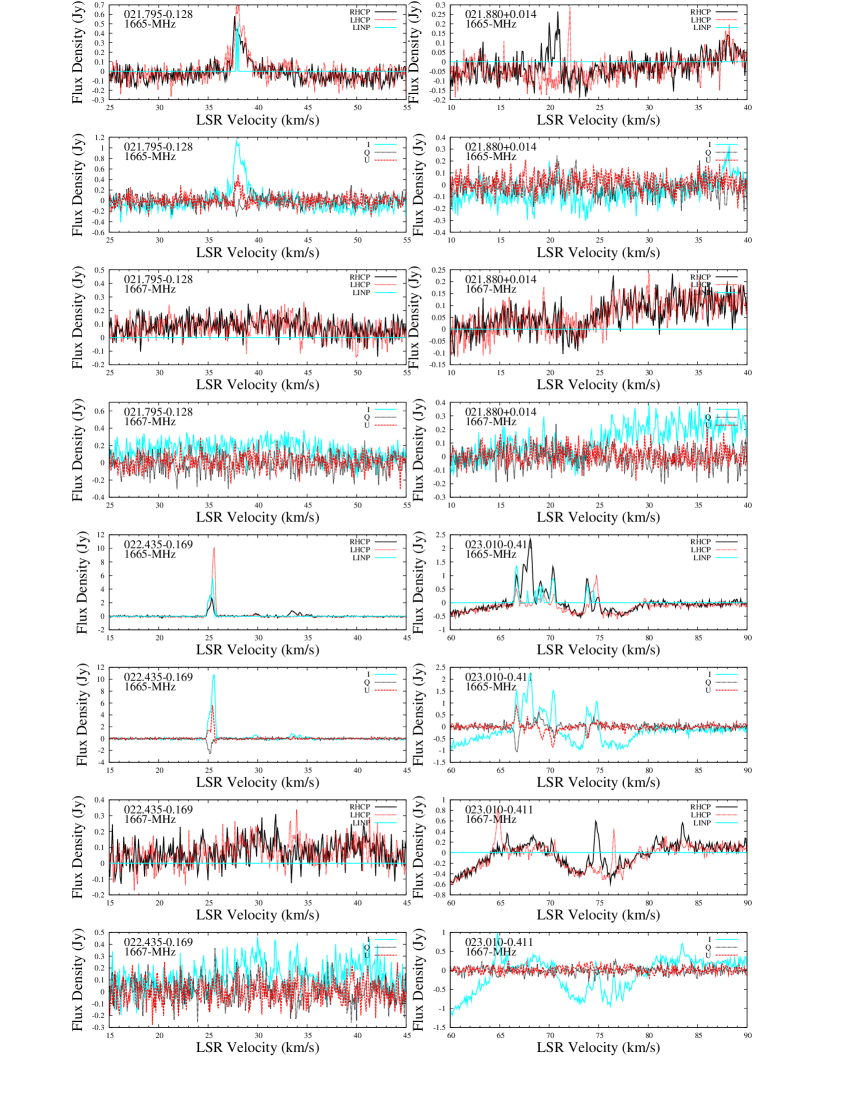
21.795-0.128
This source was newly discovered in 2004 during observations of the following source (21.880+0.014), offset 9.8 arcmin. The position cited in Table 1 from ATCA observations has rms uncertainties of 11 and 6 arcsec in RA and Declination. There is no known methanol maser at the site. Interestingly, Sevenster et al. (2001) report a 1612-MHz OH single feature maser, 21.797-0.127, at velocity 40.9 , peak flux density 5.9 Jy; its position (from the VLA) is RA , with realistic rms uncertainty of 2 arcsec. It lies within the uncertainty ellipse of our 1665-MHz OH position and seems likely to be coincident.
21.880+0.014
The OH discovery resulted from a Parkes follow-up in 1993 of a strong methanol maser (Caswell et al. 1995). The weak 0.35-Jy 1665-MHz emission seen in our 2005 spectrum (displayed) remains similar to 1993 and our 2004 observations. It has remained too weak to position with the ATCA, and in Table 1 we cite the position of the assumed associated methanol maser. Note that the apparent emission near velocity 38 is a weak response to 21.795-0.128, offset 9.8 arcmin and thus near the edge of the Parkes beam for this observation.
22.435-0.169
1665-MHz emission in the velocity range 23.5 to 35.5 has remained similar since 1982 and 1989, except that the currently strong 9-Jy LHCP feature at 25.6 was then only 3 Jy. More recently it has been stable over the period 2005, 2004 and 2003 (NRT), and has shown persistent linear polarization. 1667-MHz emission is very weak. A new 1665-MHz position from ATCA observations (rms position uncertainties 3.3 arcsec, 1.5 arcsec) confirms the coincidence with 6035-MHz emission and with methanol (Caswell 2009), but the slightly more precise methanol position is treated as the most probable position, as cited in Table 1.
23.010-0.411
1665-MHz emission is weaker than in 1982 or 1989, and with many changes but still covering the velocity range 66 to at least 75 ; 1667-MHz emission is weak but spanning a wider velocity range, from 64 to 84 across an absorption feature. Despite variability there has been persistent 1665-MHz linear polarization in 2005, 2004, and 2003 (NRT), and especially high at 66.8 in 2005. 1667-MHz emission has been more variable, and the linear polarization seen by the NRT was below our sensitivity threshold in 2005, and marginal in 2004. There is an associated methanol maser (Caswell 2009).
23.437-0.184 and 23.440-0.182
The position of the strongest 1665-MHz feature at velocity +106.0 (Forster & Caswell 1989, 1999) corresponds to 23.437-0.184. As noted by Forster & Caswell (1999), there are weaker RHCP features at velocities below +105 , extending to +100 , and overlapping an absorption feature, which are offset 14 arcsec to the north (see also Forster & Caswell 2000), corresponding to 23.440-0.182, and we interpret all emission at velocity below +105 to be at this site, although this is tentative in view of spectral variability, and there is probably some overlap in velocity.
The weak 1665-MHz feature at velocity +101 shows weak but persistent linear polarization (especially negative Q) at our observing epochs 2004, 2005, and at the 2003 epoch of NRT observations. 1667-MHz emission near 106 and 103.5 extends to 98.5 , as confirmed by the NRT spectra and is likely to include features at both sites. Both sites are accompanied by methanol maser emission (Caswell 2009).
23.456-0.200
This source was newly discovered in our 2004 observations while targeting the previous sources (23.437-0.184 and 23.440-0.182). Its spatial offset from them is approximately 1.5 arcmin, and its velocity range is quite distinct. The position cited in Table 1 is from our ATCA measurements, with rms uncertainties of 5.9 and 3.4 arcsec in RA and Declination respectively. Emission is detected only as RHCP at 1665 MHz, with no change recorded between our 2004 and 2005 epoch observations. There has been no report of methanol maser emission here.
24.329+0.145
We refer to Caswell & Green (2011) for an extensive discussion of this source, which highlights its coincidence with a methanol maser and interprets the most prominent OH emission as a blue-shifted outflow. The 1667-MHz emission displayed here is in good agreement with the spectra shown by Caswell & Green (2011) in every respect, including linear polarization. Our spectra are shown in two panels so as to cover both the outflow velocity and the systemic velocity near +113 (as interpreted from associated methanol maser emission). The 1665-MHz spectra from 2004 reveal LHCP emission at +111.8 which persisted in our 2005 spectra, and is close to velocities where transient emission had been reported (+115 ) at two epochs in 1993. The feature at +106.9 was below our sensitivity threshold in 2005. The implied variability for features near the systemic velocity is similar to earlier reports summarised by Caswell & Green (2011). Absorption between +105 and +120 is indicative of more extended OH clouds in the vicinity of the maser and its inferred young high-mass star host.
24.494-0.039
This site is a neighbour of the previous one (24.329+0.145, offset spatially by 15 arcmin) and close in velocity; both sites are discussed extensvely by Caswell & Green (2011). The three features of the 1667-MHz spectrum of 2010 shown by Caswell & Green (2011) are evident in our 2005 spectra shown here, and we note that the very narrow spikes at 106.9 and 108.7 in our present spectrum are terrestrial interference, not astronomical. The 1665-MHz emission is also unchanged; the present spectrum is not affected by sidelobes from the site 24.790+0.083 (the following source) that were evident in the spectrum shown by Caswell & Green (2011). Coincidence with a methanol maser was confirmed by Caswell & Green (2011).
24.790+0.084
Together with the two previous sources (offset 20 arcmin), this site is also discussed in detail by Caswell & Green (2011). Compared with their spectra in 2010, our spectra from 2004, although showing emission over the same velocity range, have much lower peak 1665-MHz intensity (demonstrating the continuing variability at 1665 MHz), and show the weak accompanying emission at 1667 MHz. The record of strong variability now extends over the long period from 1982 through 1990, 2003, 2004 and 2005 to 2010. The velocity range of prominent 1665-MHz emission in our displayed spectrum (epoch 2004) is 105 to 113 , and at 1667 MHz extends to 114.5 . In 1982, features in the velocity range 100 to 110 were prominent. NRT spectra from 2003 agree well with ours, and corroborate in detail the linear polarization of the 1665-MHz emission, reaching 80 per cent for the strongest feature at +111 . Coincidence of methanol is discussed by Caswell & Green (2011).
28.147-0.004 and 28.201-0.049
28.147-0.004 is a site with weak OH emission detectable only at 1665 MHz, and confined to velocities between 100 and 103.5 , as evident from Argon et al. (2000) and NRT observations. We do not show a spectrum precisely at this target since it is offset by only 4.3 arcmin (mostly in RA) from the displayed source 28.201-0.049, and can be seen on that spectrum (but note the reduced amplitude of 28.147-0.004 resulting from the offset, so that its apparent emission should be increased by a factor of 1.4; the correction has been applied to peak values in Table 1). Linear polarization of nearly 50 per cent is present as confirmed by the NRT. The OH is coincident with a methanol maser (see Caswell 2009)
The remaining emission on the spectrum, at velocities below 100 , is from 28.201-0.049. The strongest 1665-MHz feature of 1982, RHCP 15 Jy at velocity 95 , increased through 1989 to 26 Jy and decayed through 1993 to now only 3 Jy, and thus weaker than the other features at both 1665 and 1667 MHz that remain in the velocity range 92 to 100 . There is coincident methanol (Caswell 2009).
28.862+0.065
The current spectra at both 1665 and 1667 MHz have changed little since 1982 and 1990. Remarkably, all features are highly LHCP with the exception of a weak RHCP 1665-MHz feature at 107.5 . There is weak 1665-MHz linear polarization at 102.8 , persistent from 2004 to 2005. The OH position has subarcsecond uncertainty, and the nearby methanol, with less precise position. most likely coincides since it agrees to within 1.5 arcsec in declination and 7 arcsec in RA, well within the current uncertainty of about 10 arcsec (Caswell et al. 1995).
29.862-0.040 and 29.956-0.016
Note that for both these sites, the 1667-MHz spectra show interference spikes at velocities 107.9 and 109.9 , and no 1667-MHz maser emission is present.
1665-MHz emission at both sites is of similar intensity. The sites are separated by approximately 6 arcmin (half the half-power beamwidth for the present measurements). The aligned spectra displayed here clearly show that features between 100 and 108 are accounted for by 29.862-0.040, while features between 97.5 and 99 arise from 29.956-0.015. New ATCA position measurements for the OH were taken with a short baseline hybrid array. The resulting position for 29.862-0.040 given in Table 1 has position rms uncertainties of 5.4 and 2.9 arcsec in RA and declination respectively. It seems likely to match a methanol maser site, 29.864-0.043, with corresponding position estimate of (derived from the Walsh et al (1998) position for a feature at +101 , after correction for a suspected declination error of 2.4 arcsec at this declination).
In the case of 29.956-0.016, the uncertainty in the OH position was larger, 15 arcsec, owing to unresolved absorption which led to a poorly determined baseline. Near this OH source, the methanol maser 29.956-0.016 has been measured to much higher precision (Minier Conway & Booth 2001) and is coincident with the OH to within 15 arcsec; since this seems likely to be a valid association, we have cited the methanol position in Table 1.
At 29.862-0.040, the NRT OH spectrum (epoch 2005) shows excellent agreement with our 2005 spectrum, and both datasets indicate the remarkable 100 per cent linear polarization for the two features. Archival Parkes data (with no information on linear polarization) from 1989 show similar total intensity but, in 1993, a peak less than half the present value.
The OH at 29.956-0.016 has shown very little change since Parkes archival spectra in 1993, which showed a similar single, wholly RHCP, feature at 98.2 , with peak of 0.9 Jy. Although there is no targeted NRT spectrum at 29.956-0.016, the NRT observation towards 29.86-0.05 also provides a good spectrum of 29.956-0.016 since the offset is less than 1 arcmin (4s) in RA (and 6 arcmin in declination where the beamwidth is larger). It agrees well with the Parkes 2005 and 2004 present measurements.
30.589-0.043
Strong emission is present at 1665 and 1667 MHz. Our 2004 and 2005 spectra show no major changes relative to spectra from 1982, 1990 (Parkes archival data) or 1993 (Argon et al. 2000). Fractional linear polarization is low, The OH position agrees well with a prominent ucH ii region (Argon et al. 2000). A small discrepancy with the methanol maser position (Walsh et al. 1998) is wholly in declination and likely to reflect a large uncertainty of the methanol estimate, similar to other sources nearby that needed a shift south by 7 arcsec to correspond with more precise position measurements.
30.703-0.068
This source is dominated by a feature at 91.2 , mainly RHCP at both 1665 and 1667 MHz, with peaks of 14 Jy and 10 Jy respectively. At 1665 MHz it spans at least 86 to 97.5 , with additional 1667-MHz features (not seen in 1982) now peaking at 82 (extending down to 79 in 2004 but not seen in the displayed spectrum of 2005). Observations in 1993 January (Argon et al. 2000) surprisingly fail to show features at velocity lower than 85 , and the highest velocity emission is poorly covered, owing to the plot limit at +97 .
Comparison of our spectra in 2004 and 2005, and the NRT in 2003 May, show all features mildly variable. Linear polarization is persistent and exceeded 50 per cent on several features at both transitions in the displayed spectrum of 2005.
The methanol position (Walsh 1998) has an apparent declination offset from the OH position similar to that of the previous and following source, suggesting the association is valid and there is a small systematic error of several arcsec in the methanol position.
30.820-0.060
Our display range overlaps that of the previous site 30.703-0.068 whose strong emission is also seen, but with amplitude reduced by the offset of about 6 arcmin. The major features of 30.820-0.060 are near 106 , chiefly LHCP 1665 MHz, and weaker at 1667 MHz. Weak 1667-MHz interference is seen at velocity 108.1 and 110.1 .
The Nancay spectrum (labelled 30.82-0.05) is similar to ours, but with the 106.2 feature slightly stronger, and corroborating negligible linear polarization.
Our OH position from new ATCA measurements in a short baseline hybrid configuration is cited in Table 1 and has rms uncertainties of 10 and 5 arcsec in RA and Declination. To within this precision, it coincides with a methanol maser at (with uncertainty less than 1 arcsec from MMB unpublished data) corresponding to 30.818-0.057, which is most likely a better estimate of the OH position.
30.788+0.204, 30.819+0.273, and 30.897+0.161
The displayed plot shows the large velocity range +75 to +110 , so as to show not only 30.788+0.204 (with 1665-MHz emission between 77 and 84 ) but also 30.819+0.273 (with 1665 and 1667-MHz emission between 100 and 105 ) and 30.897+0.161 with 1665-MHz emission at 107.8 ; the second and third sites are offset from the target position by 4.6 arcmin and 7 arcmin respectively, and thus the apparent intensities on the displayed plot need intensity correction factors of 1.54 and 2.5 to compensate for the reduced gain at the offset position.
30.788+0.204 was first observed at Parkes in 1993 and the two major features, RHCP at 78 , and LHCP at 81 remain prominent but with RHCP now slightly stronger and LHCP slightly weaker. No detectable changes are seen between our 2004 data (as displayed), our 2005 October data, or the NRT data from 2005 September.
The position cited in Table 1 is a precise 6668-MHz methanol position; the OH position from our ATCA data has rms uncertainty of 21 and 12 arcsec in RA and Declination respectively, yielding the same declination, and RA larger by 0.7s, and thus coincident with the cited methanol position to within the OH position uncertainty.
For the site 30.819+0.273, both 1665 and 1667-MHz spectra show features between 100 and 105 , with peak at 1665 MHz of 3.5 Jy (after correction for the offset position). Additional unpublished spectra centred at 30.819+0.273 confirm this, and show essentially no change between 2004 and 2005 or the NRT spectra in 2003. The 1665-MHz emission when first observed at Parkes in 1993 (archival data) showed similar spectra with emission dominated by RHCP features peaking at 3 Jy. The OH position (in Table 1) determined with the ATCA has rms uncertainties of 2.5 and 1.3 arcsec in RA and Declination respectively and coincides with a methanol maser.
The 1665-MHz emission at velocity 107.9 , predominantly LHCP, most likely arises from a third site, 30.897+0.161 where a methanol maser was first reported by Schutte et al (1993) with peak flux density between 50 and 100 Jy near velocity 102 ; the best estimate of its position is , where we use the methanol position from Walsh et al. (1998), after applying a declination correction of 7 arcsec which we found necessary for other sources at this declination observed in that project. The OH emission was first noted at Parkes in 1993, with LHCP peak of 1 Jy, somewhat weaker than its 2004 value, after allowing for the offset in position by 7 arcmin of our displayed 2004 spectra. We reiterate that the position cited in Table 1 is from a methanol measurement, and the coincidence of OH is currently uncertain to several arcmin.
31.243-0.111
Archival spectra of 1665-MHz emission obtained in 1982 showed a peak of 5.3 Jy which has subsequently been decaying through 3 Jy (1993) to the present peak near 2 Jy (2004 and 2005). Linear polarization is weak but significant. There is no known methanol here, with upper limit 0.5 Jy (Caswell et al. 1995).
31.281+0.061
Several features at 1665 and 1667 MHz were present in 1982, spanning velocities 103 to 109 , and with absorption extending to 111 ; features in the same velocity range and of similar intensity persist through 1989 to the present but differ in detail. At 1665 MHz, a 1-Jy flare at 107.6 occurred in 2005 October, seen slightly weaker in 2005 September on the NRT spectra. Weak linear polarization is evident in all observations. Methanol and OH positions in RA agree well, and the discrepancy in declination of 7 arcsec is similar to that of nearby sites and seems likely to be chiefly an error in the methanol position (Walsh et al. 1998; note that the position from Minier et al. 2001 is merely taken from Walsh et al. 1998)
31.394-0.258
First reported by Cohen et al. (1988), emission is mainly 1665-MHz LHCP, with 1.5 Jy peak in 1993 and still similar; weak 1667-MHz emission is also present. The new ATCA position (Table 1) has rms uncertainties of 6 and 4 arcsec in RA and declination. There are no reports of methanol emission here.
31.412+0.307
The present spectra at 1665 and 1667 MHz extend over a range 86 to at least 114 , as also seen in 1993 at 1665 MHz, and extending beyond the 108 limit of the Argon et al. (2000) spectra. Despite marked changes since 1993, our spectra from 2004 and 2005, and 2004 September spectra from the NRT have remained stable. Prominent linear polarization is seen at 95 , 1665 MHz. At the OH position, there is also methanol maser emission (Walsh et al. 1998)
32.744-0.076
Features from 25 to 40 in 1982, with peaks of 2 Jy and 1 Jy at 1665 and 1667 MHz respectively, have remained similar through 1989 to 2004 and 2005. Flaring features in 2004, 1665-MHz LHCP at velocity 33.4 , and 1667-MHz RHCP at 30.9 , subsided in 2005 (our displayed spectrum and the NRT spectra of 2005 April). At the OH position there is a methanol maser (Caswell et al. 1995), coincident to within its 10 arcsec position uncertainty.
33.133-0.092
Features from 72 to 82 in 1982 showed peaks of 8 Jy at 1665 MHz and 3 Jy at 1667 MHz; spectra of 2004, 2005 and 2004 July (NRT) mutually agree, and are stronger at 1665 MHz but weaker at 1667 MHz. The association of a methanol maser (Caswell et al. 1995) at holds to within 10 arcsec, the methanol positional accuracy.
34.258+0.153
OH maser spots are spread over a large extent of 4 arcsec, with complex continuum emission from an H ii region covering a similar extent (Argon et al. 2000; Fish et al. 2005). A methanol maser also coincides (Caswell 2001).
The extensive previous OH observations include those from the VLBA, VLA, NRT and Parkes. Peaks now at 1665 MHz (60 Jy) and at 1667 MHz (100 Jy) are slightly stronger than in 1982 and 1990, but generally similar. Linear polarization at 1667 MHz is seen to be especially high (2004 and 2005), in agreement with the VLBA measurements (Fish et al. 2005) in 2001 January and NRT 2003 March, with a feature at 58.7 with ppa 140∘; and a secondary feature at 57.5 with ppa 60∘.
34.411+0.231
The displayed spectra are aligned with those of the very strong previous source, 34.258+0.153 which is separated by only 10 arcmin and is detectable at this target position with amplitude reduced by an order of magnitude. It is then evident that 34.411+0.231 accounts only for the emission from 53 to 57 at 1667 MHz and from 53 to 55.5 at 1665 MHz. An early Parkes observation in 1993 showed peaks of 2 Jy and 1.5 Jy at 1665 and 1667 MHz respectively. The 2004 observation was similar but an increase is clear in the 2005 spectra as displayed. Prominent linear polarization is present at 1665 MHz. The position obtained with the ATCA (Table 1) has rms uncertainties of 4 and 2 arcsec in RA and Declination respectively. A nearby water maser has a precise parallax distance of 1.56 kpc, despite an uncertain absolute position (Kuruyama et al 2011); it seems likely that the water, 34.394+0.221, coincides with a 6668-MHz methanol maser (Pestalozzi, Minier & Booth 2005), but is offset from the OH by at least 1 arcmin, indicating an association merely in the same cluster rather than coincidence with a common exciting star.
35.025+0.350
No significant changes occurred between epochs 2005 (displayed), 2004, and the NRT spectra of 2003 March, with all showing persistent linear polarization; similar spectral features were recognisable in 1993 and 1982, although with intensity changes by factors of 2.
Precise methanol maser position measurements (Cyganowski et al. 2009). yield a position , in good agreement with the OH.
35.197-0.743
Features at 1665 MHz span velocities 24.5 to 38 at various epochs. Great variability has occurred between 1982, 1990, 1993 January (VLA), 1993 December (MERLIN) and 2005, with spectra essentially so different as to be unrecognisable except for position and velocity range.
Several weak features are seen at 1667, fading from 2003 (NRT) and 2004 to 2005. Linear polarization is evident at 1667 MHz, and at 1665 MHz, in both cases agreeing well with the NRT data. However the details have changed greatly from those observed with MERLIN in 1993 (Hutawarakorn & Cohen 1999).
Precise methanol maser position measurements establish an astrometric parallax distance for the site, 2.19 kpc with 10 per cent uncertainty (Zhang et al. 2009). and the OH emission, which is spread over a 2 arcsec region (Forster & Caswell 1999; Argon et al. 2000) encompasses the methanol masing region, consistent with a common source of excitation.
35.201-1.736
There have been considerable changes in spectra at both 1665 and 1667 MHz between 1982 and 2005. More recently there has been closer agreement between 2003 (NRT) and 2005, although the significant linear polarization (approaching 50 per cent) of the prominent flaring feature seen in the displayed (2005) 1665-MHz spectrum at 43.2 was much lower in the pre-flare emission in 2004 and not seen in 2003.
Precise methanol maser position measurements establish an astrometric parallax distance for the site, 3.27 kpc with 15 per cent uncertainty (Zhang et al. 2009). The associated OH emission region overlaps the methanol masing region.
35.578-0.030
Strong features at both 1665 and 1667 MHz have slowly increased from 1982 through 1990 and 1993 (VLA) to current peaks of 60 Jy (but RHCP now stronger than LHCP) at 1665 MHz, velocity 49.0 . The 1667-MHz peak was 20 Jy (LHCP) at 50.3 in 2004 but halved in 2005.
The VLBA measurements at 1667 MHz show the major feature mainly LHCP, with weaker linear polarization, at ppa 60∘ in agreement with our spectra showing positive U and smaller negative Q. The 1665-MHz emission peak is a complex blend of three features, and close comparison suggests that there is again good agreement between the VLBA and the present data.
The OH maser is accompanied by continuum emission that is compact on a scale of several arcsec, but with complex structure (Argon et al. 2000), and is presumably an associated HII region. There has been no detection of any 6668-MHz methanol maser nearby (Caswell et al. 1995 and subsequent unpublished searches).
40.426+0.700
Current 1665-MHz emission remains similar to the earliest Parkes unpublished archival spectrum of 1993.
A position measurement for 1665-MHz emission with the ATCA gave a position with rms uncertainties 2.5 and 1.5 arcsec. Within these errors, it coincides with the better determined position of 6035-MHz emission, which we have preferred to cite in Table 1, with the intention of providing the most likely precise position. It agrees well with the 6668-MHz methanol position (Caswell 2009).
40.623-0.138
Since 1982, the 1665-MHz peak has increased from 80 Jy to 110 Jy, and at 1667 MHz remains below 20 Jy, but secondary features have increased.
Full polarization comparisons are possible between the VLBA and the NRT (as noted by Szymczak & Gerard 2009), and with our data. A specific example, the 1665-MHz strongest feature, at 32.6 , has high linear polarization of 74 per cent at ppa -78∘ i.e +102∘ in the NRT data. Our 2005 data show a similarly high percentage linear, almost wholly negative Q, and thus ppa near 90∘, in good agreement. The VLBA lists 46 per cent linear polarization with ppa 117∘, in somewhat poorer agreement, in part likely to arise from the epoch difference of several years.
The OH position closely agrees with the precise position of a 6668-MHz methanol maser (Caswell 2009).
4 Statistics from the present data
We first recall the selection parameters of the present data set. It has been limited to maser sites believed to be associated with regions of young massive star formation in a portion of the Galactic disc accessible to both northern and southern observatories, thus allowing extensive comparisons with other data. Many of these sources had been discovered by unbiased surveys, but others are from targeted observations, especially the more northerly sources. The sample is also limited to sites with well-determined positions (usually with arcsecond accuracy), but is not complete, with a bias amongst northern sites towards the stronger sources known for several decades. However, none of the statistics that follow are expected to suffer any major bias from these limitations. A well-known statistic, that the ratio of 1665 to 1667-MHz intensity (peak or integrated) usually favours 1665-MHz emission (but with some clear counter-examples) is evident from our data, as expected. We will re-visit this statistic, after the analysis of 150 more southerly sources, in Paper II.
4.1 Comparisons with masers of water and methanol
High spatial resolution studies of the association of water masers with OH (Forster & Caswell 1989) showed that, in addition to the frequent occurrence of coincident water and OH maser sites, there were often additional sites of water maser emission slightly separated from a target OH maser. A search for water towards a larger sample of OH masers (Breen et al. 2010b) showed that 79 per cent of the OH masers had a closely associated water maser. We note that most of the OH masers studied here are contained in these earlier water studies, and thus similar conclusions apply to the present OH masers.
Turning to methanol, previous statistics with respect to associations of masers of OH (of the SFR or massive YSO variety) with methanol suggest that 80 per cent of OH masers have an accompanying methanol maser (Caswell 1998). Following the procedures of that study, in Table 1, a simple comparison of methanol to OH is made, listing the ratio: peak methanol intensity to peak OH intensity. As remarked in Section 3.3, the comparison has been improved since the Caswell (1998) investigation owing to some improved OH positions in the present paper, and recently improved methanol positions.
We conclude that 87 of the 104 OH masers presented here have closely associated methanol masers, and 17 do not. It has been noted that OH masers without methanol (or with very low ratio of methanol to OH intensity) are more commonly associated with detectable ultra-compact HII regions (Caswell 1996, 1997). This is interpreted as an evolutionary trend (Caswell 1996, 1997, 1998; Breen et al. 2010a), such that maser sites where OH outshines the methanol are in the later stages of evolution.
We draw attention to the need for a northern hemisphere, sensitive, unbiased survey for OH masers, at least matching, and preferably surpassing, the southern hemisphere counterpart (Caswell 1998). Although follow-up to the unbiased methanol surveys recently completed will lead to the detection of many new OH masers (Green et al. 2012b), this will not wholly achieve the aims of an unbiased OH survey since the OH class that have little or no accompanying methanol will be greatly under-represented. In the southern hemisphere, an improved unbiased survey is planned with the GASKAP survey (Dickey et al. 2012).
4.2 Maser site velocity ranges
The velocity range of emission for masers in star formation regions can be a useful diagnostic in several ways.
In the case of masers at the methanol 6668-MHz transition, large samples (of several hundred) show a distribution of velocity range which has a small median value of about 6 (Caswell 2009). A source with range of 26.5 (Caswell et al. 2011b) is the only one exceeding 25 . There is a weak trend for velocity range to be an increasing function of intensity; although a sensitivity effect limits the measurable range for weak sources (Caswell et al. 1995), it none the less seems likely that a major contribution to the overall trend is one of evolution, where more evolved sources are stronger and have wider velocity ranges (Breen et al. 2010a). However, there has been no clear evidence for significant outflows, and the mid-range velocity appears to be a good estimate of the systemic velocity for all sources (see also Szymczak Bartkiewicz & Richards 2007; Pandian Menten & Goldsmith 2009; Green & McClure-Griffiths 2011).
In the case of water masers, a large sample of several hundred masers shows a median velocity range of 15 (Breen et al. 2010b); Breen et al. draw attention to those masers with features offset from the systemic velocity by more than 30 , interpreted as high velocity outflows. These high velocity outflows most likely occur in collimated jets. In particular, there is an unusual class of such high velocity outflows favouring blue-shifts (Caswell & Phillips 2008; Caswell & Breen 2010; Caswell Breen & Ellingsen 2010c; Motogi et al. 2011b, 2012); these primarily occur at sites where there is neither OH emission nor readily detected ucH ii continuum emission, consistent with an interpretation that they are confined to an early evolutionary phase of massive star formation. This association of wide velocity ranges of water masers with an early evolutionary phase is in marked contrast to methanol masers, where the rare, wider, velocity ranges are believed to be the signature of a late evolutionary phase.
The velocity ranges for OH masers have been less studied, but a median value of 9 has been reported for OH 1665 or 1667-MHz masers (Caswell 1998). The present sample of sensitive spectra with good velocity coverage allows us to revisit the statistics for this maser variety. The median for our sample of 101 is 8.3 , essentially the same as found by Caswell (1998) for a larger (partially overlapping) sample. We first single out sites with a velocity spread exceeding 25 , of which we find seven.
Considering them individually, we note that 351.775-0.536 has a likely systemic velocity near -3 , estimated from the median of the narrow range of methanol emission velocities; thus the large OH range, from -36 to +8 arises largely from weak blue-shifted features. The site has no reliably detected continuum emission (with rms noise level of 0.27 mJy at 8.4 GHz in maps from Argon et al. (2000)) and is likely to be at an early evolutionary phase.
In contrast, 5.885-0.392, with relatively weak methanol emission and a strong H ii region, is a well-studied evolved site, probably approaching the end of its lifetime as a maser emitter. The velocity range of OH emission, from -44 to +18 is the largest in our sample and its interpretation as a general expansion driven by the H ii region (Stark et al. 2007) is plausible. A noticeable asymmetry, relative to the mean recombination line velocity centred near +9 , indicates a favouring of blue over red-shifted outflow. An absence of strong red-shifted emission might be caused by the extremely strong H ii region obscuring any possible red-shifted emission flowing out from the far side, and providing increased seed radiation for masers on the near side which are blue-shifted towards us. Alternative variations include biconical outflows (Zijlstra et al. 1990), and a combination where the H ii region is interacting with a pre-existing outflow (Hunter et al. 2008).
10.473+0.027 has an OH velocity range from +43.5 to +71 , and the associated strong methanol maser has a range from 57.5 to 77.6 , but the site has not been studied in depth and cannot be reliably classified. 14.166-0.061 with a range from +26.5 to +68 , is an OH maser that is weaker at 1665 than 1667 MHz, and with no known methanol counterpart, but with a water maser counterpart, and little other information. 19.609-0.234 with OH range +18 to +45 has a matching methanol counterpart with velocity range +36.0 to +42.0, and thus the likely systemic velocity of the site is near +39.0 . On this interpretation, the OH emission near +40 is at the systemic velocity, stronger at 1665 than 1667 MHz, while emission near +20 represents a blue-shifted outflow, equally strong at 1667 and 1665 MHz. 24.329+0.145 has been studied in detail (Caswell & Green 2011) and is dominated by a blue-shifted outflow at 1667 MHz, with weak emission also seen at 1665 MHz but near the systemic velocity only. Towards 31.412+0.307, the OH emission velocity range, from +86.5 to +113 , has accompanying methanol emission over a slightly smaller range, +90 to 108, with almost the same central velocity, and thus no indication of any preferred outflow.
Summarising the above details:
5.885-0.392, 31.412+0.307, 10.473+0.027 and 14.166-0.061 all seem likely to be evolved sites where there is a general outflow, although with some bias to blue-shifts perhaps accounted for by effects from a central H ii region.
Most remarkable amongst our OH masers are 351.775-0.536, 19.609-0.234, and 24.329+0.145, with asymmetric strong outflows, all interpreted as blue-shifted relative to the systemic velocity, and with no readily detected ucH ii region. We interpret these three to be at an early evolutionary stage.
For 24.329+0.145, a detailed analysis (Caswell & Green 2011) links the OH blue-shifted outflow to an accompanying water maser blue-shifted outflow, and thus membership of the distinct class of water masers with blue-shifted outflow characteristics recognised by Caswell & Phillips (2008). 24.329+0.145 appears to be an especially rare object where the dominant blue-shifted outflow is displayed by both the water and OH maser emission.
4.3 Variability of OH masers
Details of variability are given in the source notes of Section 3.3. Very few sources show features with high variability between our 2004 and 2005 observations, with only five showing more than a factor of 2 variation in their strongest feature at either 1665 or 1667 MHz. They are: 350.011-1.342, 351.775-0.536, 12.209-0.103, 35.197-0.743 and 35.578-0.030.
On a longer timescale, high stability is evident at 10 of the 82 sites where comparisons are possible with earlier data over several decades. Over these long periods, dramatic changes, mostly strong ‘flares’, have been seen for 6 sources: 351.775-0.536, 12.908-0.260, 13.656-0.599, 19.473+0.170, 22.435-0.169 and 28.201-0.049.
These statistics, as well as the reference spectra shown here, will be useful in planning future variability studies. We note that the weakly varying source 12.889+0.489 with likely periodicity of 29.5 days is within our sample, and there are, doubtless, other examples to be discovered which will require dedicated monitoring programs (Green et al. 2012a).
4.4 Circular polarization of the OH emission
Many earlier studies of OH maser sites note the occurrence of circular polarization at 1665 and 1667 MHz, caused by Zeeman splitting in magnetic fields of several mG. From large, uniformly studied, samples of sources (e.g. Szymczak & Gerard 2009), the majority of features, at most sites, exhibit significant polarization, and some features are found to be essentially 100 per cent polarized. The same is true of the present sample, with the noteworthy exception of 15.034-0.677 which shows neither circular nor linear polarization above our sensitivity level detection limit. The fact that 15.034-0.677 is associated with extremely strong continuum H ii emission (M 17), the strongest background emission towards any source in our survey, may be linked to this. More detailed discussion of circular polarization statistics will not be addressed here since it can be better dealt with when combined with the additional 150 sources that will shortly be published for the most southern portion of our survey, Part II.
4.5 Linear polarization of the OH emission
Our measurements reveal some remarkable examples of linear polarization greater than 90 per cent, and in three cases these occur in features stronger than 5 Jy. 13.656-0.599 is an outstanding example with a 1665-MHz feature at 48.4 showing over 90 per cent linear polarization of a feature with total intensity varying between 60 and 50 Jy at our two epochs. The NRT observations corroborate our polarization measurements (but we note that their offset target position causes a severe underestimate of total intensity). 12.908-0.260 exhibited several adjacent 1667-MHz features near 30 , that flared in 2005 with the strongest peak reaching 150 Jy, relative to peaks of 6 Jy in our 2004 measurement, and only 1 Jy with the NRT in 2003. Fractional linear polarization has been high at all epochs, and indistinguishable from 100 per cent in our measurements. 12.889+0.489 also shows prominent linear polarization which appears to exceed 90 per cent in a 1665-MHz feature near 32.5 , but is blended with strong adjacent features. Additional to these three outstanding objects in our data, we draw attention to one remarkable 1665-MHz feature in the NRT data set, in 133.95+1.06, W3(OH), at -47.41 , with large linearly polarized flux density of 135.9 Jy, corresponding to 98.9 per cent. Surprisingly, the VLBA data of Wright et al. (2004a) in 1996 show no similarly large fractional polarization for any feature.
Turning to the more general statistics on the occurrence of linear polarization, amongst the sample of nearly 100 sources studied by Szymczak & Gerard (2009), some linear polarization was detectable in 80 per cent of 1665-MHz spectra and 62 per cent of 1667-MHz spectra; the smaller fraction at 1667 MHz is most likely due to the relatively weaker emission, and thus the observational sensitivity threshold has greater impact at 1667 MHz. In our sample, we find linear polarization in more than 74 of 89 1665-MHz spectra (excluding those weak sources with total intensity peaks less than 0.5 Jy), i.e. 83 per cent; and in 39 of 70 1667-MHz spectra (again excluding spectra with only weak emission), i.e. 56 per cent. Approximately half the sources are common to the NRT sample and, for these, our percentages are 87 per cent at 1665 and 50 per cent at 1667 MHz, where the slight difference from the NRT statistics can readily be accounted for by variability and slightly different noise levels. We find similar statistics for sources not in the NRT sample, percentages of 79 per cent and 62 per cent at 1665 and 1667 MHz respectively.
Narrowing our focus to sources where very strong polarization occurs in at least one feature: with criterion similar to Szymczak & Gerard (2009), we find features that are at least 50 per cent linearly polarized in 35 per cent of the 1665-MHz spectra and 23 per cent of the 1667-MHz spectra. These sources are identifiable in column 11 of Table 1, and we now compare them with the similar results of Szymczak & Gerard (2009), in Table B1 of their Appendix.
We first note that 16 sources are listed with high linear polarization by the NRT and by us. Four other sites are listed with strong linear polarization by the NRT but not by us and are considered individually:
12.209-0.103 has many features in the spectra at both 1665 and 1667 MHz that show significant linear polarization, with good agreement between the NRT data and ours. The listed 1665-MHz feature in NRT Table B1 is a minor feature that lies just above the 0.5 Jy and 50 per cent threshold, whereas it lies just below the threshold in our spectra.
23.44-0.18 has only low linear polarization for the strong spectral features. The listed 1665-MHz feature in NRT Table B1 is a minor feature that lies just above the 0.5 Jy and 50 per cent threshold, whereas it lies just below the threshold in our spectra.
31.27+0.06 has a listed 1665-MHz feature in NRT Table B1 which is a weak shoulder feature that lies just above the 0.5 Jy and 50 per cent threshold, whereas it lies just below the threshold in our spectra.
35.200-1.736 has NRT features of high linear polarization listed at 1665 and 1667 MHz. We also detect similarly strongly polarized features but they lie just below the 50 per cent threshold and are not listed in our Table.
Two sites are listed with high linear polarization by us but not NRT. They are:
23.010-0.411 at 1665 MHz for features weak in 2003 (NRT) but stronger and polarized in 2004 and 2005.
32.744-0.076 at both 1665 and 1667 MHz. Similar polarization visible in the NRT spectra is not listed in their Table B1 because it is slightly weaker.
Finally, many of the spectra with no perceptible linear polariation have only weak features, for which only high percentage linear polarization would be above our detection threshold. With this in mind, our results agree in detail with those of Szymczak & Gerard (2009) for sources in common and, statistically, for the sources observed only in our observations. Overall, the mutual corroboration lends high confidence in the reliability of both data sets.
5 Polarization patterns
The displayed spectra from our present observations show that most of the individual spectral features are elliptically polarized, with the circular polarization dominating, and often with unpolarized emission also present. Linear polarization is occasionally very pronounced, often for one or a few features in a multi-feature spectrum.
In most spectra there are examples of apparent Zeeman patterns. However, compared with single dish (low spatial resolution) spectra of 1720, 6035 and 6030-MHz masers (Caswell 2003, 2004a), they are less easily recognised because: (i) there are generally more features, leading to confusion; (ii) confusion is exacerbated by the quite large splitting; and (iii) the amplitudes of Zeeman pair components are commonly very unequal. None the less, the full polarization spectra of the OH 1665 and 1667-MHz transitions can be very informative, provided that the spectral resolution is high, as demonstrated for the similar statistics from the NRT sample of spectra by Szymczak & Gerard (2009).
Szymczak & Gerard (2009) review the puzzle that, despite the common presence of two components (predominantly circularly polarized in the opposite sense, and separated in frequency) which indicate a Zeeman pattern, the expected linearly polarized component midway between them is hardly ever seen. As noted by Szymczak & Gerard (2009), a variety of explanations can account for these puzzles. However, it is strange that, within some spectra, there are indeed highly linearly polarized features, but they seem not to be part of any Zeeman pattern. A few such examples occur in the sample of 150 masers that result from combining the present survey with the NRT survey. We note that the sample size will soon be doubled when analyses of our observations extending over the southern sky are complete, and we therefore defer further discussion of these puzzles. High spatial resolution from VLBI measurements will then be needed, and we reiterate the remarks of Szymczak & Gerard (2009), that high spectral resolution is especially vital for the linear polarization studies since NRT measurements demonstrate the common occurrence of large changes of ppa across the linearly polarized features. One contributor to such swings of position angle is Faraday rotation within the masing source. However, this may not be the dominant cause, and future investigation of OH masers at the higher frequency 6035-MHz transition may cast some light on this.
6 Conclusion
Full polarization spectra of OH masers are a vital step in their subsequent exploration with high spatial resolution. The large set of spectra in the present Parkes study, and the similar study with the Nancay Radio Telescope (Szymczak & Gerard 2009) show excellent agreement for the 50 sources in common, greatly expand the total of spectra now available, and provide reliable statistics of large samples. The linear polarization statistics, in particular, have resulted in the capture of several rare features with extremely high linear polarization, of which we noted three exceptional examples, 12.908-0.260, 13.656-0.599 and 12.889+0.489; further study of such sources may advance our poor understanding of the maser polarization properties, and their deviation from expectations (e.g. the absence of full Zeeman triplets, despite the common presence of Zeeman pairs). Our broader statistics, investigating the fraction of sources where at least one feature displays linear polarization exceeding 50 per cent, found this fraction to be 35 per cent for the 1665-MHz emission and 23 per cent for the 1667 MHz emission.
The maser site velocity spreads for OH have been compared with those of methanol and of water masers. The largest spans in velocity, exceeding 25 , are present in only a few OH masers, and appear to be of two distinct varieties: the first variety arise in the later stages of the maser evolution, with a general expansion over a wide angle possibly driven by the enclosed H ii region; the second variety appear similar to the collimated outflows from water masers, with indications of a preponderance of blue shifts, such as the remarkable source 24.329+0.145. These investigations will be pursued for a larger southern sample and require high spatial resolution studies to confirm the effects and interpret the cause. We note that future VLBI measurements at high spatial resolution require accompanying high spectral resolution to prevent depolarization caused by the common presence of a sweep of polarization position angle across the frequency width of the feature.
Finally, our data set has allowed preliminary characterisation of variability at each maser site, including recognition of variability in the past, and is an excellent yardstick for recognising future variability. With new monitoring programs able to select promising candidates from the present study, there are prospects for identifying periodic variables, with corresponding significance for the history and physical properties at such sites.
Acknowledgments
We thank Warwick Wilson for implementing the correlator enhancements, John Reynolds and Parkes Observatory staff for enabling the non-standard observing procedures, and Malte Marquarding for implementing, within the ATNF spectral analysis package asap, the spectropolarimetric reduction features developed for the present data.
References
- [1] Argon A.L., Reid M.J., Menten K.M., 2000, ApJ.Suppl., 129, 159
- [2] Asanok K., Etoka S., Gray M.D., Thomasson P., Richards A.M.S., Kramer B.H., 2010, MNRAS, 404, 120
- [3] Breen S.L., Ellingsen S.P., Caswell J.L., Lewis B.E., 2010a, MNRAS, 401, 2219.
- [4] Breen S.L., Caswell J.L., Ellingsen S.P., Phillips C.J., 2010b, MNRAS, 406, 1487.
- [5] Caswell J.L., 1996, MNRAS, 279, 79
- [6] Caswell J.L., 1997, MNRAS, 289, 203
- [7] Caswell J.L., 1998, MNRAS, 297, 215
- [8] Caswell J.L., 2001, MNRAS, 326, 805
- [9] Caswell J.L., 2003, MNRAS, 341, 551
- [10] Caswell J.L., 2004a, MNRAS, 349, 99
- [11] Caswell J.L., 2004b, MNRAS, 352, 101
- [12] Caswell J.L., 2009, Publ.Astron.Soc.Australia, 26, 454
- [13] Caswell J.L., Breen S.L., 2010, MNRAS, 407, 2599.
- [14] Caswell J.L., Green J.A., 2011, MNRAS, 411, 2059
- [15] Caswell J.L., Haynes R.F., 1983a, Aust.J.Phys., 36, 361
- [16] Caswell J.L., Haynes R.F., 1983b, Aust.J.Phys., 36, 417
- [17] Caswell J.L., Haynes R.F., 1987, Aust.J.Phys., 40, 215
- [18] Caswell J.L., Phillips C.J., 2008, MNRAS, 386, 1521.
- [19] Caswell J.L., Vaile R.A., 1995, MNRAS, 273, 328
- [20] Caswell J.L., Vaile R.A., Ellingsen S.P., Whiteoak J.B., Norris R.P., 1995, MNRAS, 272, 96
- [21] Caswell J.L., Kramer B.H., Sukom A., Reynolds J.E., 2010a, MNRAS, 402, 2649
- [22] Caswell J.L. et al. 2010b, MNRAS, 404, 1029
- [23] Caswell J.L., Breen S.L., Ellingsen S.P., 2010c, MNRAS, 410, 1283.
- [24] Caswell J.L., Kramer B.H., Reynolds J.E., 2011a, MNRAS, 414, 1914
- [25] Caswell J.L. et al. 2011b, MNRAS, 417, 1964
- [26] Cohen R.J., Baart E.E., Jonas J.L., 1988, MNRAS, 231, 205
- [27] Cyganowski C. J., Brogan C. L., Hunter T. R., Churchwell E., 2009, ApJ, 702, 1615
- [28] Dickey J.M., et al., 2012, PASA, in press
- [29] Fish V., Reid M.J., 2006, ApJ.Suppl., 164, 99
- [30] Fish V., Reid M.J., Argon A.L., Zheng X., 2005, ApJ.Suppl., 160, 220
- [31] Forster J.R., Caswell J.L., 1989, A&A., 213,339
- [32] Forster J.R., Caswell J.L., 1999, A&AS., 137, 43
- [33] Forster J.R., Caswell J.L., 2000, ApJ, 530, 371
- [34] Gallaway M. et al., 2013, MNRAS, (in press)
- [35] Green J.A., McClure-Griffiths N.M., 2011, MNRAS, 417, 2500
- [36] Green J.A. et al., 2009, MNRAS, 392, 783
- [37] Green J.A. et al., 2010, MNRAS, 409, 913
- [38] Green J.A., Caswell J.L., Voronkov M.A., McClure-Griffiths N.M., 2012a, MNRAS, 425, 1504
- [39] Green J.A., McClure-Griffiths N.M., Caswell J.L., Robishaw T., Harvey-Smith L., 2012b, MNRAS, 425, 2530
- [40] Hamaker J.P., Bregman J.D., 1996, A&AS., 117, 161
- [41] Haynes R.F., Caswell J.L., Goss W.M., 1976, Proc ASA, 3, 57
- [42] Hunter T.R., Brogan C.L., Indebetouw R., Cyganowski C.J., 2008, ApJ, 680, 1271
- [43] Hutawarakorn B., Cohen R.J., 1999, MNRAS, 303, 845
- [44] Kuruyama T., Nakagawa A., Sawada-Satoh S., Sato K., Honma M., Sunada K., Hirota T., Imai H., 2011, PASJapan, 63, 513
- [45] MacLeod G.C., van der Walt D.J., North A., Gaylard M.J., Galt J.A., Moriarty-Schieven G.H., 1998, AJ, 116, 2936
- [46] Minier V., Conway J.E., Booth R.S., 2001, A&A., 369, 278
- [47] Motogi K., Sorai K., Habe A., Honma M., Kobayashi H., Sato K., 2011a, PASJapan, 63, 31
- [48] Motogi K. et al., 2011b, MNRAS, 417, 238
- [49] Motogi K., Sorai K., Niinuma K., Sugiyama K., Honma M., Fujisawa K., 2012, MNRAS, in press
- [50] Pandian J.D., Menten K.M., Goldsmith P.F., 2009, ApJ, 706, 1609
- [51] Pestalozzi M.R., Minier V., Booth R.S., 2005, A&A, 432, 737
- [52] Ren Z., Wu Y., Zhu M., Liu T., Peng R., Qin S., 2012, MNRAS, 422, 1098
- [53] Robinson B.J., Goss W.M., Manchester R.N., 1970, Austral.J.Phys., 23, 363
- [54] Sevenster M.N., van Langevelde H.J., Moody R.A., Chapman J.M., Habing H.J., Killeen N.E.B., 2001, A&A, 366, 481
- [55] Stark D.P., Goss W.M., Churchwell E., Fish V.L., Hoffmann I.M., 2007, ApJ, 656, 943
- [56] Szymczak M., Gerard E., 2009, A&A, 494, 117
- [57] Szymczak M., Bartkiewicz A., Richards A.M.S., 2007, A&A, 468, 617
- [58] Walsh A.J., Burton M.G., Hyland A.R., Robinson G., 1998, MNRAS, 301, 640
- [59] Wilson W.E. et al., 2011, MNRAS, 416, 832
- [60] Wright M.M., Gray M.D., Diamond P.J., 2004a, MNRAS, 350, 1253
- [61] Wright M.M., Gray M.D., Diamond P.J., 2004b, MNRAS, 350, 1272
- [62] Zhang B., Zheng X. W., Reid M. J., Menten K. M., Xu Y., Moscadelli L., Brunthaler A., 2009, ApJ, 693, 419
- [63] Zijlstra A.A., Pottasch S.R., Engels D., Roelfsema P.R., Hekkert P te L., Umana G., 1990, MNRAS, 246, 217