Physical properties of EuPd2As2 single crystals
Abstract
The physical properties of self-flux grown single crystals have been investigated by magnetization , magnetic susceptibility , specific heat , and electrical resistivity measurements versus temperature and magnetic field . The crystal structure was determined by powder x-ray diffraction measurements, which confirmed the -type body-centered tetragonal structure (space group ) reported previously. The data indicate that state of is metallic. Long-range antiferromagnetic (AFM) ordering is apparent from the , , and measurements. For the indicates two transitions at K and K, whereas for only one transition is observed at K. Between and the anisotropic data suggest a planar noncollinear AFM structure, whereas at the and data suggest a spin reorientation transition in which equal numbers of spins cant in opposite directions out of the plane. We estimate the critical field at 2 K at which all Eu moments become aligned with the field to be about 22 T. The magnetic entropy at 25 K estimated from the measurements is about 11% smaller than expected, possibly due to an inaccuracy in the lattice heat capacity contribution. An upturn in at suggests superzone energy gap formation below . This behavior of is not sensitive to applied magnetic fields up to T.
pacs:
74.70.Xa, 75.50.Ee, 65.40.Ba, 72.15.EbI INTRODUCTION
The observation of high-temperature superconductivity upon suppression of magnetic long-range antiferromagnetic (AFM) spin density wave (SDW) ordering in iron arsenides such as K-doped Fe2As2 ( = Ba, Ca, Sr) with the body-centered-tetragonal -type structure (space group ) stimulated great interest in these materials. Rotter2008a ; Chen2008a ; Sasmal2008 ; Sefat2008 ; Torikachvili2008 ; Ishida2009 ; Alireza2009 ; Johnston2010 ; Canfield2010 ; Mandrus2010 ; Stewart2011 The introduction of local moments at the sites leads to coexistence of both intinerant and localized magnetic moments in the magnetically ordered state. EuFe2As2 is a very nice example of this. While the itinerant carriers undergo an SDW transition at 190 K with the ordered moments concentrated near the Fe+2 cation sites, the localized Eu+2 moments with spin order antiferromagnetically below 19 K. Ren2008 ; Jiang2009c ; Xiao2009 The Eu sublattice has an A-type AFM structure where the ordered Eu+2 moments in the plane are aligned ferromagnetically and are aligned antiferromagnetically along the axis. Xiao2009 Similar to (Ba,Ca,Sr)Fe2As2, EuFe2As2 also exhibits superconductivity after the complete suppression of the itinerant SDW transition with as high as 33 K for Eu0.5K0.5Fe2As2. Jeevan2008 ; Ren2009a ; Miclea2009 ; Jiang2009b ; Jeevan2011 ; Anupam2011 ; Anupam2012 In addition, the presence of Eu moments provides an opportunity to explore the interplay and coexistence of long-range AFM order of the Eu spins and superconductivity in EuFe2As2 under pressure. Kurita2011
Other compounds with Eu occupying the site of the -type structure have been studied. orders ferromagnetically at K with the Eu+2 ordered moments canted at an angle of 17∘ from the axis and presents a dense Kondo behavior. Feng2010 ; Ryan2012 has an AFM structure below K with the Eu+2 ordered moments aligned ferromagnetically in the plane, forming an incommensurate AFM spiral structure along the axis. Reehuis1992 In , the magnetic ordering of Eu+2 is suppressed under pressure with a simultaneous magnetic ordering of itinerant carriers at K with the ordered moments centered on the Co sites at a critical pressure pc = 3.1 GPa, where a pressure-induced isostructural phase transition from a tetragonal (T) phase to collapsed tetragonal (cT) phase also occurs. Huhnt1997 ; Chefki1998 is reported to exhibit AFM ordering below 39 K for which an A-type AFM structure is proposed. Ballinger2012 also exhibits a pressure-induced isostructural phase transition from the T phase to cT phase at 4.7 GPa. Bishop2010 is found to order antiferromagnetically below K. Sengupta2005 A strong increase is observed in the ordering temperature of from 15 K at ambient pressure to 49 K at 10.7 GPa with a possible crossover from AFM structure to a ferromagnetic (FM) structure above 7 T. Sengupta2012 Our investigations on single crystal with the -type structure and with the different primitive tetragonal -type structure revealed AFM ordering of the Eu+2 moments in both compounds below K and 5.1 K, respectively. Anand2014a While the data suggest that has an A-type AFM structure, the AFM structure of is unclear as yet. Anand2014a
We previously investigated the physical properties of with the primitive tetragonal -type structure, which is closely related to the -type structure. Das2010 This compound shows AFM ordering of the Eu spins at K with another AFM transition at K that may be a spin-reorientation transition. From single-crystal measurements, the compound appears to have a noncollinear AFM structure. We also studied ( = Ca, Sr, and Ba) with the -type structure and discovered bulk superconductivity in and below and 0.92 K, respectively. Anand2013a
also crystallizes in the -type structure. Hofmann1985 A preliminary investigation of the magnetic properties of using and Mössbauer measurements revealed AFM ordering of the Eu moments in a polycrystalline sample below K. Raffius1993 We have grown single crystals of by the self-flux method and present herein their physical properties obtained from magnetic susceptibility , isothermal magnetization , heat capacity and electrical resistivity measurements as a function of temperature and magnetic field .
We confirm the presence of Eu+2 magnetic moments with and spectroscopic splitting factor and AFM ordering of these spins below K as found in Ref. Raffius1993, . We report an additional transition at 5.5 K that is likely due to an AFM spin reorientation transition. The measured in low exhibits two transitions at K and K for , and one transition at K for . The at 2 K up to T shows a weak upward curvature, consistent with an AFM structure. The data show a sharp -type anomaly at , whereas the anomaly at is weaker. The data demonstrate that is metallic and the data show anomalies at both and . The exhibits a sharp upturn below possibly due to the formation of a superzone energy gap over part of the Brillouin zone at . No change in the upturn in is evident under applied magnetic fields up to T. In the paramagnetic state above 16 K the data are well represented by the Debye model of lattice heat capacity and the data by the Bloch-Grüneisen model for the contribution to from electron-phonon scattering.
II EXPERIMENTAL DETAILS
Single crystals of were grown by the high-temperature solution growth method using self-flux. High-purity Eu (Ames Laboratory) and prereacted PdAs [Pd (99.998%) and As (99.99999%), Alfa Aesar] taken in a 1:5 molar ratio were placed in an alumina crucible and sealed inside an evacuated quartz tube. The sealed sample was heated to 1100 ∘C at a rate of 60 ∘C/h and held there for 15 h, followed by cooling at a rate of 2.5 ∘C/h to 800 ∘C at which point the flux was decanted with a centrifuge, yielding shiny plate-like crystals of typical size mm3.
The chemical composition and quality of the crystals were checked using a JEOL scanning electron microscope (SEM) equipped with an energy dispersive x-ray (EDX) analyzer. The SEM images indicated from the uniformity of the (001) plane faces that the crystals contain only a single phase. The EDX composition analysis confirmed the desired stoichiometry of the crystals with Eu:Pd:As in a 1 : 2 : 2 molar ratio. The crystal structure was determined by powder x-ray diffraction (XRD) using Cu Kα radiation on a Rigaku Geigerflex x-ray Diffractometer. The XRD data were refined by Rietveld refinement using the FullProf software package. Rodriguez1993
The and isotherms were measured using a Quantum Design, Inc., superconducting quantum interference device (SQUID) magnetic properties measurement system (MPMS). isotherms at high magnetic field were measured using the vibrating sample magnetometer (VSM) option of a Quantum Design, Inc., physical properties measurement system (PPMS). The sample holder contributions to the measured magnetic moments were subtracted to obtain the sample contributions. The magnetic properties are expressed exclusively in Gaussian cgs units, where the Tesla (T) is a common unit of convenience for the magnetic field defined as 1 T = Oe. The was measured by a relaxation method using the heat capacity option of the PPMS. The was measured by the standard four-probe ac technique using the ac transport option of the PPMS.
III Results and Discussion
III.1 Crystallography
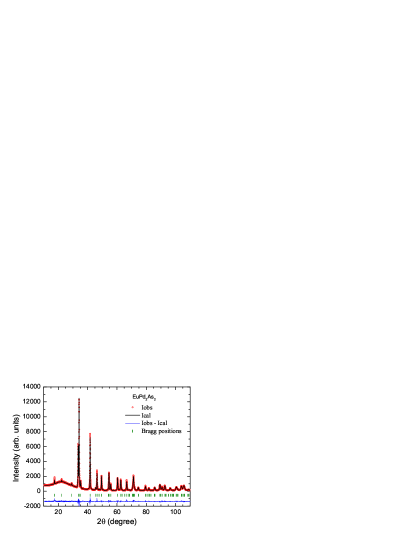
Powder x-ray diffraction data collected on crushed single crystals at room temperature are shown in Fig. 1 together with the Rietveld refinement profile. The refinement confirmed the -type body-centered tetragonal structure (space group ) of and showed no impurity peaks. While refining, the thermal parameters and the fractional occupancies were fixed to unity. Small variations in ( Å2) and in the occupancies of atomic positions (%) had no noticeable effect on the quality of fit or on the refined lattice parameters and . The crystallographic parameters are listed in Table 1. The lattice parameters are in good agreement with the literature values. Hofmann1985 The interlayer As–As distance Å and are close to values typical for collapsed tetragonal compounds as discussed in Ref. Anand2012a, , indicating that has a collapsed tetragonal structure.
| Lattice parameters | |
|---|---|
| (Å) | 4.3298(2) |
| (Å) | 10.1700(3) |
| (Å3) | 190.66(1) |
| As axis coordinate | 0.3772(2) |
| Refinement quality | |
| 3.09 | |
| (%) | 5.33 |
| (%) | 7.46 |
III.2 Magnetization and Magnetic Susceptibility
III.2.1 High-Temperature Paramagnetic Susceptibility
| Field | |||||
|---|---|---|---|---|---|
| direction | (K) | (K) | (cm3 K/mol) | (K) | (/Eu) |
| 11.0 | 5.5 | 7.73(3) | 32.8(9) | 7.86(2) | |
| 11.0 | 7.71(2) | 28.1(3) | 7.85(1) |
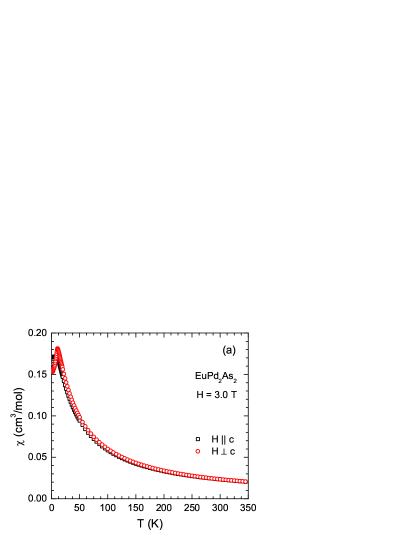
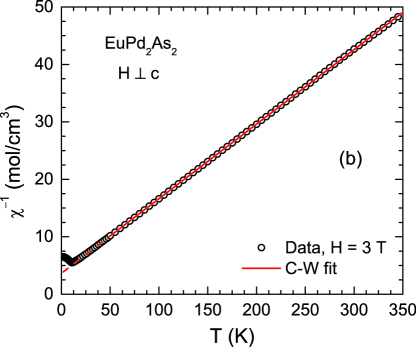
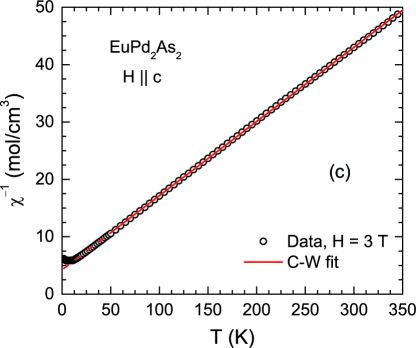
The data measured for in T for and up to 350 K are shown in Fig. 2(a). The data are nearly isotropic on the scale of the figure. An AFM transition is seen at low temperatures K [see also Fig. 3(a) below and Table 2]. The data in the paramagnetic state follow the Curie-Weiss law , where is Curie constant and is the Weiss temperature. The versus data for and are shown in Figs. 2(b) and 2(c), respectively. Linear fits of these two sets of data by the inverse Curie-Weiss law for 50 K 350 K are shown as straight lines in the respective figures. The fits yield cm3 K/mol and K for and cm3 K/mol and K for . The negative values indicate that the dominant magnetic interactions in are AFM. The Curie constant calculated for Eu+2 cations with and spectroscopic splitting factor is cm3 K/mol Eu, which is very close to the measured values. We conclude that the Eu in is in the +2 oxidation state with and . The parameters obtained from the Curie-Weiss fits of the data are summarized in Table 2.
III.2.2 Low-Temperature Magnetic Susceptibility
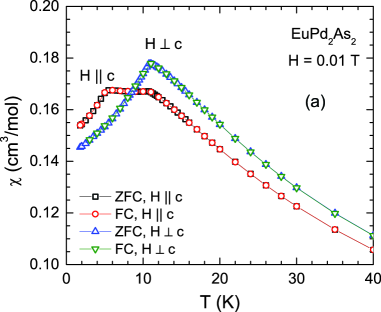
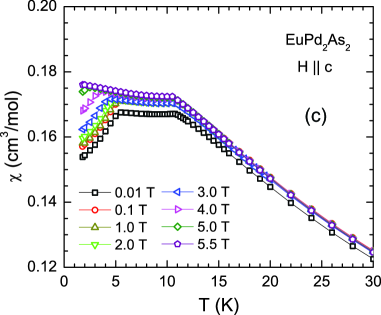
The zero-field-cooled (ZFC) and field-cooled (FC) of an single crystal versus measured at T aligned along the axis () and in the plane () are shown in Fig. 3(a). No thermal hysteresis between the ZFC and FC data is observed. For , well-defined cusps are seen in the low-field data at 11.0 K and 5.5 K whereas for only one cusp is observed at 11.0 K. Furthermore, the data measured at different in Figs. 3(b) and 3(c) show that an increase in shifts these anomalies towards lower temperatures suggesting that the cusps are due to AFM ordering. We infer that two zero-field AFM transitions occur at K and K. While is due to a transition from paramagnetic phase to an AFM phase, may be associated with an AFM spin reorientation transition.
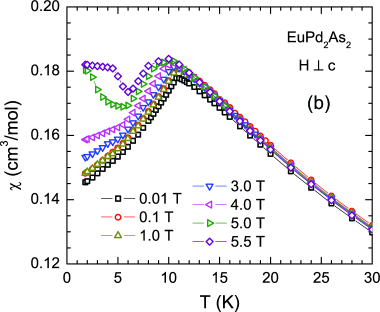
For only a barely detectable change in slope is observed near K in the data at T in Fig. 3(a). However, as shown in Fig. 3(b), as increases the slope change becomes clearly observable, and at T a well-defined anomaly can be seen in at the same temperature 5.5 K. Thus shows no detectable field dependence within our field range for . In contrast, for decreases significantly from 11.0 K at T to K at T.
From the data in Fig. 3(c) with , both and decrease with increasing . The decreases from 11.0 K at T to 10.5 K at T and decreases from 5.5 K at T to K at T. Thus the change in with increasing is much larger than the change in discussed in the previous paragraph for .
The low-field data in Fig. 3(a) are temperature-independent between and , whereas the data decrease rapidly below . Within the Weiss molecular field theory (MFT), this difference indicates that the AFM ordered moments lie in the tetragonal plane. Johnston2011a The observation that at and at K suggests the presence of a small anisotropy field parallel to the plane both above and below . On the other hand, for a collinear AFM structure with the ordered moments in the plane and equal numbers of AFM domains with their collinear axes at 90∘ to each other, one expects , which is not realized in the data which show . This large deviation from expectation for collinear AFM ordering suggests that the AFM structure of between and is a noncollinear planar helical or cycloidal structure with the ordered moments aligned in the plane. The turn angle in MFT is a two-valued function of if . With the observed value , one obtains a turn angle of either or 139∘ along the helix/cycloid axis between ferromagnetically aligned planes perpendicular to this axis. Johnston2012 Our measurements cannot distinguish between the helical and cycloidal types of noncollinear AFM plane ordering. In helical ordering, the spin rotation (helix) axis is along the axis, whereas for cycloidal ordering, the spin rotation (cycloid) axis is in the plane.
The decrease in at in Fig. 3(a) suggests that the in-plane moments become canted towards the axis in such a way as to retain the overall AFM structure, such as in a sequence of canted-up/canted-down spins out of the plane. Furthermore, the ordered-state data presented in the following section exhibit upward curvature for both and , consistent with this canted AFM structure below .
III.2.3 Magnetization versus Applied Magnetic Field Isotherms
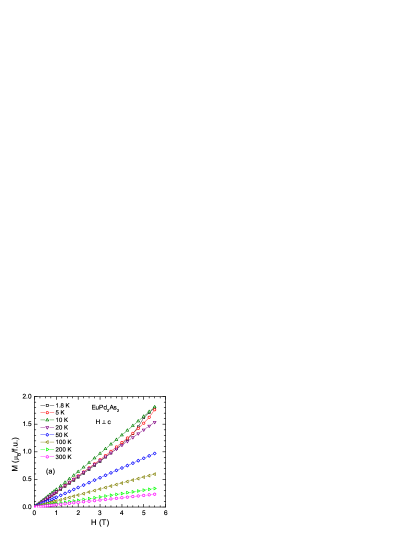
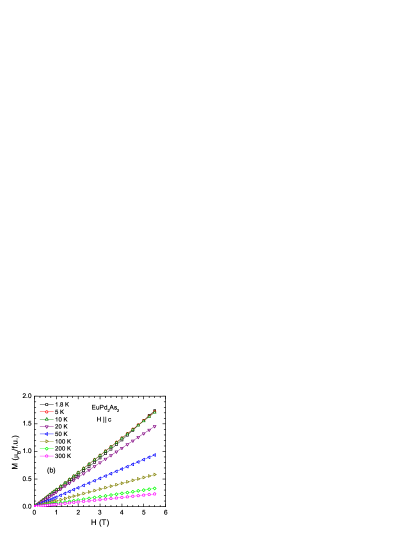
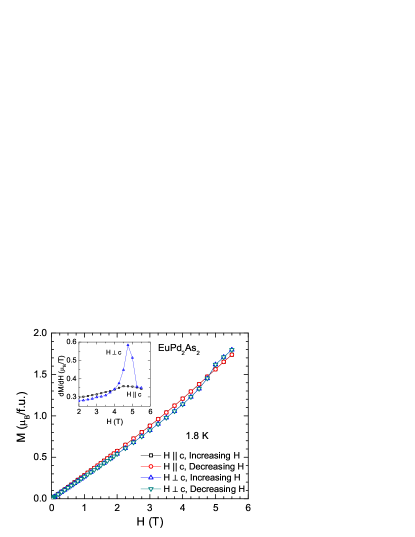
Isothermal data for an crystal at eight temperatures between 1.8 and 300 K for applied both along the axis () and in the plane () are shown in Fig. 4 and data at 1.8 K for both increasing and decreasing are shown in Fig. 5, where T in both figures. The magnetization does not show saturation behavior up to T for either field direction. It is seen from Fig. 5 that at 1.8 K initially the exhibits almost a linear dependence for T above which an upward curvature is seen for both and without any hysteresis between increasing and decreasing . The resembles a weak -shaped metamagnetic behavior. The derivative shown in the inset of Fig. 5 clearly reflects this behavior, where a pronounced peak is observed at T for . The weak change in slope for is also evident from a broad peak near 4.5 T in . The observed magnetizations /Eu and /Eu at T for and , respectively, are much smaller than the theoretical value /Eu for and . Figure 4 shows that similar behaviors are observed for and at K as at 1.8 K. For the is almost proportional to at fixed .
Within MFT, the critical field of an AFM, which is the field at which reaches with increasing , is given by
| (1) |
From Fig. 3(a), for one has /Oe Eu. Then using /Eu, Eq. (1) gives the calculated critical field as
| (2) |
This value is a factor of four larger than our maximum measurement field of 5.5 T in Figs. 4 and 5.
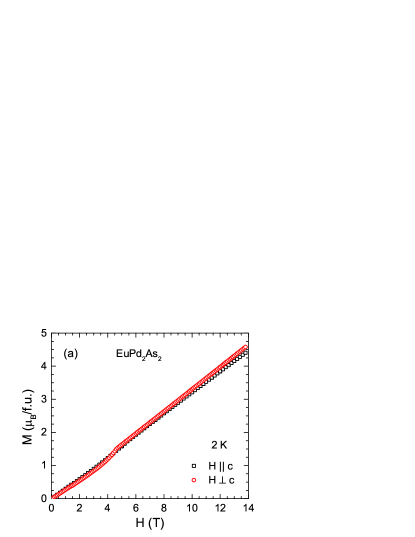
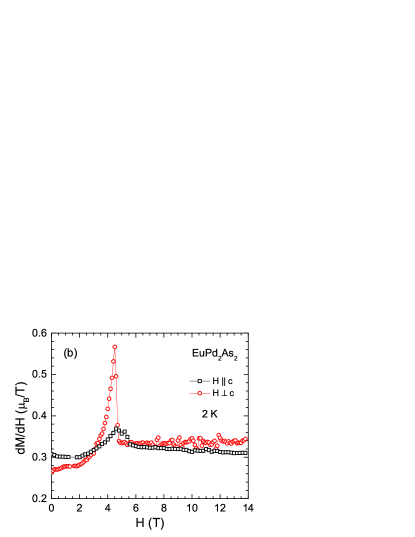
Because at T is much smaller than the theoretical , we measured up to the higher field T as shown at K in Fig. 6(a). These data demonstrate that does not reach up to fields of 13.8 T, as expected from Eq. (2). At K and T, we find /Eu for and /Eu for which are % of the theoretical value. The data for both field directions show metamagnetic transitions at T, confirming the data in Fig. 5. The derivatives and versus are shown in Fig. 6(b) which reflect the weak metamagnetic transitions near 4.5 T and 4.6 T for and , respectively. Within MFT, a spin flop transition only occurs for a collinear AFM structure if the field is aligned parallel to the ordering axis. The fact that metamagnetic transitions are observed for both and supports our hypothesis above that the magnetic structure below is both noncollinear and noncoplanar.
The high-field slopes of and in Fig. 6 obtained from proportional fits of versus for the field range 6.0 T T are /T Eu and /T Eu, respectively. By extrapolating the proportional dependence of to the value /Eu, one obtains the extrapolated value of the critical field as
| (3) |
for . This value is nearly the same as the above value of in Eq. (2) estimated from using MFT.
III.3 Heat Capacity
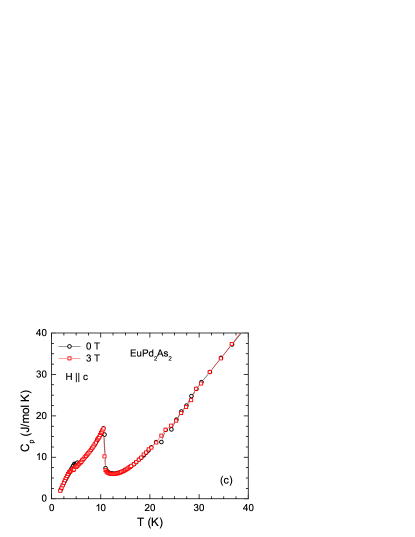
An overview of the data of an crystal are shown in Fig. 7(a). The low- data obtained in are shown on an expanded scale in Fig. 7(b) and exhibit two clear anomalies near 5.5 K and 11 K, confirming the intrinsic nature of the AFM transitions at and revealed in the above data. The data measured at T () are compared with the data for in Fig. 7(c). While no noticeable change is observed at between the at these two fields, the anomaly appears to broaden slightly with increasing field and to decrease slightly in temperature at T compared to the zero-field data. The weak field dependence in this field range is expected due to the much larger calculated and extrapolated critical fields in Eqs. (2) and (3), respectively.
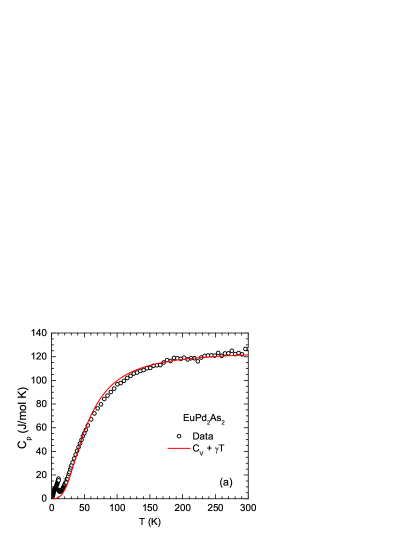
The zero-field J/mol K is close to the expected classical Dulong-Petit value J/mol K at constant volume, Kittel2005 ; Gopal1966 where is the number of atoms per formula unit (f.u.) and is the molar gas constant. The data in the paramagnetic regime from 16 to 300 K were initially fitted by
| (4) |
where represents the electronic contribution to the heat capacity and represents the Debye lattice heat capacity due to acoustic phonons at constant volume given by Gopal1966
| (5) |
Here we used the recently developed analytic Padé approximant fitting function for . Goetsch2012 While fitting the data we first set as an adjustable parameter which yielded mJ/mol K2, so in the final fit we fixed . Thus in the final fit, the data were fitted with only one adjustable parameter . The fit with 16 K K gives K. From a comparison of the data and the fit in Fig. 7(a) shown by the solid red curve, the data in the paramagnetic state from 16 K up to 300 K are described reasonably well overall by the Debye model for the lattice heat capacity.
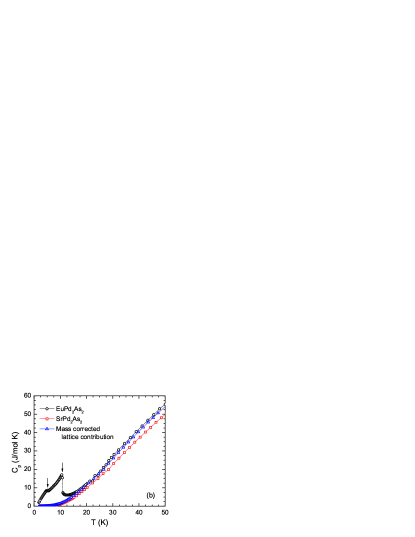
The magnetic contribution to the heat capacity is estimated from the zero-field data of by subtracting the lattice contribution. As the lattice contribution we used the data of isostructural nonmagnetic . Anand2013a The difference in formula weights of and was taken into account to estimate the lattice contribution to the heat capacity of . Since the lattice heat capacity is a function of and depends on formula mass (), the mass-corrected lattice contribution can be obtained by changing the temperature scale of to , where
| (6) |
The mass-corrected lattice contribution for is shown in Fig. 7(b).
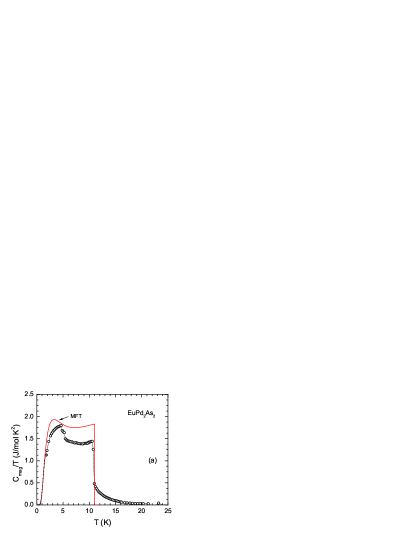
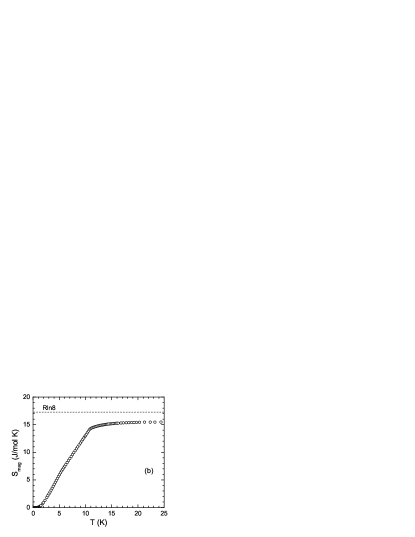
The of is obtained by subtracting the lattice contribution of from the measured data of as shown in the plot of versus in Fig. 8(a). Clear anomalies in near K and K are apparent. The nonzero at in Fig. 8(a) indicates the presence of short-range AFM correlations above . The MFT prediction of for spin and K is shown as the solid red curve in Fig. 8(a). Johnston2011a The magnetic entropy is the area under a versus plot. It is seen that the missing experimental magnetic entropy at compared with the MFT prediction is largely recovered at where AFM correlations in the paramagnetic state contribute to the change in magnetic entropy.
In order to estimate for 0 K which is below our measurement temperature range, we extrapolated the data to in accordance with the MFT prediction as shown by the dotted curve in Fig. 8(a). The magnetic contribution to the entropy below 25 K was then determined by integrating the versus data in Fig. 8(a) according to
| (7) |
as shown in Fig. 8(b). It is seen from Fig. 8(b) that attains a value of 14.7 J/mol K at which is 85% of the expected high- limit J/mol K for . The estimated experimental high- limit of is 89 % of . In view of the magnetization data which indicated that the Eu is in the Eu+2 oxidation state with to high accuracy, the reduced value of compared with likely results from an inaccurate estimate of the lattice contribution used to obtain from the measured data.
III.4 Electrical Resistivity
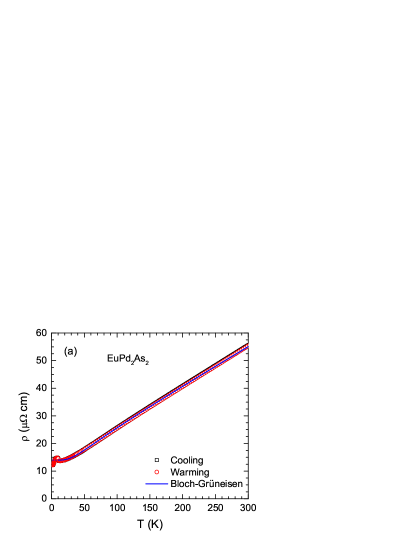
The -plane data of a crystal measured in zero magnetic field are shown in Fig. 9. The low value of residual resistivity at K and the value of residual resistivity ratio indicate a good quality of our single crystals. Metallic behavior is indicated from both the magnitude and dependence of .
We fitted our paramagnetic-state zero-field data by the Bloch-Grüneisen (BG) model. The BG resistivity due to the scattering of conduction electrons by acoustic lattice vibration is given by Blatt1968
| (8) |
where is a material-dependent prefactor and is the Debye temperature determined from resistivity data. One obtains
| (9) |
The experimental data were fitted by
| (10) |
where is the sum of and the spin-disorder resistivity due to the presence of disordered magnetic moments, and the normalized dimensionless BG resistivity can be obtained from Eqs. (8) and (9) as
We fitted the data by Eqs. (10) and (III.4) using the three independent fitting parameters , and for 12 K 300 K where we used the analytic Padé approximant fitting function from Ref. Goetsch2012, for in Eq. (III.4). A good fit of the data was obtained with the fitting parameters cm, cm, and K, as shown by the solid blue curve in Fig. 9(a). The value cm is obtained from the value of using Eq. (9) and cm is obtained from the value of using value cm. The value K is somewhat smaller than K obtained from the above analysis of the heat capacity data in the paramagnetic state in terms of the Debye model. The values of and are not expected to be identical because of the different assumptions and approximations made in the Debye model of the lattice heat capacity and the Bloch-Grüneisen model of the resistivity as outlined in Refs. Gopal1966, ; Goetsch2012, ; Blatt1968, .
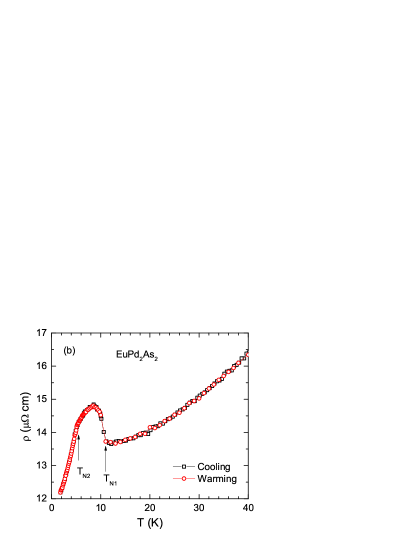
From Fig. 9(b), decreases with decreasing temperature in the paramagnetic state at but then sharply increases at , reaches a maximum at K and again starts decreasing with decreasing for K with a rapid decrease below . We define the quantity to be the difference in between its value at the maximum of the peak and the value at . Below about 4 K the resistivity is lower than the value extrapolated from above . No thermal hysteresis is observed between the heating and cooling cycles of measurements. The increase in on decreasing below an AFM transition temperature has been observed in many systems and is usually attributed to the formation of superzone energy gaps within the Brillouin zone. Takabatake1998 ; Budko2000 ; Mun2010 ; Das2012 ; Pandey2009 ; Elliott1963 ; Elliott1964 ; Ellerby1998
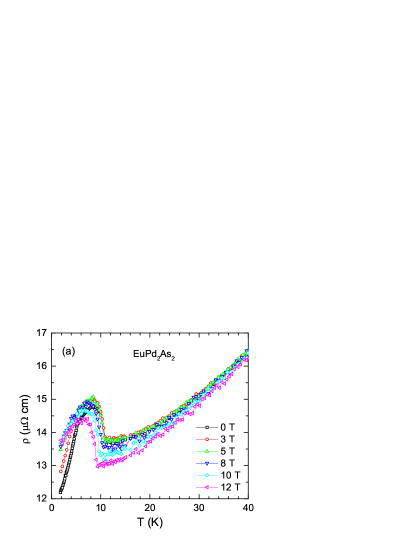
The data measured at different are shown in Fig. 10(a). We do not see any significant effect of magnetic field on below even at T. However, this field is still much smaller than the critical field estimated in Eqs. (2) and (3). As expected for an AFM system, decreases with increasing and in the paramagnetic state in the vicinity of decreases with increasing which shows a negative magnetoresistance (MR) behavior. For initially the increases weakly and then decreases with increasing , although the change upon entering the antiferromagnetic state remains nearly unchanged. Thus there is no signature of suppression of the effect of magnetic superzone formation up to the maximum measurement field of 12 T. For the increases with increasing and thus a positive MR is observed.
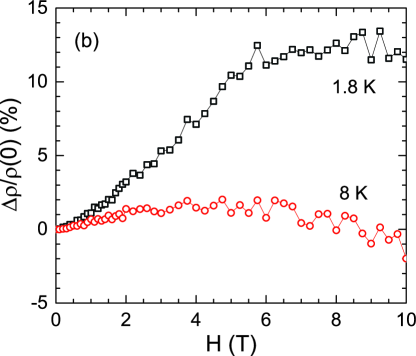
The dependence of is shown in Fig. 10(b) for 1.8 K and 8 K. The data are normalized as to show the magnetoresistance behavior. The MR data are noisy but the basic trend of data can be inferred. At 1.8 K, initially the MR increases with increasing up to T above which the rate of increase decreases and eventually MR approaches a constant value. The MR is positive throughout and is % at 10 T at 1.8 K. At 8 K the MR is weakly positive for T above which it becomes negative as was also inferred from the data measured at different shown in Fig. 10(a). Because of the noise in the data it is not possible to determine the precise field at which this crossover from positive MR to negative MR takes place.
Usually superzone boundaries collapse with the application of a magnetic field and the effect of a superzone energy gap is suppressed. Contrary to this expectation, in the present compound the effect of the superzone energy gap persists up to the maximum investigated field of 12 T without any sign of a collapse of the superzone boundaries. A similar insensitiveness of the superzone gap to an external field has been observed in GdPd3B0.5C0.5 where no change in the resistivity upturn behavior was noticed at 7 T. Pandey2009 In the case of GdPd3B0.5C0.5 it was argued that the strength of the magnetic coupling between the moments is strong enough to prevent an effect of the external field. A similar situation may hold for the present compound because our maximum measurement field is roughly a factor of two smaller than the critical field.
IV Summary and Conclusions
The physical properties of single crystals were investigated using , , and measurements. The data indicate metallic behavior. The high- data follow the Curie-Weiss law with a Curie constant consistent with Eu+2 spins with and Weiss temperature K indicative of dominant AFM interactions. The data from 16 to 300 K are fitted well by the Debye theory of lattice heat capacity, yielding a Debye temperature K. The data from 12 to 300 K agree with the Bloch-Grüneisen model of the resisitivity arising from electron-phonon scattering, where the fitted Debye temperature is K, somewhat smaller than the value obtained from analyzing the data.
At lower , the data indicate long-range AFM ordering at K with another transition at K that is likely a spin reorientation transition. The anisotropic data for suggest a planar noncollinear AFM structure with the ordered moments aligned within the plane, consistent with a helical or cycloidal magnetic structure with a turn angle of or between adjacent layers of ferromagnetically-aligned spins. The anisotropic and isotherm data suggest that the AFM structure at becomes noncoplanar, with equal numbers of spins canting in opposite directions out of the plane, thus preserving an overall AFM structure. The isotherm measurements for and up to T at K both show weak metamagnetic transitions at T. Two estimates indicate that the critical field at which all Eu spins become aligned with the field with increasing field at 2 K is T, which is about 60% larger than our maximum measurement field of 14 T.
The and measurements show anomalies at both and . Although decreases monotonically on cooling from 300 K to 10 K, it increases with decreasing below , suggesting that part of the Fermi surface becomes gapped due to the AFM ordering, and then decreases again below 9.0 K. The shows a 12% positive magnetoresistance at K and T, but the size of the upturn below is not affected by fields up to 12 T.
Acknowledgements.
The research at Ames Laboratory was supported by the U.S. Department of Energy, Office of Basic Energy Sciences, Division of Materials Sciences and Engineering. Ames Laboratory is operated for the U.S. Department of Energy by Iowa State University under Contract No. DE-AC02-07CH11358.References
- (1) M. Rotter, M. Tegel, and D. Johrendt, Phys. Rev. Lett. 101, 107006 (2008).
- (2) G. F. Chen, Z. Li, G. Li, W.-Z. Hu, J. Dong, J. Zhou, X.-D. Zhang, P. Zheng, N.-L. Wang, and J.-L. Luo, Chin. Phys. Lett. 25, 3403 (2008).
- (3) K. Sasmal, B. Lv, B. Lorenz, A. M. Guloy, F. Chen, Y.-Y. Xue, and C. W. Chu, Phys. Rev. Lett. 101, 107007 (2008).
- (4) A. S. Sefat, R. Jin, M. A. McGuire, B. C. Sales, D. J. Singh, and D. Mandrus, Phys. Rev. Lett. 101, 117004 (2008).
- (5) M. S. Torikachvili, S. L. Bud’ko, N. Ni, and P. C. Canfield, Phys. Rev. Lett. 101, 057006 (2008).
- (6) K. Ishida, Y. Nakai, and H. Hosono, J. Phys. Soc. Jpn. 78, 062001 (2009).
- (7) P. L. Alireza, Y. T. C. Ko, J. Gillett, C. M. Petrone, J. M. Cole, G. G. Lonzarich and S. E. Sebastian, J. Phys.: Condens. Matter 21, 012208 (2009).
- (8) D. C. Johnston, Adv. Phys. 59, 803 (2010).
- (9) P. C. Canfield and S. L. Bud’ko, Annu. Rev. Condens. Matter Phys. 1, 27 (2010).
- (10) D. Mandrus, A. S. Sefat, M. A. McGuire, and B. C. Sales, Chem. Mater. 22, 715 (2010).
- (11) G. R. Stewart, Rev. Mod. Phys. 83, 1589 (2011).
- (12) Z. Ren, Z. W. Zhu, S. A. Jiang, X. F. Xu, Q. Tao, C. Wang, C. M. Feng, G. H. Cao, and Z. A. Xu, Phys. Rev. B 78, 052501 (2008).
- (13) Y. Xiao, Y. Su, M. Meven, R. Mittal, C. M. N. Kumar, T. Chatterji, S. Price, J. Persson, N. Kumar, S. K. Dhar, A. Thamizhavel, and T. Brueckel, Phys. Rev. B 80, 174424 (2009).
- (14) S. Jiang, Y. Luo, Z. Ren, Z. Zhu, C. Wang, X. Xu, Q. Tao, G. Cao, and Z. Xu, New J. Phys. 11, 025007 (2009).
- (15) H. S. Jeevan, Z. Hossain, D. Kasinathan, H. Rosner, C. Geibel, and P. Gegenwart, Phys. Rev. B 78, 092406 (2008).
- (16) Z. Ren, Q. Tao, S. Jiang, C. Feng, C. Wang, J. Dai, G. Cao, and Z. Xu, Phys. Rev. Lett. 102, 137002 (2009).
- (17) C. F. Miclea, M. Nicklas, H. S. Jeevan, D. Kasinathan, Z. Hossain, H. Rosner, P. Gegenwart, C. Geibel, and F. Steglich, Phys. Rev. B 79, 212509 (2009).
- (18) S. Jiang, H. Xing, G. Xuan, Z. Ren, C. Wang, Z. Xu, and G. Cao, Phys. Rev. B 80, 184514 (2009).
- (19) H. S. Jeevan, D. Kasinathan, H. Rosner, and P. Gegenwart, Phys. Rev. B 83, 054511 (2011).
- (20) Anupam, P. L. Paulose, S. Ramakrishnan, and Z. Hossain, J. Phys.: Condens. Matter 23, 455702 (2011).
- (21) Anupam, V. K. Anand, P. L. Paulose, S. Ramakrishnan, C. Geibel, and Z. Hossain, Phys. Rev. B 85, 144513 (2012).
- (22) N. Kurita, M. Kimata, K. Kodama, A. Harada, M. Tomita, H. S. Suzuki, T. Matsumoto, K. Murata, S. Uji, and T. Terashima, Phys. Rev. B 83, 214513 (2011).
- (23) C. Feng, Z. Ren, S. Xu, S. Jiang, Z. Xu, G. Cao, I. Nowik, I. Felner, K. Matsubayashi, and Y. Uwatoko, Phys. Rev. B 82, 094426 (2010).
- (24) D. H. Ryan, J. M. Cadogan, S. Xu, Z. Xu, and G. Cao, Phys. Rev. B 83, 132403 (2011).
- (25) M. Reehuis, W. Jeitschko, M. Müller, and P. J. Brown, J. Phys. Chem. Solids 53, 687 (1992).
- (26) C. Huhnt, W. Schlabitz, A. Wurth, A. Mewis, and M. Reehuis, Phys. Rev. B 56, 13796 (1997).
- (27) M. Chefki, M. M. Abd-Elmeguid, H. Micklitz, C. Huhnt, W. Schlabitz, M. Reehuis, and W. Jeitschko, Phys. Rev. Lett. 80, 802 (1998).
- (28) J. Ballinger, L. E. Wenger, Y. K. Vohra, and A. S. Sefat, J. Appl. Phys. 111, 07E106 (2012).
- (29) M. Bishop, W. Uhoya, G. Tsoi, Y. K. Vohra, A. S. Sefat, and B. C. Sales, J. Phys.: Condens. Matter 22, 425701 (2010).
- (30) K. Sengupta, P. L. Paulose, E. V. Sampathkumaran, Th. Doert, and J. P. F. Jemetio, Phys. Rev. B 72, 184424 (2005).
- (31) K. Sengupta, M. Alzamora, M. B. Fontes, E. V. Sampathkumaran, S. M. Ramos, E. N. Hering, E. M. B. Saitovitch, P. L. Paulose, R. Ranganathan, T. Doert, and J. P. F. Jemetio, J. Phys.: Condens. Matter 24, 096004 (2012).
- (32) V. K. Anand et al. (unpublished).
- (33) S. Das, K. McFadden, Y. Singh, R. Nath, A. Ellern, and D. C. Johnston, Phys. Rev. B 81, 054425 (2010).
- (34) V. K. Anand, H. Kim, M. A. Tanatar, R. Prozorov, and D. C. Johnston, Phys. Rev. B 87, 224510 (2013).
- (35) W. K. Hofmann and W. Jeitschko, Monatsh. Chem. 116, 569 (1985).
- (36) H. Raffuis, E. Mörsen, B. D. Mosel, W. Müller-Warmuth, W. Jeitschko, L. Terbüchte, and T. Vomhof, J. Phys. Chem. Solids 54, 135 (1993).
- (37) J. Rodríguez-Carvajal, Physica B 192, 55 (1993); see also www.ill.eu/sites/fullprof/
- (38) V. K. Anand, P. K. Perera, A. Pandey, R. J. Goetsch, A. Kreyssig, and D. C. Johnston, Phys. Rev B 85, 214523 (2012).
- (39) D. C. Johnston, R. J. McQueeney, B. Lake, A. Honecker, M. E. Zhitomirsky, R. Nath, Y. Furukawa, V. P. Antropov, and Y. Singh, Phys. Rev. B 84, 094445 (2011).
- (40) D. C. Johnston, Phys. Rev. Lett. 109, 077201 (2012).
- (41) C. Kittel, Introduction to Solid State Physics, 8th edition (Wiley, New York, 2005).
- (42) E. S. R. Gopal, Specific Heats at Low Temperatures (Plenum, New York, 1966).
- (43) R. J. Goetsch, V. K. Anand, A. Pandey, and D. C. Johnston, Phys. Rev. B 85, 054517 (2012).
- (44) F. J. Blatt, Physics of Electronic Conduction in Solids (McGraw-Hill, New York, 1968).
- (45) T. Takabatake, M. Shirase, K. Katoh, Y. Echizen, K. Sugiyama, T. Osakabe, J. Magn. Magn. Mater. 177–181, 53 (1998).
- (46) S. L. Bud’ko and P. C. Canfield, Phys. Rev. B 61, R14932 (2000).
- (47) E. D. Mun, S. L. Bud’ko, H. Ko, G. J. Miller, and P. C. Canfield, J. Magn. Magn. Mater. 322, 3527 (2010).
- (48) P. K. Das, N. Kumar, R. Kulkarni, S. K. Dhar, and A. Thamizhavel, J. Phys.: Condens. Matter 24, 146003 (2012).
- (49) A. Pandey, C. Mazumdar, R. Ranganathan, and S. Dattagupta, J. Magn. Magn. Mater. 321, 2311 (2009).
- (50) R. J. Elliott and F. A. Wedgwood, Proc. Phys. Soc. 81, 846 (1963).
- (51) R. J. Elliott and F. A. Wedgwood, Proc. Phys. Soc. 84, 63 (1964).
- (52) M. Ellerby, K. A. McEwen, and J. Jensen, Phys. Rev. B 57, 8416 (1998).