Anharmonic lattice dynamics of Ag2O studied by inelastic neutron scattering and first principles molecular dynamics simulations
Abstract
Inelastic neutron scattering measurements on silver oxide (Ag2O) with the cuprite structure were performed at temperatures from 40 to 400 K, and Fourier transform far-infrared spectra were measured from 100 to 300 K. The measured phonon densities of states and the infrared spectra showed unusually large energy shifts with temperature, and large linewidth broadenings. First principles molecular dynamics (MD) calculations were performed at various temperatures, successfully accounting for the negative thermal expansion (NTE) and local dynamics. Using the Fourier-transformed velocity autocorrelation method, the MD calculations reproduced the large anharmonic effects of Ag2O, and were in excellent agreement with the neutron scattering data. The quasiharmonic approximation (QHA) was less successful in accounting for much of the phonon behavior. The QHA could account for some of the NTE below 250 K, although not at higher temperatures. Strong anharmonic effects were found for both phonons and for the NTE. The lifetime broadenings of Ag2O were explained by anharmonic perturbation theory, which showed rich interactions between the Ag-dominated modes and the O-dominated modes in both up- and down-conversion processes.
I Introduction
Silver oxide (Ag2O) with the cuprite structure has attracted much interest after the discovery of its extraordinarily large negative thermal expansion (NTE),Tiano et al. (2003); Kennedy et al. (2005) which exceeds K-1 and occurs over a wide range of temperature from 40 K to its decomposition temperature near 500 K. Besides its large NTE, Ag2O is commonly used as a modifier in fast-ion conducting glasses and batteries, Bhattacharya and Ghosh (2003); Minami (1983) and its catalytic properties are also of interest. Li et al. (2003); Gou and Murphy (2003)
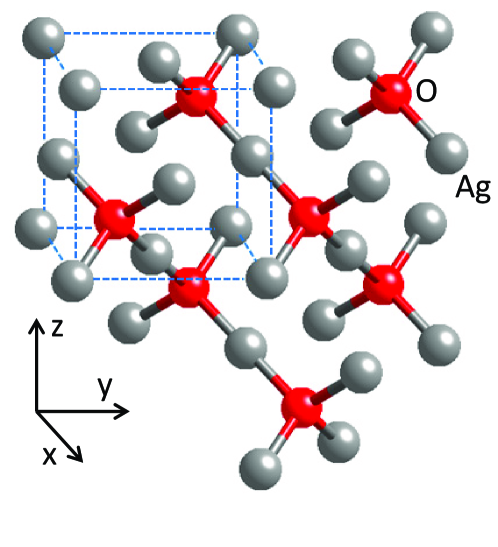
In the cuprite structure of Ag2O shown in Fig. 1, the fcc Ag lattice is expanded by the presence of the O atoms, which form an interpenetrating bcc lattice. The O atoms occupy two tetrahedral sites of the standard fcc unit cell of Ag atoms. Each O atom is linked to four O atoms through a bridging Ag atom, placing the Ag atoms in linear O-Ag-O links with little transverse constraint. A geometrical model of NTE considers tetrahedra of Ag4O around each O atom that bend at the Ag atoms linking the O atoms in adjacent tetrahedra. Rigid-unit modes (RUMs) account for counteracting rotations of all such tetrahedra. Pryde et al. (1996); Heine et al. (1999) These RUMs tend to have low frequencies owing to the large mass of the unit, and hence are excited at low temperatures. Locally, the O-Ag bond length does not contract, but bending of the O-Ag-O links pulls the O atoms together, leading to NTE. This model correlates the NTE and lattice dynamics. Similar models seem to explain the large NTE of ZrW2O8 and other systems.
The RUM model has value even if the Ag4O tetrahedra do not move as rigid units, but the interpretation of NTE becomes less direct. A related concern is that modes involving bending of the O-Ag-O links may be strongly anharmonic. In a recent study on ScF3, for example, the NTE largely originated with the bending of linear Sc-F-Sc links. Li et al. (2011) Frozen phonon calculations showed that the displacement of F atoms in these modes followed a nearly quartic potential, and the low mass of F made it possible to approximate the problem as independent local quartic oscillators. The heavy mass of the Ag atoms in the O-Ag-O links implies that different Ag atoms will move cooperatively, and delocalized anharmonic oscillators are challenging to understand.
Recent measurements by high-resolution x-ray diffractometry and extended x-ray absorption fine structure spectrometry (EXAFS) showed large deformations of the Ag4O tetrahedra. a Beccara et al. (2002); Sanson et al. (2006); Chapman and Chupas (2009); Dapiaggi et al. (2008) Although these tetrahedra are not distorted by a pure RUM, the simultaneous excitation of other modes makes it unrealistic to view the dynamics as motions of rigid framework units. Measurements by EXAFS also showed that the average Ag-O nearest-neighbor distance expands slightly upon heating, but the Ag-Ag next-nearest neighbor distance contracts approximately as expected from the bulk NTE.
Anharmonic phonon behavior is known to be important for the thermodynamics and the thermal conductivity of materials at elevated temperatures. It is also important for the thermodynamic stability of phases. Souvatzis et al. (2008); Antolin et al. (2012) Anharmonic phonon behavior is sometimes associated with NTE, but such relationships are not well understood, and helped motivate the present study.
Inelastic neutron scattering is a powerful method to measure phonon dynamics, allowing accurate measurements of vibrational entropy. Fultz (2010) Additionally, phonon energy broadening can be measured, allowing further assessment of how anharmonic effects originate from the non-quadratic parts of the interatomic potential. A recent inelastic neutron scattering experiment on Ag2O with the cuprite structure showed phonon softening (reduction in energy) with temperature. Gupta et al. (2012) The authors interpreted this result with a quasiharmonic model, where they calculated harmonic phonons for reduced volumes of the structure and obtained a negative Grüneissen parameter. These measurements were performed on the neutron energy gain side of the elastic line, restricting measurements to temperatures above 150 K, and the available energy range of 20 meV allowed about a quarter of the Ag2O phonon spectrum to be measured.
Lattice dynamics calculations, based on either classical force fields or density functional theory (DFT), have been used to study materials with the cuprite structure. Gupta et al. (2012); Sanson (2011); Mittal et al. (2007) All these calculations were performed with the quasiharmonic approximation (QHA), where the interatomic forces and phonon frequencies changed with volume, but all phonons were assumed to be harmonic normal modes with infinite lifetimes. This QHA ignores interactions of phonons at finite temperatures through the cubic or quartic parts of the interatomic potential, but these interactions are essential to explicit phonon anharmonicity. Although the QHA calculation accounted for the NTE behavior in ZrW2O8,Gava et al. (2012) for Ag2O with the cuprite structure, the QHA was only partly successful. Molecular dynamics (MD) simulations should be reliable for calculating phonon spectra in strongly anharmonic systems ,Thomas et al. (2010); Putrino and Parrinello (2002); Lan et al. (2012a) even when the QHA fails. To our knowledge, no MD investigation has yet been performed on Ag2O with the cuprite structure.
To study phonon anharmonicity in Ag2O, and its possible relationship to NTE, we performed temperature-dependent inelastic neutron scattering experiments at temperatures from 40 to 400 K to obtain the phonon density of states (DOS). (At temperatures below 40 K a first-order phase transition occurs, giving a temperature-dependent fraction of a second phase with different phonon properties Kennedy et al. (2005); Pitzer and Smith (1937).) Fourier transform infrared spectrometry at cryogenic temperatures was also used to measure the frequencies and lineshapes of phonons at the -point of the Brillouin zone. First-principles ab-initio MD simulations were performed, and by Fourier transforming the velocity autocorrelation function, the large temperature-dependent phonon anharmonicity was reproduced accurately. An independent calculation of anharmonic phonon interaction channels was performed with interacting phonon perturbation theory, and semiquantitatively explained anharmonicites of the different phonons. Most of the phonons have many channels for decay and are highly anharmonic. Although the QHA is capable of predicting about half of the NTE at low temperatures, part of this NTE is associated with anharmonicity, and most of the NTE above 250 K originates with anharmonic interactions between Ag-dominated and O-dominated phonon modes.
II Experiments
II.1 Inelastic Neutron Scattering
Inelastic neutron scattering measurements were performed with the wide angular-range chopper spectrometer, ARCS, Abernathy et al. (2012) at the Spallation Neutron Source at Oak Ridge National Laboratory. Powder samples of Ag2O with the cuprite structure of 99.99% purity were loaded into an annular volume between concentric aluminum cylinders with an outer diameter of 29 mm and an inner diameter of 27 mm, giving about 5% scattering of the incident neutron beam. The sample assembly was mounted in a bottom-loading closed cycle refrigerator outfitted with a sapphire hot stage that can be controlled independently of the second stage of the cryostat. Spectra were acquired with two incident neutron energies of approximately 30 and 100 meV. Measurements were performed at temperatures of 40, 100, 200, 300 and 400 K, each with approximately 1.6 106 neutron counts. Backgrounds with empty sample cans were measured at each temperature. Ag has an absorption cross section of 63 barns, but this was not be a problem with low background and high neutron flux.
The raw data were rebinned into intensity as a function of momentum transfer and energy transfer . After deleting the elastic peak around zero energy, neutron-weighted phonon densities of states curves were calculated from by subtracting the measured background, and using an iterative procedure to remove contributions from multiple scattering and higher-order multiphonon processes. Kresch et al. (2008)
II.2 Fourier Transform Far-Infrared Spectrometer
The far-infrared spectrometry measurements were performed with a Thermo-Nicolet Magna 860 FTIR spectrometer using a room-temperature deuterated triglycine sulfate detector and a solid substrate beam splitter. The same Ag2O powder was mixed with polyethylene fine powder with a mass ratio of 1:19 and finely ground. The sample was compressed into a pellet of 1 mm thickness, and mounted on a copper cold finger of an evacuated cryostat filled with liquid nitrogen. The cryostat had polyethylene windows that were transparent in the far-infrared. Spectra were acquired at temperatures from 100 to 300 K, and temperature was measured with a thermocouple in direct contact with the sample pellet. Backgrounds from a pure polyethylene pellet of the same size were measured at each temperature.
II.3 Results
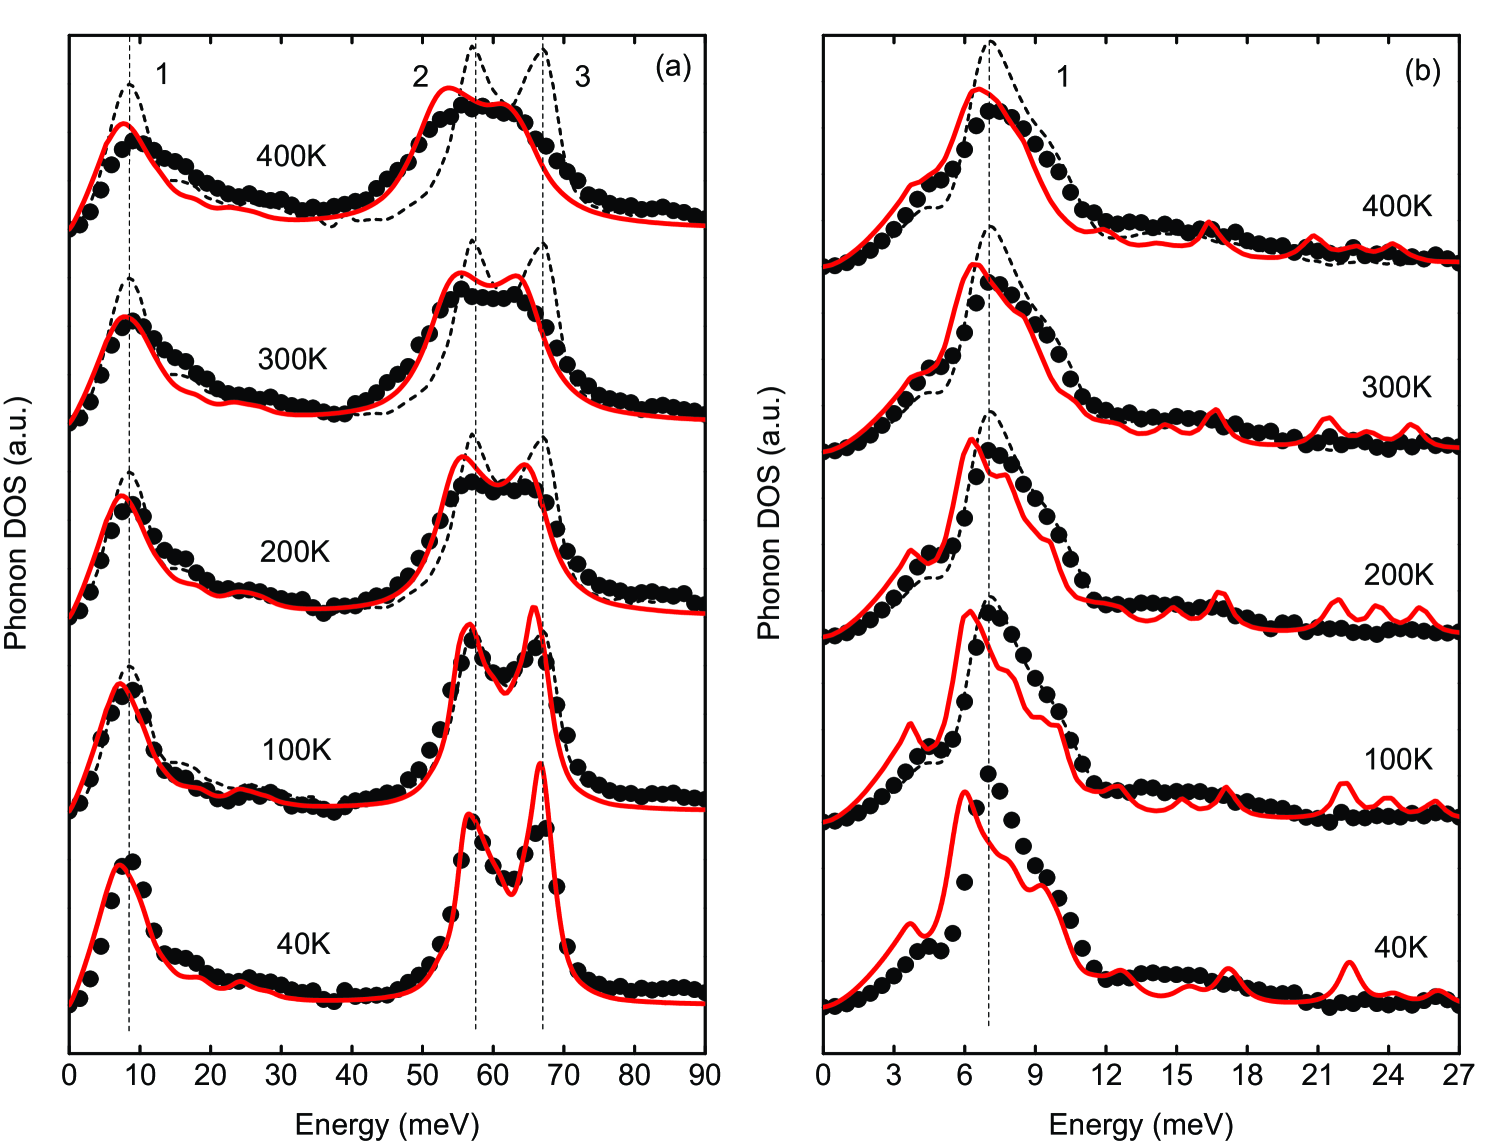
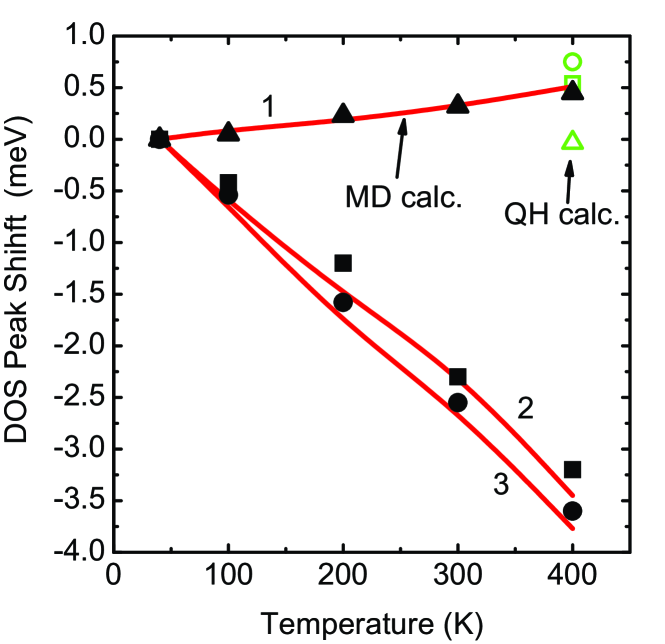
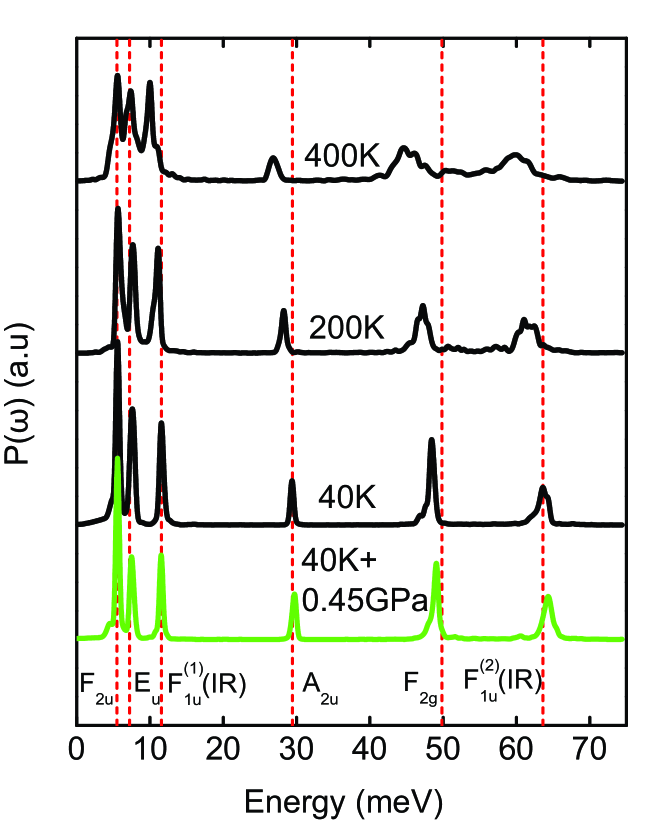
Figure 2 presents the “neutron-weighted” phonon DOS of Ag2O with the cuprite structure from ARCS data at two incident energies at temperatures from 40 to 400 K. Neutron-weighting is an artifact of inelastic neutron scattering by phonons. Phonon scattering scales with the scattering cross section divided by atom mass, , so the Ag-dominated modes around 8 meV are relatively weaker than the O-dominated modes around 63 meV. Since the instrument energy resolution is inversely related to both the incident energy and the energy transfer, the spectra in Fig. 2(b) have generally higher resolution than in Fig. 2(a). As shown in Fig. 2, the main features (peaks 1, 2 and 3) of the DOS curve from inelastic neutron scattering experiments undergo substantial broadening with temperature, even below 200 K, indicating an unusually large anharmonicity. Along with the broadening, peak 1 stiffens slightly, but peaks 2 and 3 shift to lower energy by more than 3.2 meV. This is an enormous shift over such a small temperature range. Over the same temperature range, phonons of ScF3 shifted by about 1 meV, for example.Li et al. (2011) To quantify thermal shifts, Gaussian functions were fitted to the three major peaks in the phonon DOS, and Fig. 3 presents the peak shifts relative to their centers at 40 K.
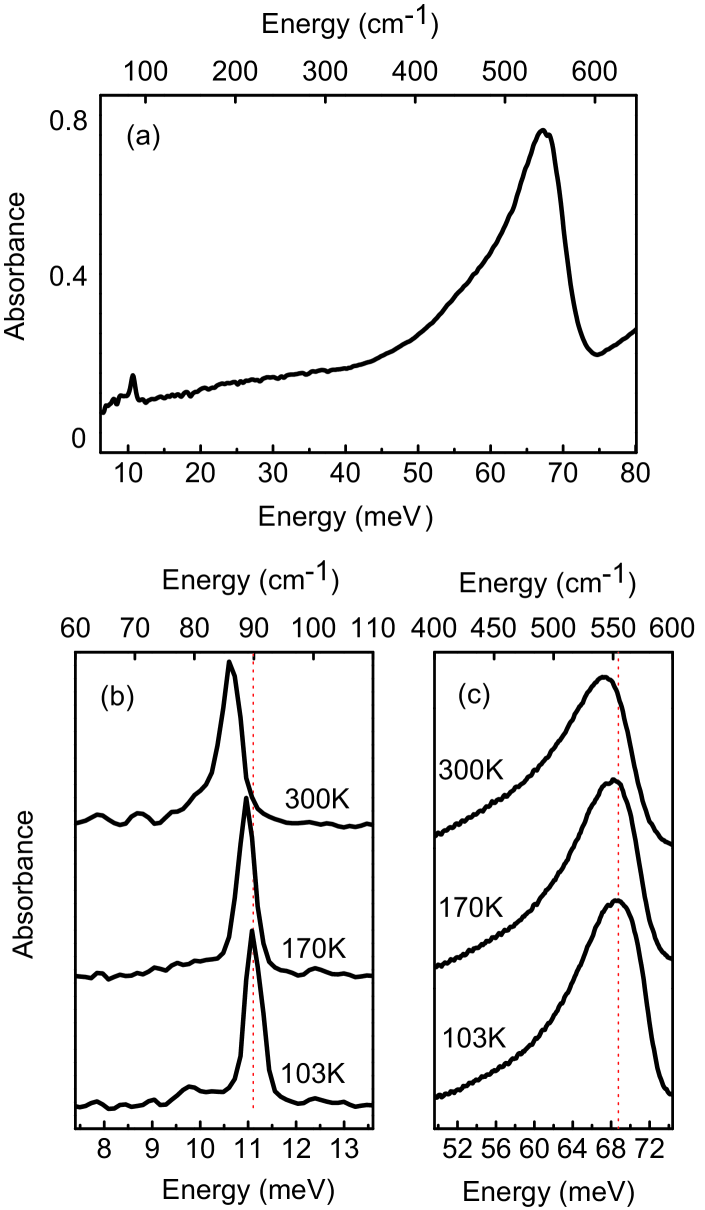
Figure 4 presents the infrared spectra of Ag2O between 50 and 650 cm-1. Two absorption bands at 86 cm-1 and 540 cm-1 are seen, consistent with previous measurements at room temperature Waterhouse et al. (2001). Analysis by group theory showed they have symmetry. The low frequency mode at 86 cm-1 is an Ag-O-Ag bending mode, while the high frequency band corresponds to Ag-O stretching. Consistent with the trend of phonon DOS measured by neutron scattering, the high frequency band broadened significantly with temperature. From 100 to 300 K, the two modes shifted to lower energy by about 4 cm-1 and 13 cm-1, respectively.
III First-Principles Molecular Dynamics Simulations
III.1 Methods
First-principles calculations were performed with the generalized gradient approximation (GGA) of density functional theory (DFT), implemented in the VASP package.Kresse and Furthmüller (1996a); Kresse and Hafner (1993); Kresse and Furthmüller (1996b) Projector augmented wave pseudopotentials and a plane wave basis set with an energy cutoff of 500 eV were used in all calculations.
First-principles Born-Oppenheimer molecular dynamics simulations were performed for a supercell with temperature control by a Nosé thermostat. The relatively small simulation cell could be a cause for concern,Sellan et al. (2010) but convergence testing showed that the supercell in our study is large enough to accurately capture the phonon anharmonicity of Ag2O. The simulated temperatures included 40, 100, 200, 300 and 400 K. For each temperature, the system was first equilibrated for 3 ps, then simulated for 18 ps with a time step of 3 fs. The system was fully relaxed at each temperature, with convergence of the pressure within 1 kbar.
Phonon frequency spectra and their -space structure were obtained from the MD trajectories by the Fourier transform velocity autocorrelation method. de Koker (2009); Thomas et al. (2010); Putrino and Parrinello (2002); Lan et al. (2012a) The phonon DOS is
| (1) |
where is an ensemble average, and is the velocity of the atom in the unit cell at time . Individual phonon modes could also be projected onto each -point in the Brillouin zone by computing the phonon power spectrum. Thomas et al. (2010); Lan et al. (2012a) To better compare with data from inelastic neutron scattering, the calculated DOS at each temperature was convoluted with the ARCS instrumental broadening function, and was neutron-weighted appropriately. Li et al. (2011); Kresch et al. (2008)
Calculations in the quasiharmonic approximation were performed two ways. In the lattice dynamics method, the thermal expansion was evaluated by optimizing the vibrational free energy as a function of volume. Li et al. (2011) Calculations were performed self-consistently with a 6-atom unit cell with a -point grid. Phonon frequencies were calculated using the small displacement method implemented by the Phonopy package.Togo et al. (2008) These phonon dispersions in the QHA were also used for the anharmonic perturbation theory described below. The second method used MD calculations to implement the QHA. We removed the temperature-dependent explicit anharmonicity by performing simulations at 40 K for volumes characteristic of 400 K, which produced a pressure of 0.45 GPa at 40 K. Further computational details are given in the Supplemental Material. 111See Supplemental Material at [URL will be inserted by publisher] for the description of the MD-implemented QHA and the corresponding figure.
At the lowest simulation temperature of 40 K, classical MD trajectories may require justification. In principle, nuclear motions could be better treated by mapping each nucleus onto a classical system of several fictitious particles governed by an effective Hamiltonian, derived from a Feynman path integral, for example. Morrone and Car (2008); Lin et al. (2010) Such low temperature quantum effects are beyond the scope of this work. Nevertheless, our results should not be altered significantly by quantum effects for the following reasons. Our particular interest is in anharmonic phonon-phonon interactions at higher temperatures, and our new results concern the phonons and NTE above 250 K. A classical MD simulation is usually appropriate at higher temperatures. The modes most subject to quantum corrections are those involving the dynamics of the lower mass O atoms, but these are at high energies. They are not activated at 40 K, and show weak anharmonic effects. Relatively larger anharmonic effects at low temperatures are found in the modes below 10 meV. These are dominated by the Ag atoms, but with their high mass only tiny quantum effects are expected. There are several semi-quantitative methods to estimate the magnitudes of quantum corrections. For example, Berens, et al. Berens et al. (1983) and Lin, et al. Lin et al. (2003) suggest that quantum effects could be evaluated from the difference between the quantum and classical vibrational energy or free energy derived from the corresponding partition functions. These methods do not account for all quantum effects on nuclear trajectories, but for Ag2O at 40 K, by using both classical and quantum paritition function for the same phonon DOS, we found the vibrational energy difference between classical and quantum statistics is only 1.2% of the cohesive energy.
III.2 Results
| Experiment 222Lattice parameter at 40 K is from neutron scattering measurements in the present work, which is in good agreement with Refs. [Tiano et al., 2003; Kennedy et al., 2005]. Bond linear thermal expansion (LTE) and variance data are from Refs. [Sanson et al., 2006; Chapman and Chupas, 2009]. The IR active mode frequencies are from FT-IR measurements in the present work, and the frequencies of the lowest two modes are from the luminescence spectra in Ref. [Kreingol’d and Kulinkin, 1970]. | Calculation | |
| Lattice Parameter | ||
| a | 4.746 | 4.814 |
| Bulk Modulus | ||
| K | N/A | 72 |
| Bond LTE | ||
| | 12.1–35.0 | 19.4 |
| -9.99 | -14.7 | |
| Bond Variance | ||
| (40 K) | 0.0078 | 0.0073 |
| (400 K) | 0.053 | 0.067 |
| Mode Frequency | ||
| 5.60 | 5.58 | |
| 8.9 | 7.45 | |
| 11.2 | 11.5 | |
| N/A | 29.4 | |
| N/A | 48.4 | |
| 67 | 63.6 |
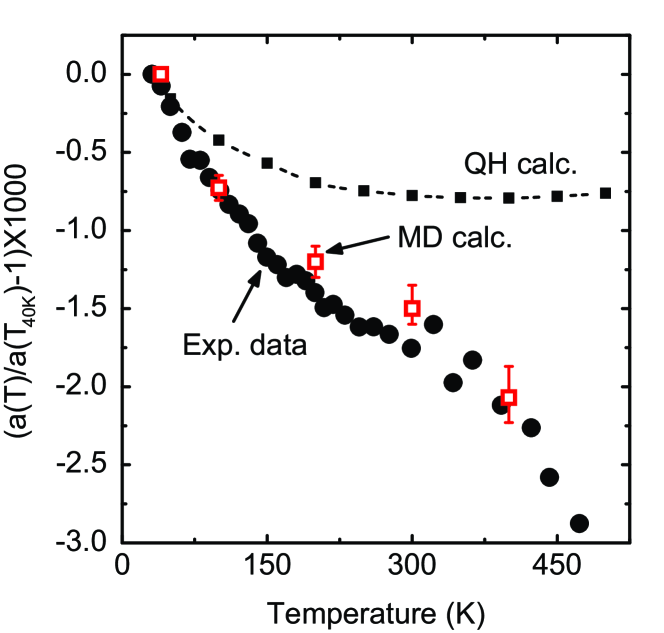
Table 1 presents results from our MD simulations and experimental data on lattice parameter, bulk modulus, thermal expansivity, and phonon frequences at the -point. As shown in Fig. 5, the MD simulations predicted the NTE very well. On the other hand, consistent with a recent QHA calculation, Gupta et al. (2012) the NTE calculated with the QHA method was much smaller.
The phonon DOS curves calculated from first-principles MD simulations are shown in Fig. 2 with the experimental spectra for comparison. To facilitate visual comparison, in Fig. 2(a) the energy axis of the calculated spectra were scaled by 6.8% to correct for underestimates of the force constants in the GGA method. Nevertheless, excellent agreement is found between the simulated phonon DOS and the experimental data, and the calculated thermal broadenings and shifts are in good agreement, too. Gaussian functions were also fit to the calculated spectra, and Fig. 3 compares these thermal shifts from experiment and calculation.
Because of the large mass difference between Ag and O atoms, the O-dominated phonon modes are well separated from the Ag-dominated modes. Partial phonon DOS analysis showed that the Ag-dominated modes had similar energies, forming the peak of the phonon DOS below 20 meV (peak 1 in Fig. 2), whereas the O-dominated modes had energies above 40 meV (peaks 2 and 3).
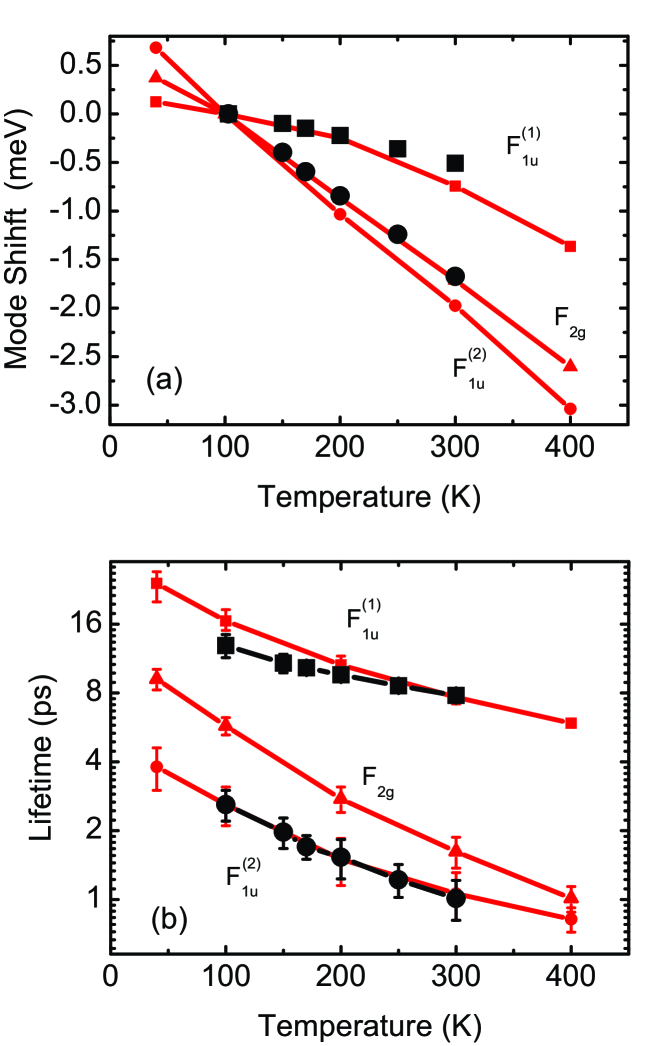
Figure 6 shows the normal modes from MD simulations, projected to the -point. Six vibrational modes are evident, including the IR-active and modes. The calculated frequencies of these modes at 40 K are listed in Table 1, showing good agreement with experiment. Large thermal shifts and broadenings are apparent in the simulated frequencies, consistent with experiment. The calculated peaks were then fitted with Lorentzian functions to extract the centroids and linewidths, which compare well with the FT-IR data as shown in Fig. 7.
IV Anharmonic Perturbation Theory
IV.1 Computational Methodology
Cubic anharmonicity gives rise to three-phonon processes, which are an important mechanism of phonon-phonon interactions. The strengths of the three-phonon processes depend on two elements – the cubic anharmonicity tensor that gives the coupling strengths between three phonons, and the kinematical processes described by the two-phonon density of states (TDOS). Maradudin and Fein (1962); Debernardi et al. (1995); Tang and Fultz (2011)
From Ipatova, et al. Ipatova et al. (1967), an anharmonic tensor element for a process with the initial phonon mode at the -point and phonons is
| (2) |
where the phonon modes have quasiharmonic frequencies and occupancies . The ’s are expected to be slowly-varying functions of their arguments. Lan et al. (2012b) We assume the term is a constant for the initial phonon , and use it as a parameter when fitting to trends from MD or experiment. Although changes with and , an average over modes,
| (3) |
is found by fitting to experimental or simulational results, where 1, 2 under the summation symbol represent . We define the cubic fitting parameter as
| (4) |
The second key element of perturbation theory is that interacting phonons satisfy the kinematical conditions of conservation of energy and momentum. This condition is averaged over all phonons with the two-phonon density of states (TDOS), defined as
| (5) | |||||
The first and second terms in square brackets are from down-conversion and up-conversion scattering processes, respectively.
The strength of the cubic phonon anharmonicity can be quantified by the quality factor , related to the phonon lifetime as the number of the vibrational periods for the energy to decay to a factor of e, and , where is the linewidth of the phonon peak. Considering Eqs. (IV.1) to (5), the phonon linewidth is related to the TDOS, , weighted by the coupling strength.Lan et al. (2012b, a) To leading order, the inverse of the quality factor can be expressed as a function of the TDOS
| (6) |
The TDOS at various temperatures was calculated from the kinematics of all three-phonon processes, sampling the phonon dispersions with a -point grid for good convergence. The from MD simulations were used to approximate the anharmonicity of the phonon modes of different energies, and obtain the the coupling strengths for the different modes.
IV.2 Results
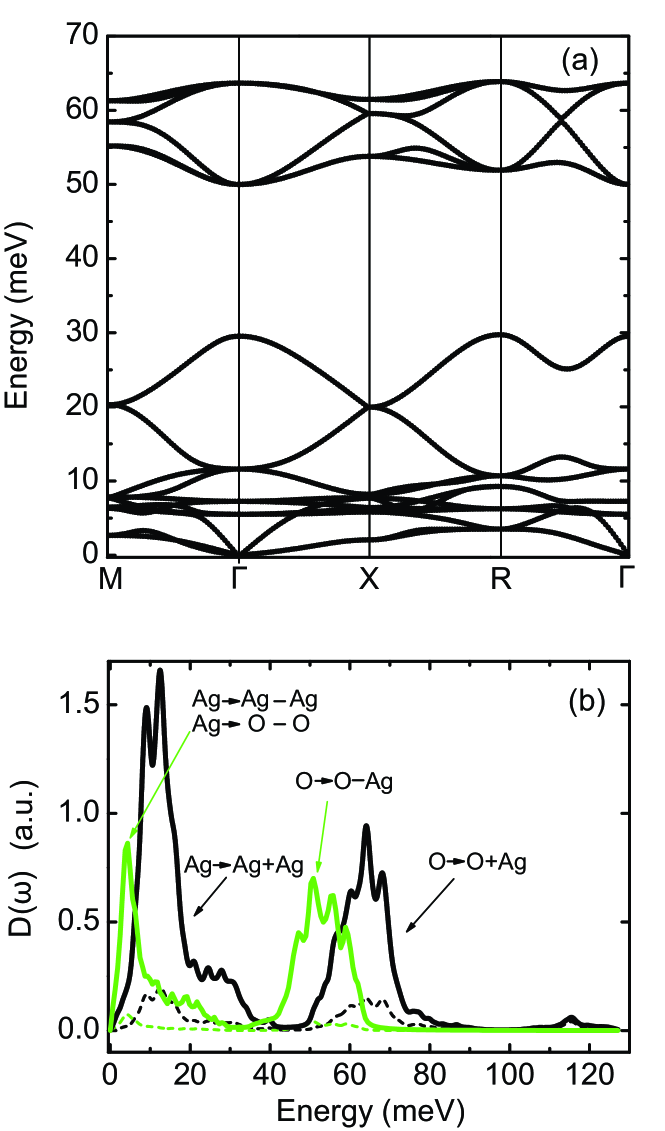
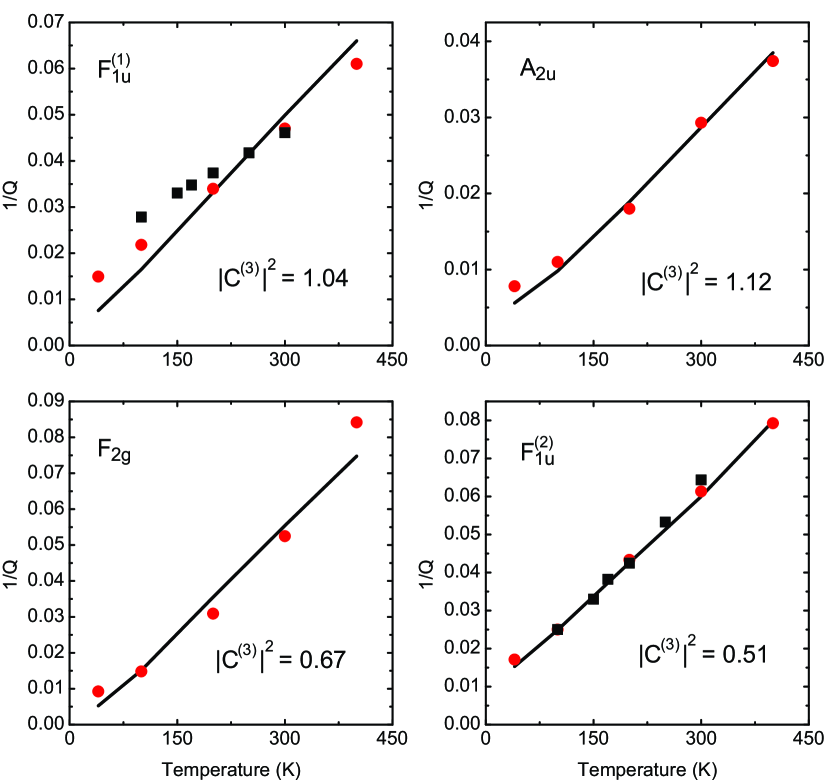
Fig. 8(a) shows calculated phonon dispersion curves of Ag2O with the cuprite structure along high-symmetry directions. From these, the TDOS spectra, , were obtained at different temperatures, presented in Fig. 8(b) for 40 and 400 K. At low temperatures there are two small peaks in the TDOS centered at 15 and 65 meV. Our calculation showed that the peak at 15 meV is from the decay processes of one Ag-dominated mode into two with lower frequencies, i.e., Ag Ag Ag. The peak at 65 meV originates from spontaneous decay of one O-dominated mode into another O-dominated mode of lower frequency and one Ag-dominated mode.
At high temperatures there are more down-conversion processes, but an even greater change in up-conversion processes. Figure 8(b) shows how the strong down-conversion peaks at low temperatures grow approximately linearly with temperature, following the thermal population of phonon modes involved in the interactions. Near the peak at 65 meV, one up-conversion band centered at 50 meV is also strong. This band comprises scattering channels in which one O-dominated mode is combined with a Ag-dominated mode to form a higher frequency O-dominated mode, i.e., O O Ag. At the low energy side, there is another band below 15 meV from two types of up-conversion processes. One is from Ag-dominated modes alone, i.e., Ag Ag Ag. The other involves two O-dominated modes, i.e., Ag O O, owing to the increased number of higher energy O-dominated modes that can participate in these processes at higher temperatures.
Figure 9 shows the inverse of quality factors, , of the , , and phonon modes from FT-IR and MD calculations, together with the best theoretical fits with Eq. (6). These modes are near the centers of main features of the phonon DOS shown in Fig. 2, i.e., the peaks 1, 2, 3 and the gap in between, respectively, and are useful for understanding the overall anharmonicity. As shown in Fig. 9, at higher temperatures the quality factors decrease substantially. At 400 K, the , , modes have low values from 12 to 15, but the mode has a much larger value of 26. With a single parameter for each mode, good fittings to the quality factors are obtained. The fitting curves and the corresponding values of the parameters are presented in Fig. 9. The values do not vary much among different modes, so the typical assumption of a slowly varying C(.) seems reasonable.
V Discussion
V.1 Quasiharmonic Approximation
In the quasiharmonic approximation (QHA), a mode Grüneisen parameter is defined as the ratio of the fractional change of the mode frequency to the fractional change of volume , at constant temperature, . The usual trend is for phonons to soften with lattice expansion, increasing the phonon entropy and stabilizing the expanded lattice at elevated temperatures. A negative Grüneisen parameter is therefore expected for the special phonon modes associated with NTE, such as RUMs. If all the anharmonicity of Ag2O with the cuprite structure is attributed to this volume effect, however, the values of Grüneisen parameters are approximately –9 for the high energy modes at peaks 2 and 3 of the phonon DOS, and –20 for the infrared-active F1u mode. These anomalous values may indicate a problem with the QHA. The QHA method also significantly underestimates the NTE, and misses the behavior at temperatures above 250 K.
As seen in the figure in the Supplemental Material and in Fig. 6, the giant negative Grüneisen parameters are inconsistent with the results of MD simulations. The volume change alone does not affect much the phonon lifetimes or frequency shifts. All features in the phonon spectra generated with the MD-implemented QHA showed little change except for small stiffening about 0.6 meV at high energies, in agreement with the recent lattice dynamics QHA calculations. Gupta et al. (2012)
V.2 Negative Thermal Expansion
Our eigenvector analysis of phonon modes showed that the three low-energy Ag-dominated , and modes correspond to two distinct types of vibrations. The mode involves rigid rotations of Ag4O tetrahedra, and could be considered as RUM. The mode involves the shearing of Ag4O units by changing the Ag-O-Ag bond angles. The mode measured by infrared spectrometry also shears the Ag4O units, and includes some displacements of O atoms. Shearing the tetrahedra was shown to reduce the average vertex-vertex distance Waterhouse et al. (2001); Sanson (2009) and contribute to the NTE.
In the cuprite structure, the modes associated with the rigid rotations and the distortions of the Ag4O tetrahedra have similar energies below 10 meV. They are equally favorable thermodynamically, and both would be active at very low temperature. As a consequence, there is simultaneously a large deformation of Ag4O units and a strong contraction of the Ag-Ag shell, as observed experimentally and computationally at low temperatures. The large thermal distortions of the Ag4O tetrahedra involve the Ag atoms at the vertices, and their large mass causes these distortions to occur at low frequencies. Polyhedral units in most other NTE materials are bridged by the lightweight atoms, such as O and C-N, so the polyhedra are distorted at significantly higher energies (usually above 40 meV), and may not distort at lower temperatures.
It is a thermodynamic requirement that the NTE of Fig. 5 must go to zero at , but the intervening phase transition at 40 K impedes this measurement. Nevertheless, the steep slope of the lattice parameter with temperature is consistent with the occupancy of phonon modes of 10 meV energy, suggesting that the QHA model of NTE involves the correct modes, such as the mode (which is a RUM). These low-energy modes are dominated by motions of the Ag atoms. This explanation based on the QHA is qualitatively correct, but anharmonic interactions are large enough to cause the QHA to underestimate the NTE by a factor of two.
V.3 Explicit Anharmonicity
At temperatures above 250 K, there is a second part of the NTE behavior that is beyond the predictions of quasiharmonic theory. This NTE above 250 K is predicted accurately by the ab-initio MD calculations, so it is evidently a consequence of phonon anharmonicity. The temperature-dependence of this NTE behavior follows the Planck occupancy factor for phonon modes above 50 meV, corresponding to the O-dominated band of optical frequencies. In the QHA these modes above 50 meV do not contribute to the NTE. These modes are highly anharmonic, however, as shown by their large broadenings and shifts.
For cubic anharmonicity, the two-phonon DOS (TDOS) is the spectral quantity parameterizing the number of phonon-phonon interaction channels available to a phonon. For Ag2O with the cuprite structure, the peaks in the TDOS overlap well with the peaks in the phonon DOS. Most of the phonons therefore have many possible interactions with other phonons, which contributes to the large anharmonicity of Ag2O with the cuprite structure, and small (short lifetimes). Although the values of most phonon modes in Ag2O with the cuprite structure are small and similar, the origins of these lifetime broadenings are intrinsically different. For peak 2 of the phonon DOS, the anharmonicity is largely from the up-conversion processes: O O Ag, while for peak 3 it is from the down-conversion processes: O O Ag. The anharmonicity of peak 1 is more complicated. It involves both up-conversion and down-conversion processes of Ag-dominated modes. The TDOS also shows why the mode has a larger than other modes. Figure 8(b) shows that the mode lies in the trough of the TDOS where there are only a few phonon decay channels.
Owing to explicit anharmonicity from phonon-phonon interactions, the thermodynamic properties of Ag2O with the cuprite structure cannot be understood as a sum of contributions from independent normal modes. The frequency of an anharmonic phonon depends on the level of excitation of other modes. At high temperatures, large vibrational amplitudes increase the anharmonic coupling of modes, and this increases the correlations between the motions of the Ag and O atoms, as shown by perturbation theory. Couplings in perturbation theory have phase coherence, so the coupling between Ag- and O-dominated modes at higher energies, as seen in the peak of the TDOS, causes correlations between the motions of Ag and O atoms. The ab-initio MD simulations show that anharmonic interactions allow the structure to become more compact with increasing vibrational amplitude. The mutual motions of the O and Ag atoms cause higher density as the atoms fill space more effectively. The large difference in atomic radii of Ag and O may contribute to this effect. Perhaps it also facilitates the irreversible changes in Ag2O at temperatures above 500 K, but this requires further investigation. For cuprite Cu2O, which has less of a difference in atomic radii, the thermal expansion is much less anomalous.
VI Conclusions
Phonon densities of states of Ag2O with the cuprite structure at temperatures from 40 to 400 K were measured by inelastic neutron scattering spectrometry. The infrared spectra of phonon modes were also obtained at temperatures from 100 to 300 K. Large anharmonicity was found from both the shifts and broadenings of peaks in the phonon spectra. A normal mode analysis identified the rigid unit modes and the bending modes of the Ag4O tetrahedra that play key roles in the negative thermal expansion (NTE) at low temperatures. Some of the NTE can be understood by quasiharmonic theory, but this approach is semiquantitative, and limited to temperatures below 250 K.
First principles MD calculations were performed at several temperatures. These calculations accurately accounted for the NTE and local dynamics of Ag2O with the cuprite structure, such as the contraction of the Ag-Ag shell and the large distortion of the Ag4O tetrahedra. The phonon DOS obtained from a Fourier-transformed velocity autocorrelation method showed large anharmonic effects in Ag2O, in excellent agreement with the experimental data. A second part of the NTE at temperatures above 250 K is due largely to the anharmonicity of phonon-phonon interactions and is not predicted with volume dependent quasiharmonicity.
Phonon perturbation theory with the cubic anharmonicity helped explain the effects of phonon kinematics on phonon anharmonicity of Ag2O with the cuprite structure. The phonon interaction channels for three-phonon processes are given by the TDOS, weighted approximately by the phonon coupling strength. The phonons that are most broadened are those with energies that lie on peaks in the TDOS. The temperature-dependence of the quality factors of individual phonon modes measured by infrared spectrometry were explained well by anharmonic perturbation theory. Perturbation theory also showed strong interactions between the Ag-dominated modes and the O-dominated modes in both up-conversion and down-conversion processes. In particular, the strong interactions of O-dominated modes with Ag-dominated modes causes the second stage of NTE at temperatures above 250 K.
Acknowledgements.
This work was supported by DOE BES under contract DE-FG02-03ER46055. The work benefited from software developed in the DANSE project under NSF award DMR-0520547. Research at Oak Ridge National Laboratory’s SNS was sponsored by the Scientific User Facilities Division, BES, DOE.References
- Tiano et al. (2003) W. Tiano, M. Dapiaggi, and G. Artioli, J. Appl. Crystallogr. 36, 1461 (2003).
- Kennedy et al. (2005) B. J. Kennedy, Y. Kubota, and K. Kato, Solid State Commun. 136, 177 (2005).
- Bhattacharya and Ghosh (2003) S. Bhattacharya and A. Ghosh, Solid State Ionics 161, 61 (2003).
- Minami (1983) T. Minami, J. Non-Crys. Solids 56, 15 (1983).
- Li et al. (2003) W.-X. Li, C. Stampfl, and M. Scheffler, Phys. Rev. Lett. 90, 256102 (2003).
- Gou and Murphy (2003) L. Gou and C. Murphy, Nano Lett. 3, 231 (2003).
- Pryde et al. (1996) A. K. A. Pryde, K. D. Hammonds, M. T. Dove, V. Heine, J. D. Gale, and M. C. Warren, J. Phys.-Condens. Matter 8, 10973 (1996).
- Heine et al. (1999) V. Heine, P. R. L. Welche, and M. T. Dove, J. Am. Ceram. Soc. 82, 1793 (1999).
- Li et al. (2011) C. W. Li, X. Tang, J. A. Munoz, J. B. Keith, S. J. Tracy, D. L. Abernathy, and B. Fultz, Phys. Rev. Lett. 107, 195504 (2011).
- a Beccara et al. (2002) S. a Beccara, G. Dalba, P. Fornasini, R. Grisenti, A. Sanson, and F. Rocca, Phys. Rev. Lett. 89, 025503 (2002).
- Sanson et al. (2006) A. Sanson, F. Rocca, G. Dalba, P. Fornasini, R. Grisenti, M. Dapiaggi, and G. Artioli, Phys. Rev. B 73, 214305 (2006).
- Chapman and Chupas (2009) K. W. Chapman and P. J. Chupas, Chem. Mater. 21, 425 (2009).
- Dapiaggi et al. (2008) M. Dapiaggi, H. Kim, E. S. Bozin, S. J. L. Billinge, and G. Artioli, J. Phys. Chem. Solids 69, 2182 (2008).
- Souvatzis et al. (2008) P. Souvatzis, O. Eriksson, M. I. Katsnelson, and S. P. Rudin, Phys. Rev. Lett. 100, 095901 (2008).
- Antolin et al. (2012) N. Antolin, O. D. Restrepo, and W. Windl, Phys. Rev. B 86, 054119 (2012).
- Fultz (2010) B. Fultz, Prog. Mater. Sci. 55, 247 (2010).
- Gupta et al. (2012) M. K. Gupta, R. Mittal, S. Rols, and S. L. Chaplot, Physica B 407, 2146 (2012).
- Sanson (2011) A. Sanson, Solid State Commun. 151, 1452 (2011).
- Mittal et al. (2007) R. Mittal, S. L. Chaplot, S. K. Mishra, and P. P. Bose, Phys. Rev. B 75, 174303 (2007).
- Gava et al. (2012) V. Gava, A. L. Martinotto, and C. A. Perottoni, Phys. Rev. Lett. 109, 195503 (2012).
- Thomas et al. (2010) J. A. Thomas, J. E. Turney, R. M. Iutzi, C. H. Amon, and A. J. H. McGaughey, Phys. Rev. B 81, 081411 (2010).
- Putrino and Parrinello (2002) A. Putrino and M. Parrinello, Phys. Rev. Lett. 88, 176401 (2002).
- Lan et al. (2012a) T. Lan, X. Tang, and B. Fultz, Phys. Rev. B 85, 094305 (2012a).
- Pitzer and Smith (1937) K. S. Pitzer and W. V. Smith, J. Am. Chem. Soc. 59, 2633 (1937).
- Abernathy et al. (2012) D. L. Abernathy, M. B. Stone, M. J. Loguillo, M. S. Lucas, O. Delaire, X. Tang, J. Y. Y. Lin, and B. Fultz, Rev. Sci. Instum. 83, 015114 (2012).
- Kresch et al. (2008) M. Kresch, M. Lucas, O. Delaire, J. Y. Lin, and B. Fultz, Phys. Rev. B 77, 024301 (2008).
- Waterhouse et al. (2001) G. I. N. Waterhouse, G. A. Bowmaker, and J. B. Metson, Phys. Chem. Chem. Phys. 3, 3838 (2001).
- Kresse and Furthmüller (1996a) G. Kresse and J. Furthmüller, Comput. Mater. Sci. 6, 15 (1996a).
- Kresse and Hafner (1993) G. Kresse and J. J. Hafner, Phys. Rev. B 47, 558 (1993).
- Kresse and Furthmüller (1996b) G. Kresse and J. Furthmüller, Phys. Rev. B 54, 11169 (1996b).
- Sellan et al. (2010) D. P. Sellan, E. S. Landry, J. E. Turney, A. J. H. McGaughey, and C. H. Amon, Phys. Rev. B 81, 214305 (2010).
- de Koker (2009) N. de Koker, Phys. Rev. Lett. 103, 125902 (2009).
- Togo et al. (2008) A. Togo, F. Oba, and I. Tanaka, Phys. Rev. B 78, 134106 (2008).
- Note (1) See Supplemental Material at [URL will be inserted by publisher] for the description of the MD-implemented QHA and the corresponding figure.
- Morrone and Car (2008) J. A. Morrone and R. Car, Phys. Rev. Lett. 101, 017801 (2008).
- Lin et al. (2010) L. Lin, J. A. Morrone, R. Car, and M. Parrinello, Phys. Rev. Lett. 105, 110602 (2010).
- Berens et al. (1983) P. H. Berens, D. H. J. Mackay, G. M. White, and K. R. Wilson, J. Chem. Phys. 79, 2375 (1983).
- Lin et al. (2003) S.-T. Lin, M. Blanco, and W. A. Goddard, J. Chem. Phys. 119, 11792 (2003).
- Kreingol’d and Kulinkin (1970) F. I. Kreingol’d and B. S. Kulinkin, Soviet Phys.- Semicond. 4, 2022 (1970).
- Maradudin and Fein (1962) A. A. Maradudin and A. E. Fein, Phys. Rev. 128, 2589 (1962).
- Debernardi et al. (1995) A. Debernardi, S. Baroni, and E. Molinari, Phys. Rev. Lett. 75, 1819 (1995).
- Tang and Fultz (2011) X. Tang and B. Fultz, Phys. Rev. B 84, 054303 (2011).
- Ipatova et al. (1967) I. P. Ipatova, A. A. Maradudin, and R. F. Wallis, Phys. Rev. 155, 882 (1967).
- Lan et al. (2012b) T. Lan, C. W. Li, and B. Fultz, Phys. Rev. B 86, 134302 (2012b).
- Sanson (2009) A. Sanson, Solid State Sciences 11, 1489 (2009).