Border forces and friction control epithelial closure dynamics
Epithelization, the process whereby an epithelium covers a cell-free surface, is not only central to wound healing Sonnemann2011 but also pivotal in embryonic morphogenesis Wood2002 , regeneration, and cancer Friedl2009 . In the context of wound healing, the epithelization mechanisms differ depending on the sizes and geometries of the wounds as well as on the cell type Brock1996 ; Grasso2007 ; Tamada2007 ; Abreu-Blanco2012 ; Anon2012 , while a unified theoretical decription is still lacking Almeida2009 ; Arciero2011 ; Lee2011 . Here, we used a barrier-based protocol Poujade2007 that allows for making large arrays of well-controlled circular model wounds within an epithelium at confluence, without injuring any cells. We propose a physical model that takes into account border forces, friction with the substrate, and tissue rheology. Despite the presence of a contractile actomyosin cable at the periphery of the wound, epithelization was mostly driven by border protrusive activity. Closure dynamics was quantified by an epithelization coefficient defined as the ratio of the border protrusive stress to the friction coefficient between epithelium and substrate. The same assay and model showed a high sensitivity to the RasV12 mutation on human epithelial cells, demonstrating the general applicability of the approach and its potential to quantitatively characterize metastatic transformations.
The experiments relied on the constraint of epithelial growth by cylindrical polydimethylsiloxane (PDMS) pillars whose base, of radius , was in contact with the surface of a glass coverslip, therefore preventing cell growth on these areas (Fig. 1, Supplementary Fig. 5). Removing the pillars (“barriers”) yielded a continuous cell monolayer surrounding circular cell-free patches (“wounds”), whose surface did not differ from the rest of the substrate. Pillar removal did not injure the cells but triggered their migration into the cell-free regions Anon2012 ; Poujade2007 . The free surface area of each wound was dynamically monitored and we defined an effective radius , from which the margin velocity was computed. Experiments were first carried out on the well-known Madin-Darby canine kidney (MDCK) cells that are prototypical of a cohesive epithelium Gaush1966 . We then studied the influence of an oncogenic transformation on epithelization for the human embryonic kidney line Ayllon2000 .
MDCK circular wounds of initial radii between m and m rapidly lost their circular shape through the formation of leader cells at several positions around the margin (Supplementary Movie 1). Subsequently, these leader cells dragged multi-cellular fingers Omelchenko2003 ; Reffay2011 that eventually merged within the wound, thereby creating smaller secondary holes. These holes then proceeded to close, this time without leader cells or roughening of the margin (Supplementary Movie 2). When m, this assay is qualitatively identical with barrier assays performed on large wounds of rectangular shape Poujade2007 .
In contrast, smaller wounds (m) healed without the formation of leader cells with only minor distortions of their disk-like shape (Fig. 1, Supplementary Fig. 6). Of note, this transition radius is of the same order as the epithelial velocity correlation length Petitjean2010 . The closure of smaller wounds was completed within hours, and presented two striking features (Fig. 1C-D). (i) Confocal imaging of F-actin revealed lamellipodia in variable number and size at the margin (Supplementary Movie 3). Active protrusions were not limited to the free surface of the wounds and we also systematically observed cryptic lamellipodia Farooqui2005 within the tissue that did not show a preferential orientation (Supplementary Movie 6). (ii) A pluricellular actomyosin cable was assembled at the margin only minutes after removal of the pillars and ran continuously around the wound edge.
The contribution of the actomyosin cable was assessed with 2-photon laser ablation experiments (Supplementary Materials and Methods). Local ablations induced a retraction of the severed ends of the cable (Supplementary Fig. 8), on a time scale of a few seconds. This observation confirmed that the cable was under tension, as expected from the co-localization of F-actin in the cable with its associated molecular motor myosin II. Furthermore, we observed a small backward displacement (m) of the edge of the wound in the radial direction upon ablation of the entire cable, on a time scale of a few minutes (Supplementary Fig. 9, Supplementary Movie 7). Together, these results show that the cable exerts centripetal forces on the closing epithelium.
To substantiate a physical model of epithelization, we used selective inhibition to uncouple the contributions made by the contractile cable and by protrusive activity (Fig. 2). Actomyosin contractility and lamellipodial activity are respectively associated with the small G-proteins Rho and Rac1 Ridley2001 . Whereas the Rho inhibitor c3-transferase had little influence on the closure times (Rho- assays, Supplementary Fig. 12A), the Rac1 inhibitor NSC-23766 induced a significant slowing down of the closing process (Rac- assays, Fig. 2A, Supplementary Fig. 12B). Some Rac- MDCK wounds of large enough initial radii did not close Farooqui2005 , and epithelization stopped at a final nonzero value of the radius (Fig. 2B, Supplementary Movie 8). We conclude from these results that lamellipodial activity is the dominant driving force of epithelization Fenteany2000 ; Anon2012 .
Using velocimetry techniques Petitjean2010 ; Deforet2012 , we measured the velocity field around circular wounds in space and time. Strikingly, the angle-averaged radial component of the velocity decayed as the inverse of the distance to the initial center of the wound (Supplementary Fig. 10), a signature of monolayer incompressibility (Supplementary Model). Indeed, the cell density was approximately uniform, and increased by less than during closure, since cells divided little or not at all (Supplementary Fig. 11).
On the basis of these observations, we model the tissue as a two-dimensional, isotropic, continuous material, whose flow is incompressible and driven by border forces (Supplementary Model). The epithelium occupies at time the space outside a disk of radius , with an initial radius (Fig. 3A). We assume that lamellipodia exert a constant protrusive stress at the margin, and that the friction force between epithelium and substrate is fluid, with a friction coefficient . The radial force balance equation is integrated with a boundary condition at a cut-off radius , a parameter of the model. A differential equation for follows from the stress boundary condition at the border. Neglecting the contribution of the peripheral cable to force generation, and using an inviscid tissue rheology, we obtain an analytical expression for the closure time as a function of the initial radius :
| (1) |
where the epithelization coefficient has the dimension of a diffusion coefficient.
Since the closure time is a robust quantity that depends little on the specifics of image analysis, we used equation (1) to fit the data and measure the parameters and (Fig. 4, Supplementary Fig. 13). We checked that taking into account force generation by the actomyosin cable in the stress boundary condition does not modify our results (Supplementary Data Analysis, Supplementary Fig. 14A). We found that the cut-off radius , of the order of m, varied little between different conditions. Compared to its wild type value (, ), the epithelization coefficient was strongly reduced by Rac inhibition (, ), and adopted an intermediate value under Rho inhibition (, ). Individual trajectories of wound radii were also satisfactorily fitted by the predicted time evolution of the radius (Supplementary Equation (13)), and yielded estimates of the epithelization coefficient consistent within error bar with those obtained from closure time data, albeit with larger uncertainties (Supplementary Fig. 16). Since Rac inhibition impairs actin polymerization at the leading edge of migrating cells Ridley2001 , one expects a lower protrusive stress in Rac- assays, conducive to a lower value of . Both Rac and Rho inhibition may also modify the friction coefficient , which generally depends on the intensity and the dynamics of cell-substrate adhesion. This may explain the lower value of measured under Rho inhibition (Supplementary Data Analysis).
In order to check whether our results were robust against varying assumptions on the epithelial rheology, we investigated the predicted closure dynamics of: (i) a viscous epithelium, with a shear viscosity coefficient ; and (ii) an elastic epithelium, with a shear elastic modulus . Fitting data with the more complex functional forms of thus obtained (Supplementary Model and Fig. 3D-E), we concluded that (i) : external friction dominates internal viscosity Bonnet2012 ; and (ii) : protrusive forces dominate elastic forces (Supplementary Data Analysis). These results confirm that equation (1) provided a satisfactory description of the data on closing wounds. Further, the trajectories of non-closing Rac- wounds could be fitted with the analytical expressions obtained on the basis of an elastic epithelial rheology (Supplementary Fig. 17). Due to Rac inhibition, the border force was small enough to allow a restoring elastic force to stop epithelization on the time scale of the experiment.
Finally, to test the sensitivity of the proposed quantification to cell phenotypes, we studied and compared epithelization by human embryonic kidney (HEK-HT) cells and by the derived cell line constitutively expressing the H-Ras oncogene (HEK-RasV12), using the same experimental and data analysis protocols. The dynamics were globally faster than what had been observed for MDCK cells (compare Supplementary Movies 3 and 4 or Figs. 4A and 4B). Moreover, the HEK-RasV12 cell line had a greater protrusive activity than the HEK-HT line (compare Supplementary Movies 4 and 5). The model in its simplest form, equation (1), accounted well for the closure time data (Fig. 4B). Further, HEK-RasV12 wounds were characterized by a larger epithelization coefficient (, ) than HEK-HT wounds (, ). The mutation carried by the HEK-RasV12 cell line is known to be common in different types of cancer Chin1999 and to promote angiogenesis Mali2010 and cell motility Meadows2004 . The larger value of the epithelization coefficient for HEK-RasV12 than for HEK-HT wounds proves to be a signature of the metastatic capacity of the transformed cell line.
To summarize, a model of the epithelium as an inviscid fluid allowed to quantify the closure of small circular wounds and to classify different cell phenotypes according to the value of the epithelization coefficient. The protrusive force generated by lamellipodia at and close to the margin drove collective migration. From the order of magnitude of the epithelization coefficient , and given that of cellular protrusive forces nN Prass2006 , we deduce an order of magnitude of the epithelium-substrate friction coefficient on a glass substrate (Supplementary Data Analysis). Down- or up-regulating integrin expression or turn-over may modify , and in turn alter epithelization dynamics. Recent work has shown that the competition between friction and flow governs collective migration in developing organisms Bonnet2012 ; Behrndt2012 ; Mayer2010 . Appropriate modifications of the model may lead to quantitative descriptions of in vivo epithelization during wound healing Brock1996 ; Wood2002 ; Abreu-Blanco2012 , but also during embryonic morphogenesis, as in, e.g., the dorsal closure of D. melanogaster Kiehart2000 or the ventral enclosure of C. elegans Williams-Masson1997 .
Acknowledgements.
The authors thank Olivier Leroy and Olivier Renaud, along with other members of the PICT-IBISA platform, for their help with confocal imaging and laser ablation experiments, as well as Maria-Carla Parrini for her help with immunostaining experiments. O. C. acknowledges support by the Association pour la Recherche contre le Cancer.References
- (1) Sonnemann, K. J. and Bement, W. M. Wound repair: toward understanding and integration of single-cell and multicellular wound responses. Annu. Rev. Cell Dev. Biol. 27, 237–263 (2011).
- (2) Wood, W. et al. Wound healing recapitulates morphogenesis in Drosophila embryos. Nat. Cell Biol. 4, 907–912 (2002).
- (3) Friedl, P. and Gilmour, D. Collective cell migration in morphogenesis, regeneration and cancer. Nat. Rev. Cell Mol. Biol. 10, 445–457 (2009).
- (4) Brock, J., Midwinter, K., Lewis, J., and Martin, P. Healing of incisional wounds in the embryonic chick wing bud: characterization of the actin purse-string and demonstration of a requirement for Rho activation. J. Cell Biol. 135, 1097–1107 (1996).
- (5) Grasso, S., Hernàndez, J. A., and Chifflet, S. Roles of wound geometry, wound size, and extracellular matrix in the healing response of bovine corneal endothelial cells in culture. Am. J. Physiol. Cell. Physiol. 293, C1327–C1337 (2007).
- (6) Tamada, M., Perez, T. D., Nelson, W. J., and Sheetz, M. P. Two distinct modes of myosin assembly and dynamics during epithelial wound closure. J. Cell Biol. 176, 27–33 (2007).
- (7) Abreu-Blanco, M. T., Verboon, J. M., Liu, R., Watts, J. J., and Parkhurst, S. M. Drosophila embryos close epithelial wounds using a combination of cellular protrusions and an actomyosin purse string. J. Cell Sci. 125, 5984–5997 (2012).
- (8) Anon, E. et al. Cell crawling mediates collective cell migration to close undamaged epithelial gaps. Proc. Natl. Acad. Sci. U S A 109, 10891–10896 (2012).
- (9) Almeida, L., Bagnerini, P., Habbal, A., Noselli, S., and Serman, F. Singularities in Nonlinear Evolution Phenomena and Applications, volume 9 of CRM Series, chapter Tissue repair modeling, 27–46. Edizioni Della Normale (2009).
- (10) Arciero, J. C., Mi, Q., Branca, M. F., Hackam, D. J., and Swigon, D. Continuum model of collective cell migration in wound healing and colony expansion. Biophys. J. 100, 535–543 (2011).
- (11) Lee, P. and Wolgemuth, C. W. Crawling cells can close wounds without purse strings or signaling. PLoS Comput. Biol. 7, e1002007 (2011).
- (12) Poujade, M. et al. Collective migration of an epithelial monolayer in response to a model wound. Proc. Natl. Acad. Sci. U S A 104, 15988–15993 (2007).
- (13) Gaush, C. R., Hard, W. L., and Smith, T. F. Characterization of an established line of canine kidney cells (MDCK). Proc. Soc. Exp. Biol. Med. 122, 931–935 (1966).
- (14) Ayllón, V. and Rebollo, A. Ras-induced cellular events (review). Mol. Membr. Biol. 17, 65–73 (2000).
- (15) Omelchenko, T., Vasiliev, J. M., Gelfand, I. M., Feder, H. H., and Bonder, E. M. Rho-dependent formation of epithelial ”leader” cells during wound healing. Proc. Natl. Acad. Sci. U S A 100, 10788–10793 (2003).
- (16) Reffay, M. et al. Orientation and polarity in collectively migrating cell structures: statics and dynamics. Biophys. J. 100, 2566–2575 (2011).
- (17) Petitjean, L. et al. Velocity fields in a collectively migrating epithelium. Biophys. J. 98, 1790–1800 (2010).
- (18) Farooqui, R. and Fenteany, G. Multiple rows of cells behind an epithelial wound edge extend cryptic lamellipodia to collectively drive cell-sheet movement. J. Cell Sci. 118, 51–63 (2005).
- (19) Ridley, A. J. Rho GTPases and cell migration. J. Cell Sci. 114, 2713–2722 (2001).
- (20) Fenteany, G., Janmey, P. A., and Stossel, T. P. Signaling pathways and cell mechanics involved in wound closure by epithelial cell sheets. Curr. Biol. 10, 831–838 (2000).
- (21) Deforet, M. et al. Automated velocity mapping of migrating cell populations (AVeMap). Nat. Methods 9, 1081–1083 (2012).
- (22) Bonnet, I. et al. Mechanical state, material properties and continuous description of an epithelial tissue. J. R. Soc. Interface 9, 2614–2623 (2012).
- (23) Chin, L. et al. Essential role for oncogenic Ras in tumour maintenance. Nature 400, 468–472 (1999).
- (24) Mali, P., Wirtz, D., and Searson, P. C. Interplay of RhoA and motility in the programmed spreading of daughter cells postmitosis. Biophys. J. 99, 3526–3534 (2010).
- (25) Meadows, K. N., Bryant, P., Vincent, P. A., and Pumiglia, K. M. Activated Ras induces a proangiogenic phenotype in primary endothelial cells. Oncogene 23, 192–200 (2004).
- (26) Prass, M., Jacobson, K., Mogilner, A., and Radmacher, M. Direct measurement of the lamellipodial protrusive force in a migrating cell. J. Cell Biol. 174, 767–772 (2006).
- (27) Behrndt, M. et al. Forces driving epithelial spreading in zebrafish gastrulation. Science 338, 257–260 (2012).
- (28) Mayer, M., Depken, M., Bois, J. S., Jülicher, F., and Grill, S. W. Anisotropies in cortical tension reveal the physical basis of polarizing cortical flows. Nature 467, 617–621 (2010).
- (29) Kiehart, D. P., Galbraith, C. G., Edwards, K. A., Rickoll, W. L., and Montague, R. A. Multiple Forces Contribute to Cell Sheet Morphogenesis for Dorsal Closure in Drosophila. J. Cell Biol. 149, 471–490 (2000).
- (30) Williams-Masson, E. M., Malik, A. N., and Hardin, J. An actin-mediated two-step mechanism is required for ventral enclosure of the C. elegans hypodermis. Dev. 124, 2889–2901 (1997).
A: Field of view (m). Between two and four such fields are recorded in a typical experiment. Several adjacent MDCK wounds are visible at (left) and h (right) after removal of the PDMS pillars. Note the intrinsic diversity of closure dynamics. The typical cell size is of the order of m.
B: Timelapse zoomed on a single wound (m).
C: Wound fixed at min (m) and stained for phospho-myosin II light chain (red), F-actin (green) and nuclei (blue) by immunofluoresence. Note the presence of a pluricellular actomyosin cable and of lamellipodia (indicated by stars). For this size, we observed between and lamellipodia whose area ranged between and (). Scale bars: m.
D: Section of a live wound (MDCK-LifeAct-GFP, m, min) imaged by confocal microscopy. The position of the cable on both sides is indicated by arrows. Scale bar: m.
A: Closure time (m). Red: MDCK wild-type; blue: Rac- assay. Box: first quartile, median and last quartile.
B: Rac- assay, fraction of MDCK wounds proceeding to full closure within h for the initial sizes m (), m () and m ().
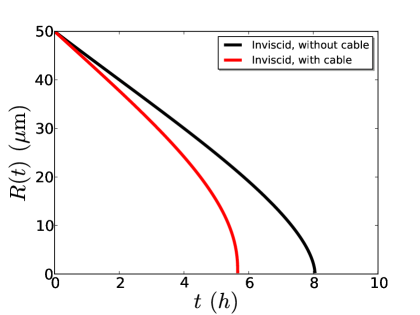
A: Sketch of a closing circular wound, of initial radius . Two border forces may drive closure: is the protrusive stress produced by lamellipodia, the line tension due to the contractile circumferential cable (see the stress boundary condition Supplementary Eq. (6))
B-F: Model predictions. Plots of the closure time as a function of the initial effective radius .
B: Effect of the variation of while is fixed, inviscid rheology without cable, equation (1) (also Supplementary Eq. (29)).
C: Effect of the variation of while and are fixed, inviscid rheology with a cable, Supplementary Eq. (30).
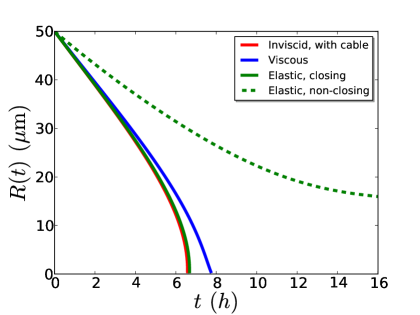
D: Effect of the variation of while , and are fixed, viscous rheology, Supplementary Eq. (31).
E: Effect of the variation of while , and are fixed, elastic rheology, Supplementary Eq. (32). When , closure is complete and characterized by a finite closure time only below a value of above which elastic forces are strong enough to stop epithelization.
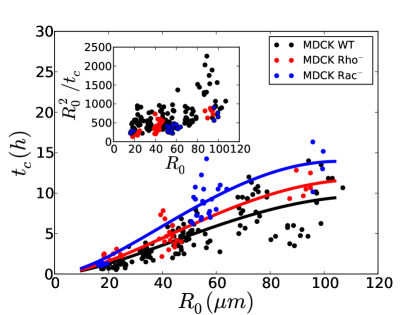
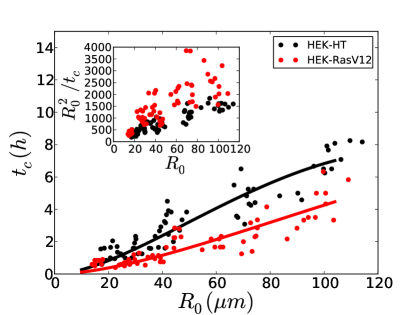
A-B: Closure time (filled circles) as a function of the initial effective radius , fitted by equation (1) (solid curves) with the constraints . One circle corresponds to one wound.
A: MDCK wounds. Wild Type (, , ), Rho- assay (, , ) and Rac- assay (, , ).
B: HEK-HT assay (, , ) and HEK-RasV12 assay (, , ).
C-F: Epithelization coefficient and cut-off radius . C, D: MDCK wounds. E, F: HEK wounds. Error bars correspond to confidence level.
![[Uncaptioned image]](/html/1402.5060/assets/F1.jpg)
![[Uncaptioned image]](/html/1402.5060/assets/x1.png)
A
![[Uncaptioned image]](/html/1402.5060/assets/x2.png)
B
![[Uncaptioned image]](/html/1402.5060/assets/x3.png) C
C
![[Uncaptioned image]](/html/1402.5060/assets/x4.png) D
D
![[Uncaptioned image]](/html/1402.5060/assets/x5.png) E
E
![[Uncaptioned image]](/html/1402.5060/assets/x6.png)
![[Uncaptioned image]](/html/1402.5060/assets/x7.png)
Supplementary Information
I Materials and methods
I.1 Cell culture
MDCK wild type cells were cultured in Dulbecco’s modified Eagle’s medium (Gibco) supplemented with FBS (Sigma), mM L-glutamin solution (Gibco) and antibiotics solution [penicillin ( units/mL) + streptomycin ( mg/mL), Gibco] at C, CO2 and humidity. The LifeAct-GFP transfected cells were cultured in the same medium, supplemented with g/mL geneticin (Invitrogen). Other derived MDCK lines were used (histone-mCherry, cadherin-GFP, actin-GFP) and were cultured in the same way as the LifeAct-GFP line.
HEK-HT-wild type cells were cultured in Dulbecco’s modified Eagle’s medium (Gibco) supplemented with FBS (Sigma), mM L-glutamin solution (Gibco), antibiotics solution [penicillin ( units/mL) + streptomycin ( mg/mL), Gibco], g/mL hygromycin solution (Life Technologies) and g/mL geneticin (Invitrogen) at C, CO2 and humidity. The HEK-HT-RasV12 cells were cultured in the same medium, supplemented with g/mL puromycin solution (Life Technologies).
The various inhibitors (Y-27632 (Sigma), C3-transferase (Tebu-bio) and NSC-23766 (Tocris)) were perfused in the flow chamber h before removing the PDMS template. We used concentrations of M for Y-27632, g/mL for C3-transferase and M for NSC-23766.
I.2 PDMS pillars preparation
The PolyDiMethylSiloxane (PDMS, Sylgard 184, Dow Corning) pillars were molded on a photoresist template obtained by classic lithography techniques. m and m-thick circular structures were fabricated in negative photoresist (SU8-2100, Microchem) by photolithography. Uncured PDMS was then poured on this template and mm spacers were used to constraint the height of the whole structure. It was then cured in a C oven over night. With this technique, thousands of pillars of different radii can be manufactured at once. This PDMS stamp was then manually cut to the right dimension for each experiment.
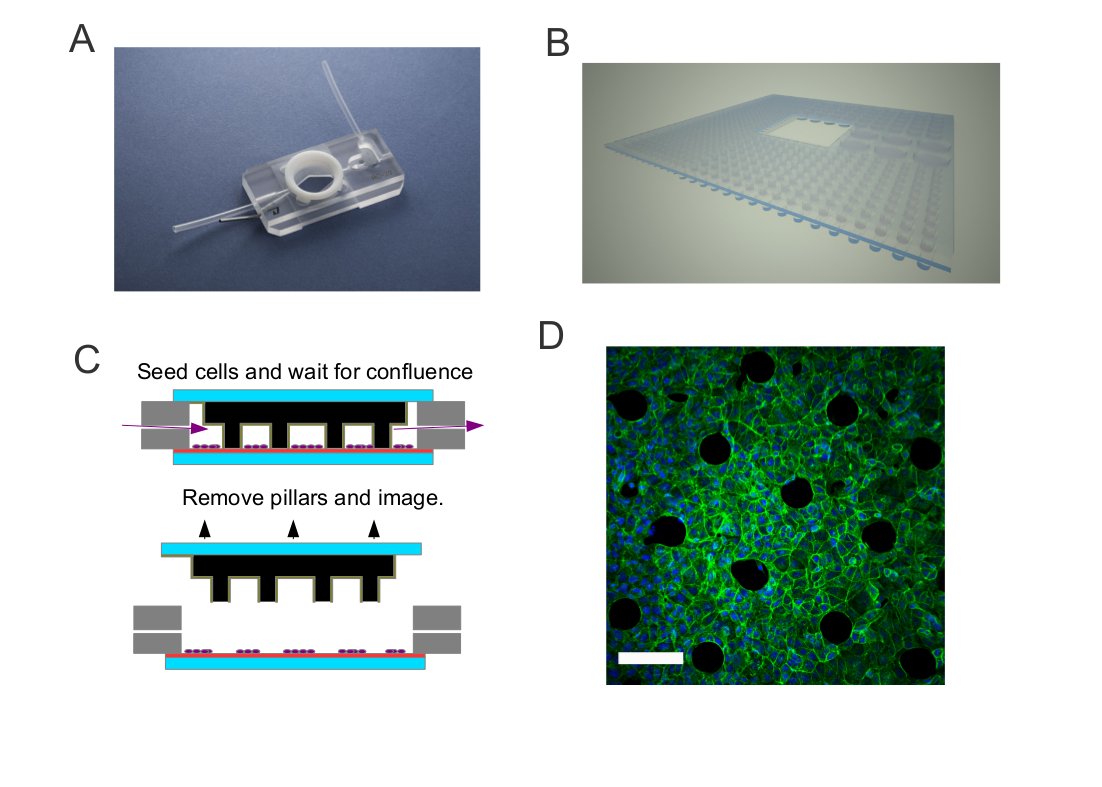
A: Picture of the flow chamber (Warner Instruments, model RC-20h).
B: Schematics of the PDMS template.
C: Schematics of the protocol. Cells are allowed to reach confluence before the template is removed.
D: MDCK wounds (m) were fixed while constrained under the template and labeled for F-actin (green) and nuclei (blue). Scale bar: m.
I.3 Experimental protocol
Cells were cultured in a small volume flow chamber (Warner Instruments, RC20-h model, Fig. 5). The chamber is sealed on top and bottom by mm glass coverslips (Delta). The bottom coverslip was treated with g/mL fibronectin (Life Technologies) in PBS at room temperature for one hour before being added to the chamber. The top coverslip was irreversibly bounded to the PDMS template by treating them both for s in an air plasma. They were then both treated with poly L-lysine-Polyethylene Glycol (PLL-PEG, Susos) at mg/mL for minutes to ensure that cells did not adhere to the pillars. The chamber was then hermetically sealed with silicone high vacuum grease. Cells were then seeded in the chamber at high concentrations ( cells/L) and allowed to adhere for one hour. Medium was then manually renewed every min to ensure proper growth underneath the template. Under these conditions, the cells reached confluence after h growth, the PDMS template was then delicately removed with the top coverslip and fresh medium was added to the chamber before imaging. Throughout this study, the initial time corresponds by convention to the time when the first image was acquired, unless explicitly mentioned otherwise.
I.4 Image acquisition and treatment
The dynamics of closure were imaged in phase contrast on an Olympus IX-71 inverted microscope equipped with thermal and atmospheric regulation (LIS). Images were acquired by a CCD-camera (Retiga 4000R, QImaging) and the setup was controlled by Metamorph (MetaImaging). The typical delay between two successive images was set between min and min depending on the initial sizes of the wounds and we used x and x objectives. Confocal imaging of either live or fixed cells was performed under a LSM 710 NLO inverted confocal microscope (Zeiss) equipped with thermal and atmospheric regulation. Images were then treated using ImageJ Note1 and the free surface was computed through a masking algorithm based on a Fourier filter, an edge detection algorithm and, finally, binarization of the resulting image. This process proved robust. However, we checked by hand on several significative examples that the apparent distribution of initial radii (Fig. 4A) for one wound size resulted from the margin of error of this technique and from intrinsic variability and not from an actual distribution of initial radii that could have been due to variations in the microfabrication process. The raw data on closure dynamics was then analysed with Matlab (Mathworks).
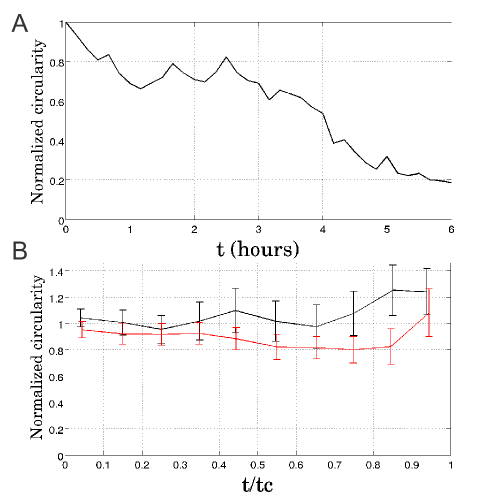
A: Plot of the normalized circularity (Eq. (2)) vs. time of the large wound in Supplementary Movie 1 (m, red curve). The measurement stops when the fingers merge at h.
B: Plot of the normalized circularity vs. normalized time , for the smallest (m, , black curve) and the largest initial radii (m, , red curve) of the small wounds. Error bars indicate the s.e.m.
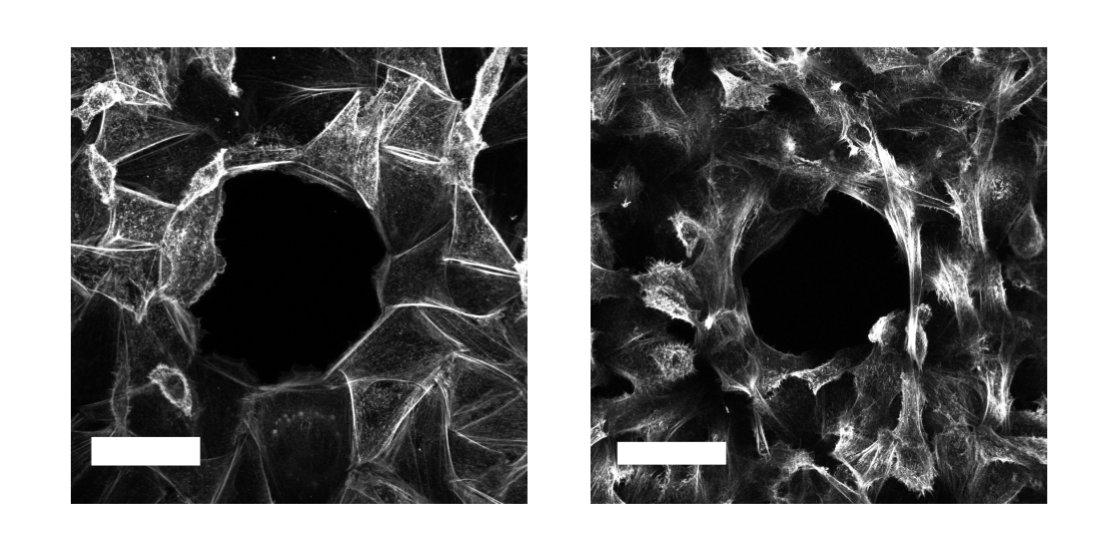
HEK-HT (left) and HEK-RasV12 (right) wounds (m) were allowed to close for min and were then fixed and stained for F-actin with phalloidin. Numerous lamellipodia of different numbers and sizes are observed in both cases. Scale bar: m.
I.5 Circularity measurements
Wound shape was quantified by the circularity
| (2) |
where and denote respectively the perimeter and the area of the wound at time . This definition yields for a perfect circle, for a fractal structure with finite area but infinite perimeter, and in general for a closed curve. However, this measurement depends on the resolution of images, due to pixelization artifacts Bottema2000 . We therefore normalized the circularity of each wound by its initial value (Fig. 6).
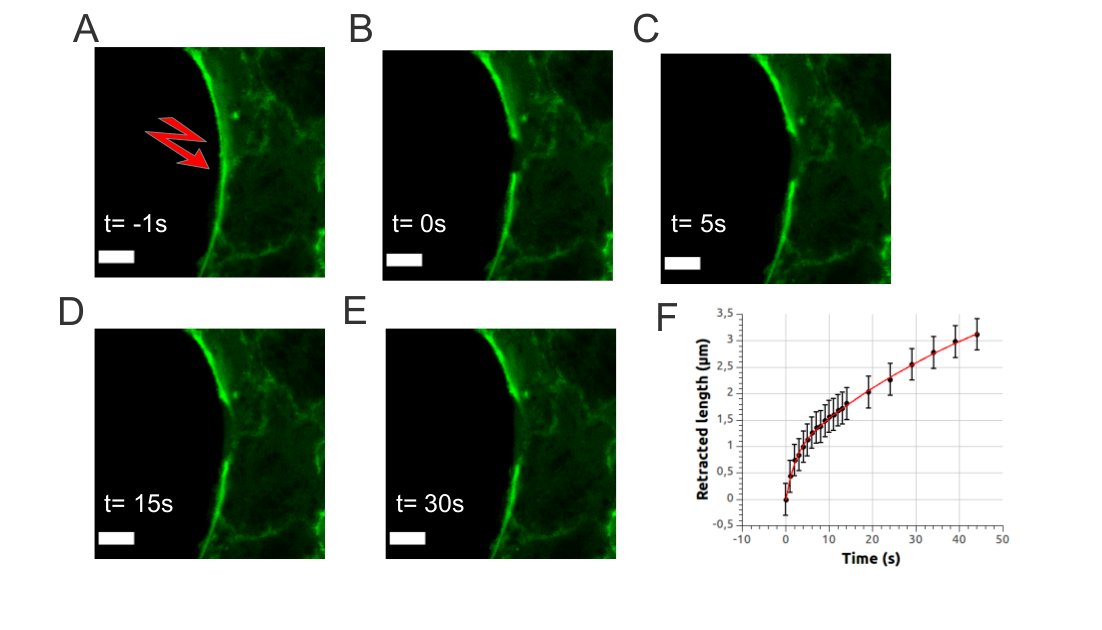
A-E: Timelapse of the retraction of an acto-myosin cable after laser ablation (MDCK-LifeAct-GFP wound, m), imaged through confocal microscopy at s, s, s, s and s. Here s corresponds to the first image acquired immediately after ablation. Scale bar: m.
F: Retraction dynamics of one of the severed ends of the cable (black circles) with a double exponential fit (red curve) . The fit yields two characteristic times, s and s and two retraction lengths, m and m.
I.6 Immunofluorescent stainings
Cells were fixed with paraformaldehyde for min, permeabilized with Triton-X100 for min, saturated in PBS supplemented with FBS for min. Myosin labelling was performed by incubation for one hour with a rabbit anti-phospho Myosin Light Chain antibody (Ozyme) at : before staining for one hour with a Cy-3 conjugated donkey anti-rabbit (Ozyme) used at :. Actin was stained with an alexa488-conjugated phalloidin (Life Technologies) at :. Finally, the cells were mounted using Anti Fade Gold Reagent with DAPI (Life Technologies). The samples were then imaged on a LSM 710 NLO inverted confocal microsope (Zeiss), see Fig. 7).
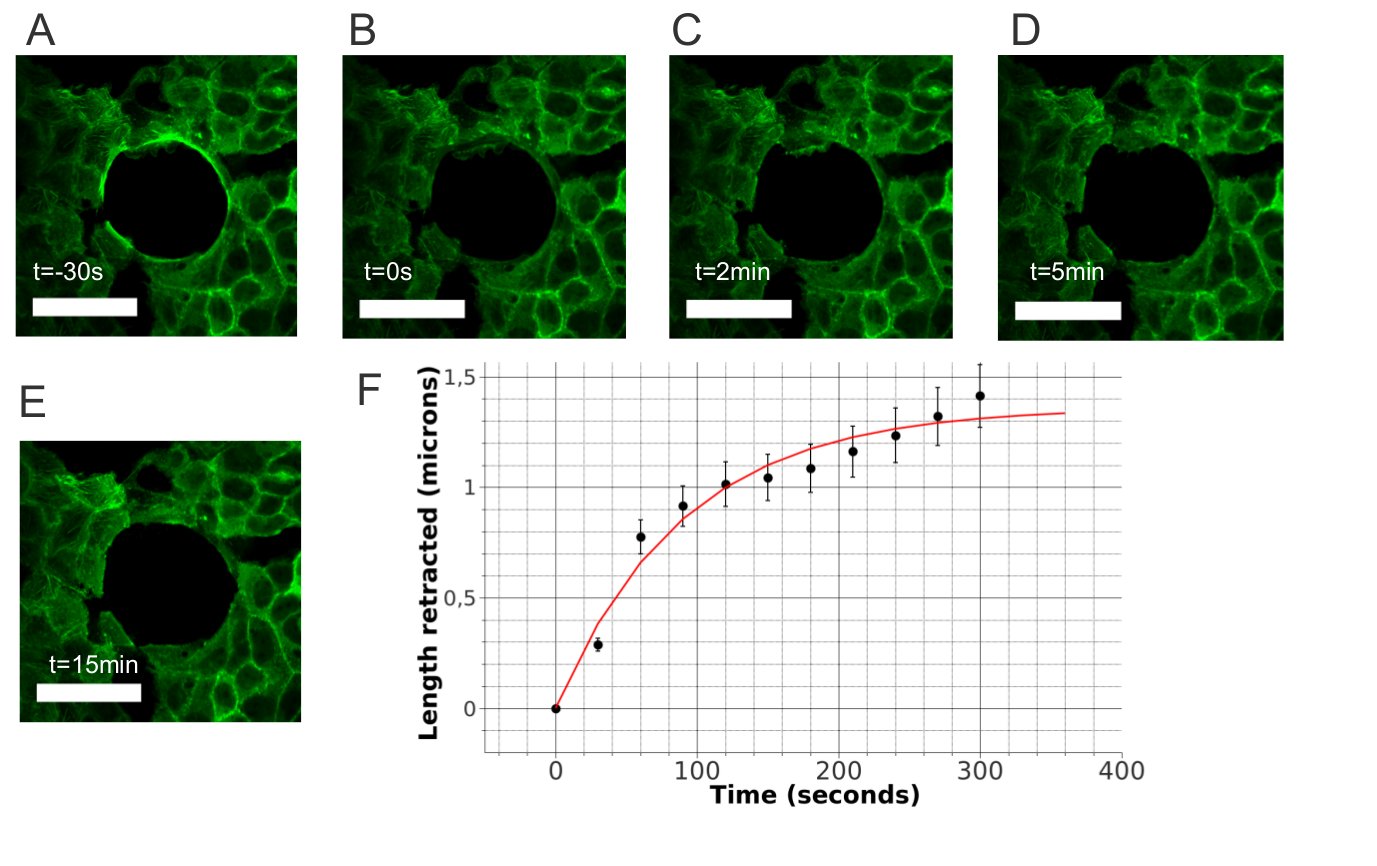
A-E: Timelapse of the retraction of the wound edge after laser ablation of the circumferential cable (MDCK-LifeAct-GFP wound, m), imaged through confocal microscopy at s, s, min, min and min. Here s corresponds to the first image acquired immediately after ablation. Scale bar: m. The actin cable was clearly apparent before ablation.
F: Plot of the retracted wound radius as a function of time (black circles), fitted by an exponentially decaying function of time (red curve). We obtain a retracted length of m and a retraction time of s.
I.7 Laser ablation
Laser ablation experiments were performed under a LSM 710 NLO (Zeiss) inverted confocal microscope with a x objective. The microscope was coupled to a femtosecond pulsed (pulse duration shorter than fs) 2-photon Mai-Tai HP laser (Spectra Physics). For ablation, the wavelength and output power were respectively set at nm and around W. Between ten and twenty iterations of the ablation were applied to a zone drawn by hand through the Zen software (Zeiss) leading to a pixel dwell between s and s.
We first performed local ablations, and recorded the time course of the retracted length of the cable (Fig. 8). Rather than using one exponentially decaying function of time, fitting by the sum of two exponentially decaying functions provided better agreement with data. The two characteristic times, of the order of seconds and minutes respectively, differed by an order of magnitude, indicative of two distinct relaxation processes (see also Landsberg2009 ).
To test whether the cable exerted forces inwards, we performed a full ablation of the cable (Fig. 9): the entire edge of the wound retracts, with a single relaxation time longer than a minute. We thus hypothesize that for local ablation the longer time scale arises from relaxation at the scale of the tissue whereas the shorter one pertains to the linear retraction of the cable. After ablation, the circumferential cable re-assembles on a time scale of the order of min.
Together these observations show that the cable exerted inward forces and thus could contribute to force generation during closure.
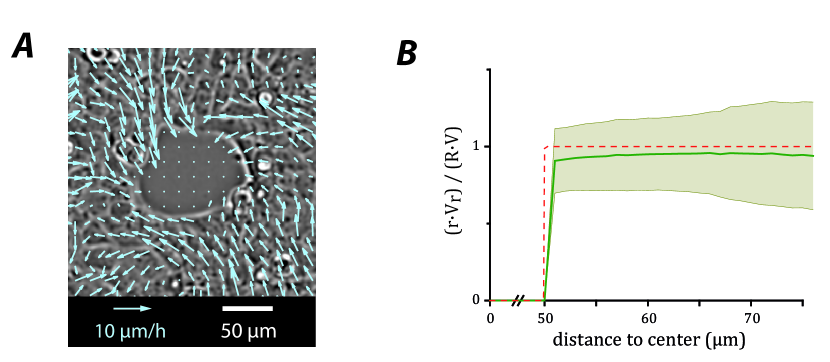
A: Snapshot of the epithelial velocity field (wild-type MDCK wound, m, h).
B: Plot of the ensemble-averaged ratio vs. radius (solid green line, ), where is the angle-averaged radial velocity component, and and respectively denote the effective margin radius and velocity. The shaded area gives the average value standard deviation. The radial velocity profile of an incompressible epithelial flow reads (Eq. (7)), plotted as a dashed red line for comparison.
I.8 Measurements at the scale of the epithelium
The velocity fields around the wounds were obtained through classic correlation-based Particle Image Velocimetry analysis Petitjean2010 . The center of mass of the wound was determined at each time with ImageJ to compute the radial averages. Our measurement is consistent with a radial velocity component decaying as (Fig. 10, see also Eq. (7)).
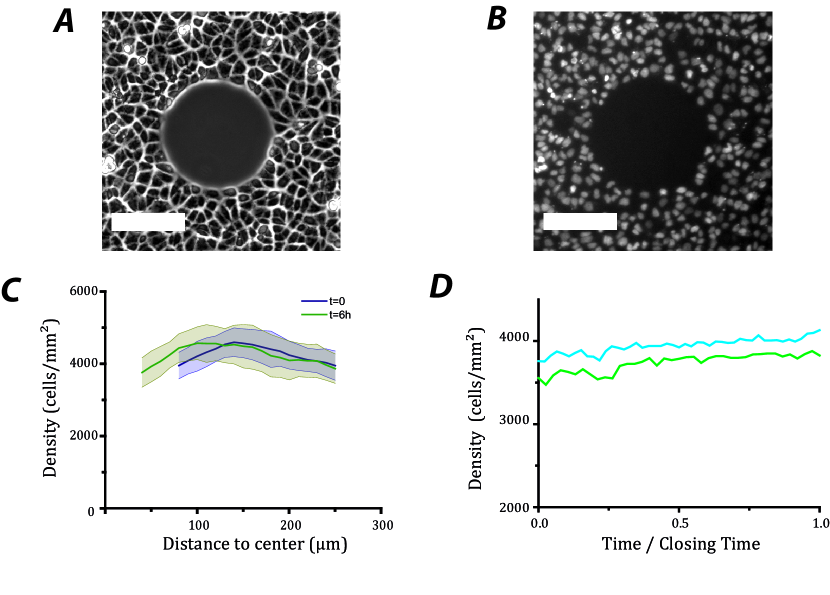
MDCK cells expressing histone-mCherry are viewed in phase contrast (A) and in epifluorescence (B). Scale bar: m, m.
C: Radial cell density profile at h and h. The shaded areas give the average value standard deviation.
D: Plot of the mean cell density in the entire field of view as a function of time for two wounds (m). The relative increase in density is of the order of during closure.
To measure the epithelial cell density, we used a cell line constitutively expressing histone-mCherry to label nuclei. Using Matlab, the position of the center of each nuclei was then determined. To create a density map, the map of the centers of the nuclei was convoluted by a x m window while taking care to avoid the cell-free patches. For each pixel, we thus computed the number of nuclei found in this m wide window around that pixel divided by the surface of the intersection of this window with the tissue. The automated nucleus detection algorithm also allows for a simple count of the number of cells in the field of view at any time point.
The measured cell density is approximately uniform in space (within error bars, Fig. 11C). It increases by less than over the course of closure (Fig. 11D), consistent with typical cell division times of the order of the duration of closure ( h) for the relevant cell densities Puliafito2012 .
II Model
A diversity of theoretical descriptions of wound healing have been put forward in the literature, with various assumptions aimed at describing various conditions Nagai2009 ; Ouaknin2009 ; Bindschadler2007 ; Murray1988 ; Sherratt2002 ; Sadovsky2007 ; Almeida2009 ; Lee2011 ; Mi2007 ; Arciero2011 . Cell-based descriptions include applications of the vertex Nagai2009 and Potts Ouaknin2009 models, as well as agent-based models Bindschadler2007 . Early continuous descriptions include classical biomathematical studies, reviewed in Murray1988 ; Sherratt2002 . Elastic models of a contractile epithelium subject to an external elastic force are investigated in Murray1988 ; Sadovsky2007 , while quasistatic elasticity with driving border forces is treated in Almeida2009 . In Lee2011 , a cell monolayer is modeled as a compressible, active (Maxwell) viscoelastic liquid with polar order. Collective migration driven by border forces is studied with a model of a cell layer as a compressible inviscid fluid including cell divisions and deaths, in one spatial dimension in Mi2007 , and in two dimensions in Arciero2011 , where the free boundary problem is solved using a level set method.
Here, we formulate a simple continuum mechanics description of wound closure, where we take advantage of our experimental observations that (i) cell division and death are negligible during the time of wound closure, (ii) there is no apparent orientational order of the cells, (iii) the wound shape remains approximately circular over the course of the experiment, and (iv) the flow is incompressible. We first detail our theoretical description (section II.1), before we study three different epithelial rheologies, based on constitutive equations for either a simple inviscid or viscous liquid (sections II.2 and II.3, respectively) or an elastic solid (section II.4). Each rheology allows to obtain an analytical expression for the closure dynamics of the circular model wounds created by the experimental protocol.
II.1 Continuum mechanics epithelization
In order to understand wound closure dynamics on the scale of the epithelium, we aim at describing stresses and strains on large length scales, as compared to the cell size. Using continuum mechanics, we formulate an effective two-dimensional description of epithelization that takes into account the macroscopic tissue material properties.
Conservation of cell number in the epithelium is expressed by
| (3) |
where is the cell number density, the tissue velocity field, and and are the rates of cell division and cell death, respectively. By convention, greek indices denote vector components, and are summed when repeated. We assume in the following, consistent with our experimental observations that both cell division and cell death are negligible during the time course of wound closure. Furthermore, the cell number density is approximately constant (Fig. 11). The cell number balance equation then becomes a constraint on the tissue flow field, : the flow is incompressible (Fig. 10).
In a continuous material, mechanical forces are balanced locally if inertial terms can be neglected, as is the case here. Force balance is then expressed as
| (4) |
where internal forces are described by the stress tensor , and denotes external forces. Here, the external force is due to friction with the substrate, and with being a friction coefficient we write . Together with a constitutive equation for the stress tensor and appropriate boundary conditions, Eq. (4) allows to solve for the deformation and cell flow field in the epithelium. The constitutive equation for the stress tensor accounts for the tissue material properties. In general, the stress tensor can be decomposed into an isotropic part and a deviatoric (traceless) part according to
| (5) |
where denotes Kronecker’s symbol, and by definition.
In the following, we consider an epithelium where a model wound with initial radius is created at , centered about the origin . We assume that the circular shape is preserved during the closure process and denote by the wound radius at time (Fig. 3A). The wound closes because of forces exerted at the margin, either by actively pulling cells or by an acto-myosin cable that spans over the whole perimeter. Using polar coordinates, the stress boundary condition at the margin reads
| (6) |
where is a protrusive stress that accounts for forces exerted by the cells at the wound margin, and is a tension that describes purse-string forces due to an acto-myosin cable around the wound. Introducing the length scale , we expect that the purse-string mechanism (resp. the protrusive forces) will dominate the dynamics at scales smaller (resp. larger) than .
Assuming rotational invariance of the flow allows to express the velocity field as , where the non-vanishing radial component depends only on the distance relative to the center of the initial wound. Using the incompressibility constraint , we obtain , where can be determined from the kinematic boundary condition at the margin. Since , we can express in terms of and the wound radius only
| (7) |
Using this expression with Eqs. (4) and (6) allows to find a dynamical equation for the wound radius . In the following sections, we derive and solve this dynamical equation—or rather the inverse problem t = t(R)—for three different constitutive equations, each highlighting a different epithelial rheology.
II.2 Inviscid fluid
For simplicity, we first assume that the epithelium behaves as an incompressible, inviscid fluid on the relevant time and length scales. In this case, the stresses are purely isotropic and do not depend on tissue viscosity or elasticity. In the incompressible limit, the isotropic part of the stress becomes a Lagrange multiplier which is determined from the mechanical boundary conditions, and we simply write . The stress tensor thus reads
| (8) |
where is the pressure field at the scale of the epithelium. Using rotational invariance () and Eq. (7) for the velocity field, the force balance (4) becomes . The pressure follows as , where is a function of time. Note that in principle, is determined by the boundary condition at , which is an ill-defined limit in two dimensions. We therefore introduce a constant, long-range cut-off at which the pressure vanishes and write
| (9) |
Since and , the pressure is negative: the epithelium is under tension.
A dynamical equation for the wound radius follows from the stress boundary condition at the margin, Eq. (6), and with the above expression for we find
| (10) |
Using the characteristic length , we rewrite the evolution equation as
| (11) |
Integration yields the function , with
| (12) |
Here, we introduce the epithelization coefficient , which has the dimension of a diffusion coefficient, and Li2 stands for the dilogarithm function defined as . The integration constant is determined by the initial condition . Since , the closure time is finite: .
When the contribution of the acto-myosin cable is negligible, , the expression for simplifies to
| (13) |
and the closure time follows as
| (14) |
in the same limit. This result implies that under the above assumptions, i.e., for an inviscid epithelium, the closure of a circular model wound completes in a finite time, independently of whether a contractile cable contributes to force production or not.
II.3 Viscous fluid
Taking into account viscous stresses, the deviatoric stress tensor is given by
| (15) |
where is an effective tissue shear viscosity and is the traceless part of the velocity gradient tensor . The isotropic part of the stress becomes again a Lagrange multiplier, and we write as before. Incompressibility also implies that , and thus .
Taking into account rotational invariance, the radial component of the force balance (4) reads
| (16) |
Inserting the constitutive equations, we obtain as before . Expression (9) for the pressure field is therefore unchanged. With , the boundary condition (6) now leads to
| (17) |
Introducing the length scale , integration yields
| (18) |
with
| (19) |
In the limit of vanishing viscosity, , the above expression reduces to Eq. (12), consistent with the assumption of vanishing deviatoric stresses in the inviscid case.
The closure time is again finite, , and tends to expression (14) in the limit where both and are negligible. However, if remains finite, the closure time diverges in the limit . The model predicts that, in the absence of a contractile cable, circular model wounds do not complete closure in finite time when viscous stresses in the epithelium cannot be neglected. This somewhat surprising result is an artifact of the continuous description: in fact closure will complete, thanks to cell-scale mechanisms not taken into account by the model, as soon the wound radius is smaller than a microscopic cut-off length , with a finite closure time of the order of .
II.4 Elastic solid
When deformations are small, the constitutive equation for an incompressible elastic material reads
| (20) |
where is the shear elastic modulus and is the traceless part of the strain tensor. The latter is defined as for a displacement field . Incompressibility implies that , and thus . In this limit, the isotropic stress becomes again a Lagrange multiplier and we write .
In the case of rotational invariance, we can express the elastic displacement field as . Using the incompressibility condition together with the boundary condition , we obtain as a function of and ,
| (21) |
One can check that this expression verifies at all times . The differential equation for resulting from force balance is again unchanged, is given by Eq. (9). Since the radial stress in the epithelium is given by
| (22) |
the stress boundary condition (6) yields the following dynamical equation for the wound radius
| (23) |
Formally, elastic restoring forces and forces driving epithelization balance at the equilibrium radius with
| (24) |
Taking into account the initial condition , integration of Eq. (23) yields
| (25) |
where is given by
| (26) |
Here, has the dimension of a diffusion coefficient, and differs from the epithelization coefficient by a factor of . In the limit of vanishing elastic modulus ( and ), expression (26) for reduces to the one obtained for an inviscid fluid as given by Eq. (12). Of course only positive values of the radius are physical and closure stops when .
The above result for implies that the wound closure eventually completes whenever . This is the case for large enough values of the line tension , i.e., . The closure time is then given by . In the particular case where line tension and elasticity balance exactly, and thus , Eq. (26) reduces to Eq. (13), and the closure time follows as given by Eq. (14) with the substitution .
When the equilibrium radius is positive but small, , where is of the order of the size of a cell, epithelization may proceed to a scale small enough that microscopic mechanisms, not accounted for within the continuous description, terminate the epithelization process. This might be the case even for small values of the line tension provided that the protrusive stress dominates the elastic modulus, (see Eq. (24)).
When the epithelial elastic modulus is large enough ( and ), the equilibrium radius is strictly positive: wound closure halts due to elastic forces. Expression (26) takes complex values when . However, the identity
| (27) |
allows to rewrite as
| (28) |
where all terms are real-valued for . In this case the closure time is infinite.
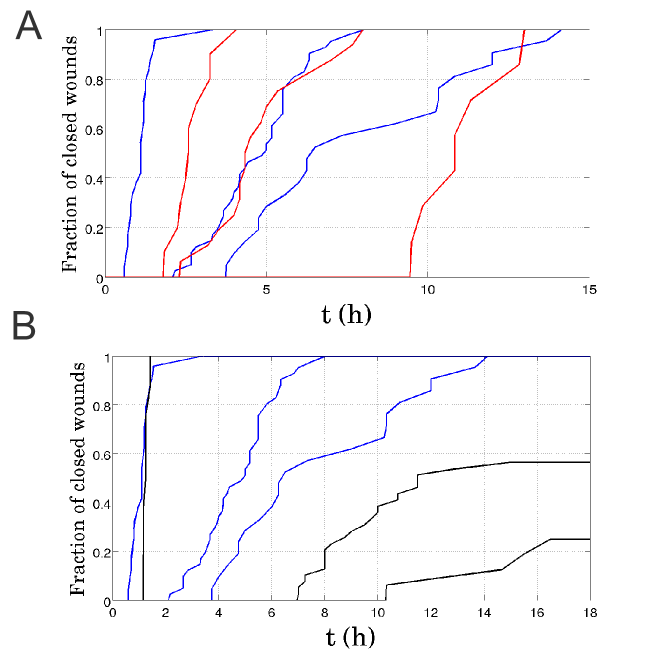
A: comparison between wild-type (blue curves, , and respectively) and Rho- assays (red curves, , and respectively), m, m and m from left to right.
B: comparison between wild-type (blue curves, same data as in A) and Rac- assays (red curves, , and respectively), same sizes from left to right. A fraction of the Rac- wounds do not complete closure within the observation time h.
III Data analysis
A
 B
B
A: MDCK wounds. Wild Type, Rho- and Rac- assays. The physical parameters of epithelization are given within a confidence interval. MDCK WT (): , ; MDCK Rho- (): , ; MDCK Rac- (): , ;
B: HEK-HT and HEK-RasV12 wounds. HEK-HT (): , ; HEK-RasV12 (): , .
Insets: for all cell types and conditions, the ratio of initial effective area over closure time increases with initial radius .
In section II, we obtained analytical expressions of and , corresponding to different epithelial rheologies. In order to estimate the physical parameters of the epithelia, we now fit experimental data by these expressions, using the Levenberg-Marquardt algorithm for nonlinear least-squares fitting, implemented in Python Note2 . We successively examine fits of closure times vs. initial effective radii in section III.1 and fits of individual trajectories in section III.2. Finally, we discuss the values of physical parameters thus estimated in section III.3.
III.1 Closure time data
The closure time is a robust quantity that depends only weakly on the image analysis method: at a given time , the wound is either open or closed. The experimental uncertainty on is of the order of the time resolution of data acquisition, between and minutes depending on the size of the wound. Fig. 12 gives the empirical cumlative distribution functions of closure times for MDCK wounds, including the effect of inhibitors.
Fig. 13 shows that closure time data pertaining to all cell types and conditions is well fitted by Equation (14), obtained for an inviscid epithelium without cable. Of note, experimental data plateaus for m. This behavior is not consistent with a simple scaling relationship where the closure time would be proportional to the initial area , as proposed in Anon2012 .
We now ask whether this simple description is robust, and consider this question in the case of MDCK wild-type wounds, for which the number of wounds is largest (). As shown in section II, different assumptions made on the epithelial rheology lead to different expressions of the closure time as a function of the initial radius . Although an inviscid epithelium may close without cable, strictly speaking, both a viscous and an elastic epithelium require a finite line tension () for closure to reach completion.
For convenience, we summarize below the analytical expressions obtained for :
-
-
inviscid liquid, without cable (, ):
(29) -
-
inviscid liquid, with cable (, ):
(30) -
-
viscous liquid, with cable ():
(31) -
-
elastic solid, with cable (, ):
(32)
A
 B
B
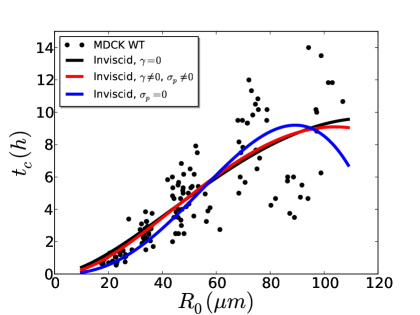
A Border forces. The closure time is plotted as a function of the initial effective radius (black circles), and fitted by analytical expressions obtained when the epithelium is modeled as an inviscid fluid:
- Equation (29): black line, , constraints , fitted parameter values , ;
- Equation (30): red line, , constraints , fitted parameter values , , ;
- Equation (33): blue line , , constraints , fitted parameter values , .
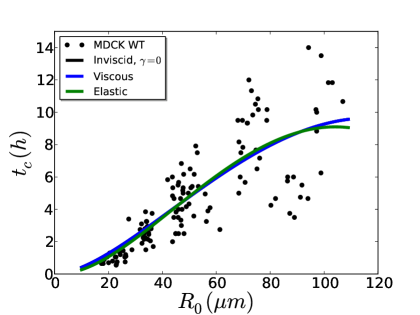
B Tissue rheology. The closure time is plotted as a function of the initial effective radius (black circles), and fitted by analytical expressions obtained when both lamellipodial protrusions and an actomyosin cable are taken into account ():
- Equation (29): black line, inviscid fluid as in A;
- Equation (31): blue line, viscous fluid, constraints , the (blue) fitted curve cannot be distinguished from the black curve, with identical parameter values of and , and .
- Equation (32): green line, elastic solid, constraints , the fit yields , , , , from which we deduce .
First, we investigate whether cable tension may significantly contribute to force production at the margin (Fig. 14A). Fitting closure time data with expression (30), obtained for an inviscid epithelium with a cable, we find that:
-
-
values of and are consistent within error bars with those obtained without a cable;
-
-
the length scale is small compared to (), as well as to the wound radius () except in the late stages of closure Anon2012 .
When the epithelium is modeled as an inviscid fluid, we conclude that the contribution of the actomyosin cable to the stress boundary condition is negligible. For the sake of completeness, we investigate the case where protrusive forces are small compared to the cable tension (). In this case, the closure time is given by
| (33) |
which follows from integration of Eq. (10) with . This expression fits the closure time data rather poorly (Fig. 14A): protrusive forces at the margin cannot be neglected.
Second, we ask whether neglecting viscous stresses in the epithelium is legitimate, and fit data with Eq. (31) (see Fig. 14B). We obtain:
-
-
values of and consistent within error bars with those found in the inviscid case without a cable;
-
-
a length scale , consistent with a zero value;
-
-
a viscous length scale , consistent with a zero value.
We conclude that the actomyosin cable can be neglected in this case as well (), and that dissipation is dominated by friction with the substrate (): epithelial viscosity can be neglected.
Finally, we study closure time data taking into account elastic stresses, and fit data with Equation (32), constraining the parameters , , , and to be positive. The fitted value of is consistent with zero: elastic forces are vanishingly small when compared to protrusive forces. In addition, the fitted values of , and are consistent with those obtained for an inviscid fluid when the cable line tension is taken into account. In this case, Equation (32) reduces to Equation (30).
Altogether, we find that the model of the monolayer as an inviscid fluid describes wild-type MDCK data satisfactorily, and that viscous and elastic contributions to the stress are negligibly small. Furthermore, the contribution of the cable to force production is small compared to that of lamellipodia. We hypothesize that the main function of the contractile circumferential cable is to stabilize the free epithelial boundary. Since in all cases considered, we neglect cable tension in the following and set unless explicitly specified otherwise.
A
 B
B
Plots of individual trajectories of the wound radius , .
A: Contribution of border forces for an inviscid fluid. Plots of as given by Eq. (13), , (black curve, without cable); and by Eq. (12) same values of and , (red curve, with cable).
B: Rheology. Plots of as given by Eq. (12) (red curve, inviscid liquid, same as in a); Eqs. (18-19), with (blue curve, viscous liquid); Eqs. (25-26), with (solid green curve, elastic solid, closing); Eq. (28), with (dashed green curve, elastic solid, non-closing); The values of , and are the same as in A.
III.2 Closure trajectories
In sections III.2.1 and III.2.2, we examine the individual trajectories of closing and non-closing wounds.
A
 B
B
 C
C
 D
D
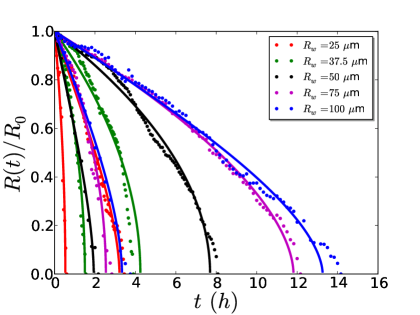
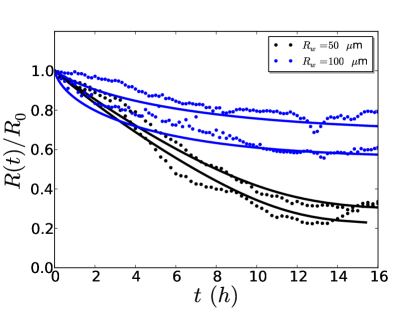
A, B: Fit of trajectories with Equation (13). For clarity, we show only two trajectories (circles) and their fits (solid curves) per pillar size , corresponding to the shortest and longest closure time observed at a given . The normalized effective radius is plotted as a function of time .
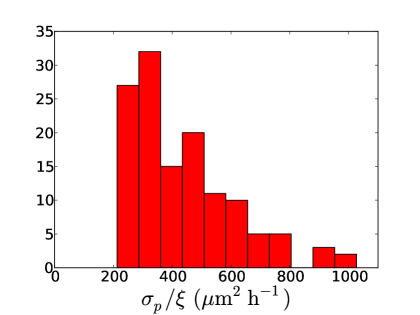
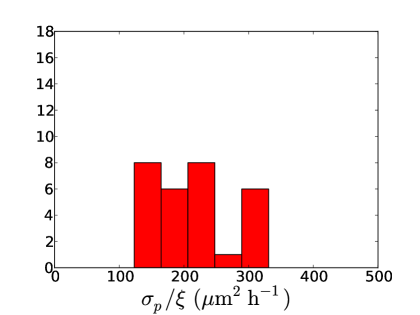
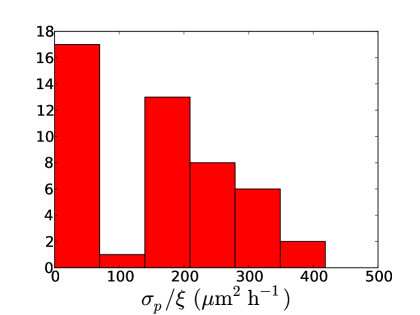
C, D: Histogram of estimates of the epithelization coefficient (see text for details).
III.2.1 Closing wounds
For brevity, we focus on MDCK-WT and HEK-HT wounds, and fit Equation (13) to data, using for convenience time as a function of radius . In Section III.1, we showed that the simplest model of the monolayer as an inviscid fluid driven by cell protrusions at the margin suffices to describe closure time data. We therefore fit trajectories using the same model (see Fig. 3a), obtain one set of physical parameters per wound, and check the consistency of our results.
Since was previously found to vary little, we constrain to belong to the confidence interval obtained from closure time data (see the caption of Fig. 13 for numerical values). The distributions of epithelization coefficients obtained by fitting Equation (13) to data are shown in Fig. 16, for MDCK-WT and HEK-HT wounds, with mean values standard deviations given by:
-
-
MDCK wild type wounds: ;
-
-
HEK-HT wounds: .
For both cell types, the confidence intervals obtained from fitting closure time data belong to the above intervals: the two measurement methods are consistent. Trajectories are noisy, due to intrinsic variabity, but also to possible pixelization errors when determining the area of the cell-free domain. Fitting individual trajectories leads to a higher dispersion of estimated parameter values. We therefore prefer to use closure time data for parameter estimation whenever closure is complete.
III.2.2 Non-closing wounds
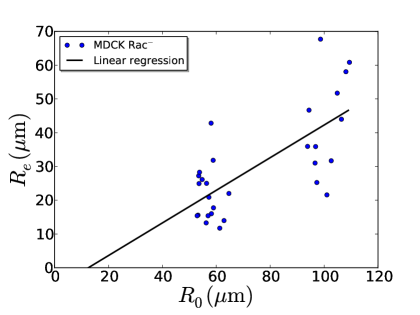
We finally turn to the non-closing wounds observed in MDCK Rac- assays. Among the models presented in Section II, the only case where the final radius is strictly positive is that of an elastic epithelium with , or . In Fig. 17A, we show that individual trajectories are fitted satisfactorily by Equation (28). The equilibrium radius increases with the initial effective radius (Fig. 17B), as predicted by Equation (24). A linear regression of vs. yields the estimates
| (34) | |||||
| (35) |
From (34), we deduce that . Assuming that the Rac pathway has a limited influence on the epithelial elasticity, this suggests that Rac inhibition leads to lower values of the protrusive stress (compared to wild type assays), of the order of the elastic modulus. Since , Equation (35) yields m: the actomyosin cable contributes significantly to force production in non-closing Rac- assays when, e.g., m.
A
 B
B
 C
C
 D
D
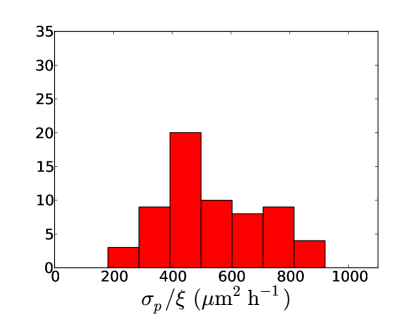
A-C: Non-closing wounds
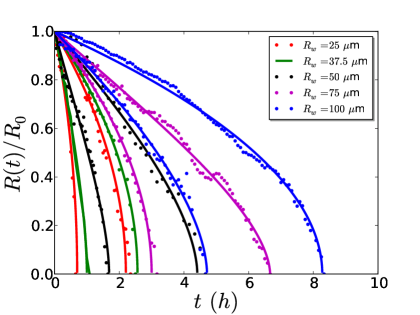
A: Trajectories. Normalized effective radius as a function of time . For illustrative purposes, we show only two trajectories per pillar size (solid curves) and their fit by Equation (28) (dashed curves), with the constraints , (confidence interval obtained from closure time data), (Equation (28) is defined only for ).
B: Equilibrium Radius (estimated as ) vs. initial radius . The linear regression line (black solid line, ) has coefficients , m.
C: Histogram of parameter estimates. The epithelization coefficient is estimated as (from ), where is obtained by nonlinear curve fitting of the trajectory, as in (a).
D: Closing wounds. Histogram of the epithelization coefficient. Closing trajectories are fitted as in Fig. 3b.
Fitting non-closing trajectories, we obtain estimates of the coefficient . Using , we expect that . In Fig. 17C, we plot the histogram of epithelization coefficients defined for simplicity as . We find (mean value standard deviation, ). Fitting Rac- closing trajectories with Equation (13) for an inviscid epithelium, we obtain (), a value slightly higher than the previous estimate obtained for non-closing wounds. Note that both estimates are consistent with that obtained from fitting time closure data.
A balance between driving forces at the margin and a bulk elastic restoring force explains the positive value of the equilibrium radius observed in these assays. A word of caution seems however in order. Although plateaus on a time scale of the order of h, one cannot exclude that a “non-closing wound” may in fact heal completely on a time scale much longer than the available observation time, over which cell divisions may become relevant and need to be taken into account.
III.3 Physical parameters of epithelization
The epithelization coefficient estimated for wild type MDCK wounds was of the order of , or . Using the order of magnitude of cell protrusive forces nN Prass2006 , the two-dimensional protrusive stress is of the order of , where is the typical lateral extension of a cell. Using , we find . We then deduce the order of magnitude of the friction coefficient , here for a cell monolayer on a glass substrate. Interestingly, this value is consistent with that proposed in Arciero2011 , using very different assumptions to model epithelization.
Compared to wild type MDCK assays, the epithelization coefficient adopted a lower value under Rho inihibition, and was further reduced by Rac inhibition. A lower value of the ratio corresponds to a lower value of and/or to a higher value of . In the case of Rac- assays, it is now well established that Rac is responsible, through the activation of the Arp2/3 complex, for actin polymerization at the leading edge of a migrating cell Hall1998 ; Jaffe2005 ; Etienne-Manneville2002 , which is necessary for force production by lamellipodia. The lower value of in Rac- assays may well be explained by this effect only. However, Rac inhibition may also modify the value of : indeed the Rac pathway is also known to be involved in the formation of focal contacts (see, e.g., Rottner1999 ).
On general physical grounds Schallamach1963 ; Gerbal2000 , a simple expression for the friction coefficient is given by , where , and respectively denote the average density of adhesive bonds, the bond spring constant, and the average binding time. These three quantities are related to the formation of adhesive bonds, to their maturation state and to their turnover. The influence of the Rho and Rac GTPases on these three mutally interacting biological processes is complex, often with antagonistic effects on any two of them Hall1998 ; Rottner1999 ; Danen2005 ; Etienne-Manneville2002 ; Jaffe2005 . On the basis of current knowledge, predicting the effect of Rho and Rac inhibition on epithelium-substrate friction seems very difficult, all the more so since conclusions drawn from single-cell motility assays may not carry over to the case of collective migration of a cell monolayer. Still, it has been shown that Rho is not implicated in the polarization of actin at the leading edge of a migrating cell and that its inhibition can even enhance motility in certain cell types Nobes1999 . We conjecture that the lower value of in Rho- assays may be due to a higher value of . This may be explained by the implication of Rho in regulating the turn-over of adhesion complexes, more stable under Rho inhibition, thus leading to a higher , and possibly to a higher Danen2005 . However, existing data regarding the effect of Rho on and is inconclusive: it has for instance been observed that Rho- assays lead to a lower integrin density Ballestrem2001 . Our measurement may be seen as direct evidence for the effect of Rho inhibition on the epithelium-substrate friction coefficient, and may be used as a basis towards a better understanding of the role plaid by the Rho GTPase in regulating the formation, the maturation, and the turn-over of cell-substrate adhesive bonds in epithelia.
Fits of closing and non-closing trajectories in Rac- assays showed that the epithelization coefficient was larger when closure is complete. Neglecting the cable line tension , the equilibrium radius reads . Our model suggests that closure is incomplete as soon as , where is the cellular length scale below which micro-scale mechanisms operate to terminate epithelization. For simplicity, we ignore the possible influence of Rac inhibition on the epithelial elastic modulus, through, e.g. the dynamics and density of cell-cell adhesions Etienne-Manneville2002 . The condition corresponds to a threshold value of the protrusive stress, , that increases with . Given the observed experimental variability, we expect the value of to fluctuate from wound to wound in a given Rac- assay. For smaller wounds, crossing the threshold is less likely: indeed the fraction of non-closing wounds is an increasing function of initial radius (Fig. 2C). Altogether, our analysis suggests that Rac inhibition lowers the ratio so that epithelial elasticity can no longer be neglected.
References
- (1) ImageJ software, http://imagej.nih.gov/ij/, Rasband, W.S., U.S. National Institutes of Health, Bethesda, Maryland, USA, 1997-2012.
- (2) Bottema, M. In IEEE International Conference on Acoustics, Speech, and Signal Processing. Proceedings, volume 6, 2247–2250 vol.4, (2000).
- (3) Landsberg, K. P. et al. Curr. Biol. 19, 1950–1955 (2009).
- (4) Petitjean, L. et al. Biophys. J. 98, 1790–1800 (2010).
- (5) Puliafito, A. et al. Proc. Natl. Acad. Sci. U S A 109, 739–744 (2012).
- (6) Nagai, T. and Honda, H. Phys. Rev. E 80, 061903 (2009).
- (7) Ouaknin, G. Y. and Bar-Yoseph, P. Z. Biophys. J. 97, 1811–1821 (2009).
- (8) Bindschadler, M. and McGrath, J. L. J. Cell Sci. 120, 876–884 (2007).
- (9) Murray, J. D., Maini, P. K., and Tranquillo, R. T. Phys. Rep. 171, 59–84 (1988).
- (10) Sherratt, J. A. and Dallon, J. C. C. R. Biol. 325(5), 557–564 (2002).
- (11) Sadovsky, A. and Wan, F. Y. M. SIAM 118, 365 – 395 (2007).
- (12) Almeida, L., Bagnerini, P., Habbal, A., Noselli, S., and Serman, F. Singularities in Nonlinear Evolution Phenomena and Applications, volume 9 of CRM Series, chapter Tissue repair modeling, 27–46. Edizioni Della Normale (2009).
- (13) Lee, P. and Wolgemuth, C. W. PLoS Comput. Biol. 7, e1002007 (2011).
- (14) Mi, Q., Swigon, D., Rivière, B., Cetin, S., Vodovotz, Y., and Hackam, D. J. Biophys. J. 93, 3745–3752 (2007).
- (15) Arciero, J. C., Mi, Q., Branca, M. F., Hackam, D. J., and Swigon, D. Biophys. J. 100, 535–543 (2011).
- (16) lmfit package, http://pypi.python.org/pypi/lmfit/, Least-Squares Minimization with Bounds and Constraints.
- (17) Anon, E. et al. Proc. Natl. Acad. Sci. U S A 109, 10891–10896 (2012).
- (18) Prass, M., Jacobson, K., Mogilner, A., and Radmacher, M. J. Cell Biol. 174, 767–772 (2006).
- (19) Hall, A. Science 279, 509–514 (1998).
- (20) Jaffe, A. B. and Hall, A. Annu. Rev. Cell Dev. Biol. 21, 247–269 (2005).
- (21) Etienne-Manneville, S. and Hall, A. Nature 420, 629–635 (2002).
- (22) Rottner, K., Hall, A., and Small, J. V. Curr. Biol. 9, 640–648 (1999).
- (23) Schallamach, A. Wear 6, 375–382 (1963).
- (24) Gerbal, F., Chaikin, P., Rabin, Y., and Prost, J. Biophys. J. 79, 2259–2275 (2000).
- (25) Danen, E. H. J., van Rheenen, J., Franken, W., Huveneers, S., Sonneveld, P., Jalink, K., and Sonnenberg, A. J. Cell Biol. 169, 515–526 (2005).
- (26) Nobes, C. D. and Hall, A. J. Cell Biol. 144, 1235–1244 (1999).
- (27) Ballestrem, C., Hinz, B., Imhof, B. A., and Wehrle-Haller, B. J. Cell Biol. 155, 1319–1332 (2001).
MOVIE 1. Closure of a large MDCK circular wound.
A MDCK-actin-GFP wound (m) is imaged
in epifluorescence for h. Scale bar: m.
Three leader cells formed at the edge of the wound and then drove
multicellular fingers hence deforming the initial circle
(Fig. 6). The fingers eventually met in the center
and the leader cells switched back to a classical epithelial phenotype.
The remaining secondary wounds then proceeded to heal in a much more regular
fashion without showing any formation of leader cells (Movie 2).
MOVIE 2. Closure of “secondary” wounds.
Close-up on the secondary wounds from the experiment seen in Movie 1,
imaged for h. Scale bar: m.
Neither leader cells and nor margin roughening are seen.
MOVIES 3-5. Closure of small circular wounds.
Three examples of time lapse movies made in phase contrast microscopy
showing the typical closure of a wound for, respectively:
-
•
wild type MDCK cells, m for h ; scale bar: m;
-
•
HEK-HT cells, m for h; scale bar: m;
-
•
HEK-RasV12 cells, m for h ; scale bar: m.
Direct inspection shows that the protrusive activity is enhanced in the last case, with a closure time shorter compared to a smaller wild type HEK wound.
MOVIE 6. Dynamics of lamellipodial activity.
A MDCK-LifeAct-GFP wound (m) was imaged by confocal
microscopy for h. Scale bar: m.
The optical slice was very close to the surface as this is the position
where lamellipodia develop. For this reason, stress fibers were apparent
but the membranes between cells were not. We observed a high number and
a large activity of these lamellipodia that could be recognized as waves
of actin in the bulk of the tissue. Of note, high laser power was needed
to observe these lamellipodia and the dynamics of closure was drastically
reduced in those experiments probably due to phototoxicity.
MOVIE 7. Laser ablation of the entire cable.
A MDCK LifeAct-GFP wound (m) is imaged by
confocal microscopy from min after removal of the pillars.
The actin cable is then fully ablated and the retraction of the edge is
imaged for min. Note the dynamic retraction of the edge of the wound.
Scale bar : m.
MOVIE 8. A non closing MDCK Rac- wound.
A MDCK wound (m) under Rac inhibition was imaged
in phase contrast. The movie runs for h. Scale bar: m.