The Mass-Independence of Specific Star Formation Rates in Galactic Disks
Abstract
The slope of the star formation rate/stellar mass relation (the SFR “Main Sequence”; –) is not quite unity: specific star formation rates () are weakly-but-significantly anti-correlated with . Here we demonstrate that this trend may simply reflect the well-known increase in bulge mass-fractions – portions of a galaxy not forming stars – with . Using a large set of bulge/disk decompositions and SFR estimates derived from the Sloan Digital Sky Survey, we show that re-normalizing SFR by disk stellar mass () reduces the -dependence of SF efficiency by dex per dex, erasing it entirely in some subsamples. Quantitatively, we find – to have a slope (depending on estimator and Main Sequence definition) for star-forming galaxies with and bulge mass-fractions , generally consistent with a pure-disk control sample (). That is (largely) independent of host mass for star-forming disks has strong implications for aspects of galaxy evolution inferred from any – relation, including: manifestations of “mass quenching” (bulge growth), factors shaping the star-forming stellar mass function (uniform for low-mass, disk-dominated galaxies), and diversity in star formation histories (dispersion in ). Our results emphasize the need to treat galaxies as composite systems – not integrated masses – in observational and theoretical work.
1. Introduction
The observation of a correlation between galaxy star formation rates (SFRs) and stellar masses () has generated considerable interest. Seen from to (e.g., Brinchmann et al., 2004; Daddi et al., 2007; Wuyts et al., 2011; Guo et al., 2013, and references therein), this SFR ‘‘Main Sequence" (MS) may encode fundamental information about galaxy evolution.
Uncontroversial is the fact that the MS has fallen monotonically since at least (e.g., Noeske et al., 2007; Rodighiero et al., 2010; Whitaker et al., 2012). Observed at all , this phenomenon must contribute significantly to the precipitous decline in cosmic star formation seen over the same epoch (e.g., Lilly et al., 1996; Madau et al., 1996; Cucciati et al., 2012).
However, while its gross evolution is increasingly well-understood, the slope and dispersion of the MS remain uncertain. Such uncertainty arises (at least) from dependencies on SFR indicators (e.g., Pannella et al., 2009, Figure 4), the definition of ‘‘star forming" (e.g., Salim et al., 2007, §7.5), and a lack of high-redshift data at moderate-to-low (e.g., Whitaker et al., 2012, Figure 1).
Despite these issues, if its evolution reflects that of individual systems, the slope and dispersion of the MS, their time-dependence, and their interpretation have deep implications for pictures of galaxy growth. With the MS broadly reproducible in cosmological simulations (Kereš et al., 2005; Neistein & Dekel, 2008; Lagos et al., 2011; Hopkins et al., 2013) and actively employed as a basis/constraint for evolutionary models (Peng et al., 2010; Leitner, 2012; Behroozi et al., 2013), understanding such details is increasingly important.
Here we reinterpret the slope of the MS.
| Quantity | Unit | Sourceaa1--S11; 2--B044/B047; 3--Derived. | Definition |
|---|---|---|---|
| SDSS magbbAB system offsets are mag. | 1 | Disk absolute magnitude -corrected to | |
| SDSS magbbAB system offsets are mag. | 1 | (Disk) rest-frame color -corrected to | |
| 1 | Galaxy redshift | ||
| 1 | Global -band Sérsic index | ||
| 1 | Global -band axis ratio (1 - ellipicity) | ||
| 2(3) | (Disk) stellar mass | ||
| SFR | 2 | Aperture-corrected star formation rate (median of PDF) | |
| sSFR | 2 | Galaxy specific star formation rate () | |
| 3 | Disk-mass-normalized star formation rate () |
The MS is conveniently recast in terms of galaxies’ specific star formation rates -- -- or fractional mass-growth per unit time. If constant, is the (inverse) -folding timescale.
The -dependence of sSFR -- the departure of the MS slope from unity -- contains information about the ‘‘efficiency" of SF across the galaxy mass spectrum.555More direct definitions of “SF efficiency” relate to a gas mass, but is an efficiency metric. Typically, it is parametrized by the power-law index:
| (1) |
If all galaxies formed stars with equal efficiency, would be identically zero. Observationally, appears close to zero, permitting convenient approximations in evolutionary models (e.g., Peng et al., 2010); is nearly independent of mass, so the entire star-forming population is nearly describable by a single number (absent significant dispersion at fixed ; see Section 6).
Yet, is not zero. Many studies using SFR indicators from the UV through the radio have concluded that, above , for (Brinchmann et al., 2004; Salim et al., 2007; Karim et al., 2011; Whitaker et al., 2012, but cf. Pannella et al. 2009). Peng et al. (2010) and Whitaker et al. (2012) find for blue galaxies (see Section 5 below), but that is significantly negative for the global star-forming population seems secure.
The implication of is that low-mass galaxies grow (logarithmically) faster than higher-mass contemporaries. Interesting on its own, this fact is important also because informs two other key questions: Why has the shape of the star-forming stellar mass function remained unchanged since (e.g., Ilbert et al., 2010; Tomczak et al., 2014)? What stops star formation?
Setting aside the mass function for now (see Section 5 and the extensive treatment of Peng et al. 2010) the question of what stops SF in galaxies nicely illustrates ’s influence on MS-based evolutionary models.
In the limit, galaxy evolution is binary: systems are either star-forming -- growing in lock-step with all other such objects -- or not. An implication is that mechanisms taking galaxies from the first population into the second act quickly and operate across all .
Conversely, if is substantially negative (as is likely), galaxy evolution is more nuanced. A galaxy’s global SF efficiency changes as it grows, gradually falling to negligible levels with time. ‘‘Quenching" is thus a mix of processes pulling systems vertically off the MS and lowering s as they move along it ( reflects the latter).
Many mechanisms have been proposed that implicitly or explicitly account for mass-dependent s, including virial-heating of the circumgalactic medium by dark matter halos (inducing ‘‘hot-mode" accretion) and AGN activity (e.g., Dekel & Birnboim, 2004; Kereš et al., 2005; Croton & Farrar, 2008; van de Voort et al., 2011). Such processes may be at work, but they are not directly coupled to the observables in --, so hypotheses are complicated by uncertainties in linking these phenomena.
Indeed, observationally, there is a deeper concern. (hence ) is biased, prima facie, as a description of SF as the numerator has essentially nothing to do with a significant part of the denominator -- the bulge. Given the well-known correlation of bulge mass-fractions, , with , is expected simply because ever smaller portions of a galaxy participate in SF, independent of the nature of the SF itself.
If -- is to add meaningfully to our knowledge of galaxy evolution, at a minimum, the extent to which reflects changes in the quality of SF (how) versus the proportion of a galaxy contributing to it (where) must be understood. Large spectrophotometric surveys -- such as the Sloan Digital Sky Survey (SDSS -- York et al., 2000) -- enable this.
Below, we demonstrate the importance of recognizing where SF occurs, showing that most-to-all of can be erased simply by redefining ‘‘" using the mass in galactic disks.
2. Data
We use data from the Seventh SDSS Data Release (DR7 -- Abazajian et al., 2009), drawing s and from Brinchmann et al. (2004, hereafter B04),111www.mpa-garching.mpg.de/SDSS/DR7/sfrs.html and 2D bulge/disk decompositions from Simard et al. (2011, hereafter S11). Given their extensive past use, however, we analyze DR4-based B04 data -- based on a different calculation222Known to overestimate in quiescent galaxies; www.mpa-garching.mpg.de/SDSS/DR4/Data/sfr_catalogue.html. -- in paralel. Below, B044 and B047 refer respectively to DR4-/DR7-based measurements while ‘‘B04" refers to the original paper (B047 lacks a stand-alone reference at present).
Both SFR and assume a Kroupa (2001) initial mass function. B04 give these quantities as probability distributions. We adopt the median total values, but results are unchanged if the mean or mode is used instead.
Below, we denote quantities describing disks by the (additional) subscript ‘‘disk". Quantities lacking this tag describe global galaxy properties. Table 1 lists all parameters and their sources; is assumed everywhere.
2.1. Bulge/Disk Decompositions
We use S11 ‘‘fixed " fits, where is the Sérsic index of the bulge component. These are appropriate for almost all sources (S11 §4.2), but results are qualitatively unaffected if the ‘‘free " models are used instead. We take disk and total absolute magnitudes from the fits. Employing model-independent Petrosian magnitudes from the NYU Value Added Galaxy Catalog (Blanton et al., 2005) does little but reduce for blue disks (Section 4).
To avoid dust and effects, we limit our analysis to face-on galaxies () with well-measured disk fluxes (Err) and total masses (). We further restrict the MS samples (see Section 3) to galaxies requiring a two-component bulgedisk model.333(NOT 2-component) ; S11 §4.2.1 Relaxing these cuts affects less than other systematics, but employing them ensures maximally accurate , , and meaningful corrections.
2.2. The Sample
In total, 12669 systems common to DR4/DR7 meet these criteria, with median . These include: ‘‘Pure-SF" (42%); ‘‘SF/AGN composite" (9%); ‘‘AGN" (6%); ‘‘LINER" (15%); and ‘‘Unclassifiable" galaxies (no detected emission; 28%).
Given the SDSS spectroscopic limit, this sample is roughly complete to for star-forming systems (assuming -percentile color and redshift). However, completeness -- set by line-flux, spectral , and broadband colors -- is of greater concern since it can distort fits in the -- plane. Since photometric completeness is not an issue and is well-measured by B04, the data should be relatively unbiased above the corresponding MS mass, . We perform all fits above this limit and derive statistics using weighting.
Typical half-light radii are . As , disks should be well-resolved.
2.3. Calculation of Disk Masses
We estimate empirically. First, we select a sample of disk-dominated systems -- bulge-to-total flux ratio -- whose color and mass should largely reflect those of pure disks. We then calculate -band mass-to-light ratios, , and derive by fitting a second-order polynomial. We do this independently for B044 ( from spectral fitting by Kauffmann et al. 2003) and B047 ( from SED fitting). B047 yields , with B044 offsets dex for (-percentile disk color). Using absolute disk magnitudes:
| (2) |
where (Blanton & Roweis, 2007).
We then define:
| (3) |
This may not formally correspond to ‘‘the sSFR of the disk" as bulge/nuclear regions may contribute some SF, but to ease discussion and because such contributions should be small, we use ‘‘" instead of ‘‘-normalized SFR" below.
Median - uncertainty in using B044 or B047 is 0.09 dex. Scatter in is 0.12/0.08 dex, respectively. Quality cuts ensure Err mag (the median is 0.03), so random errors in and should be comparable. Formal - uncertainties in are dex (either estimate) and therefore dominate.
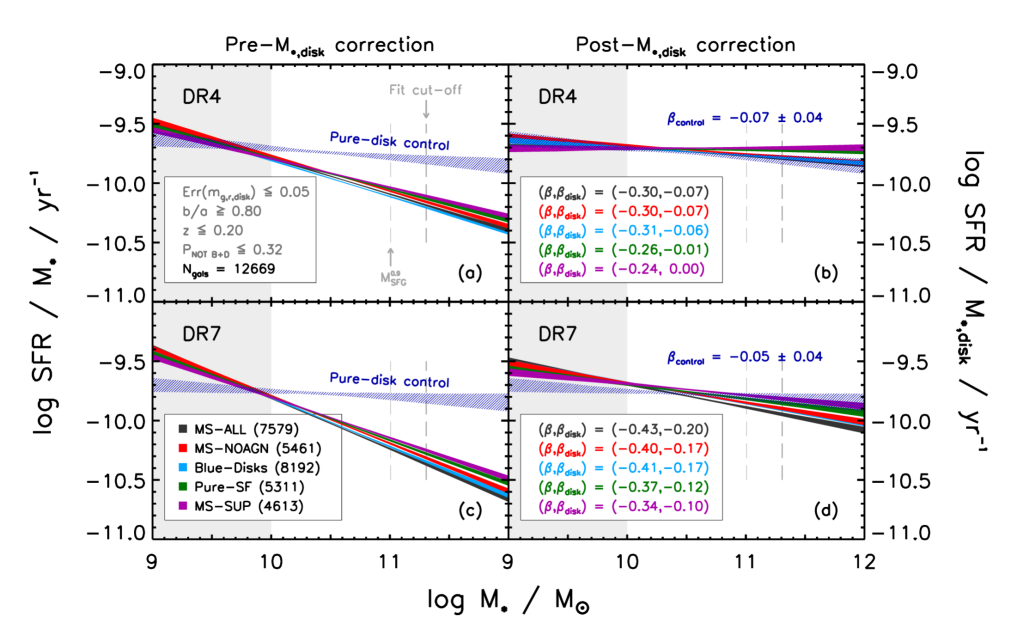
3. Results
Figure 1 summarizes our analysis. Here we plot fits to the MS in both -- (left) and -- space (right). Because the locus has no formal definition, we approximate the MS in 5 (non-independent) ways:
-
•
MS-ALL: All galaxies with above MS (defined using B047).
-
•
MS-NOAGN: The same, excluding AGN, Composite, and LINER galaxies.
-
•
PURE-SF: All pure-SF systems regardless of ; excludes AGN-contaminated and Unclassified galaxies.
-
•
BLUE DISK: All galaxies with regardless of spectral type or .
-
•
MS-SUPER: Intersection of all of the above; the purest, but smallest, sample.
Also overplotted are results for a ‘‘pure-disk control" sample (where ) composed of pure-SF systems well-fit by a single-disk profile.444(NOT 2-component), .
Three points are clear:
-
1.
The slope, , of -- is substantially steeper for the MS samples than for the pure-disk control (Figure 1a,c);
-
2.
The slope, , of the pure-disk control is consistent with zero at the 1- to 2- level (as seen at by Salmi et al. 2012);
-
3.
After re-normalization, MS slopes, , and intercepts are similar to -- even consistent with -- those of the pure-disk controls (Figure 1b,d).
Quantitatively, we find (consistent with results from Salim et al., 2007; Karim et al., 2011; Whitaker et al., 2012), but . (Spreads reflect data set and inter-sample variations.) This dex/dex enhancement is interesting in an absolute sense: it substantially (perhaps entirely) homogenizes mean SF efficiencies over more than a factor of 10 in . But, it is the homogenization of galaxies spanning with pure disks () that suggests re-normalization is physically meaningful.
Statistical uncertainties in and are , derived from fits to 100 bootstrap resamplings of the data at (90th-percentile for pure-SF galaxies). Systematics are clearly dominant, with MS definition and estimate both contributing at the --0.10 level (Section 4).
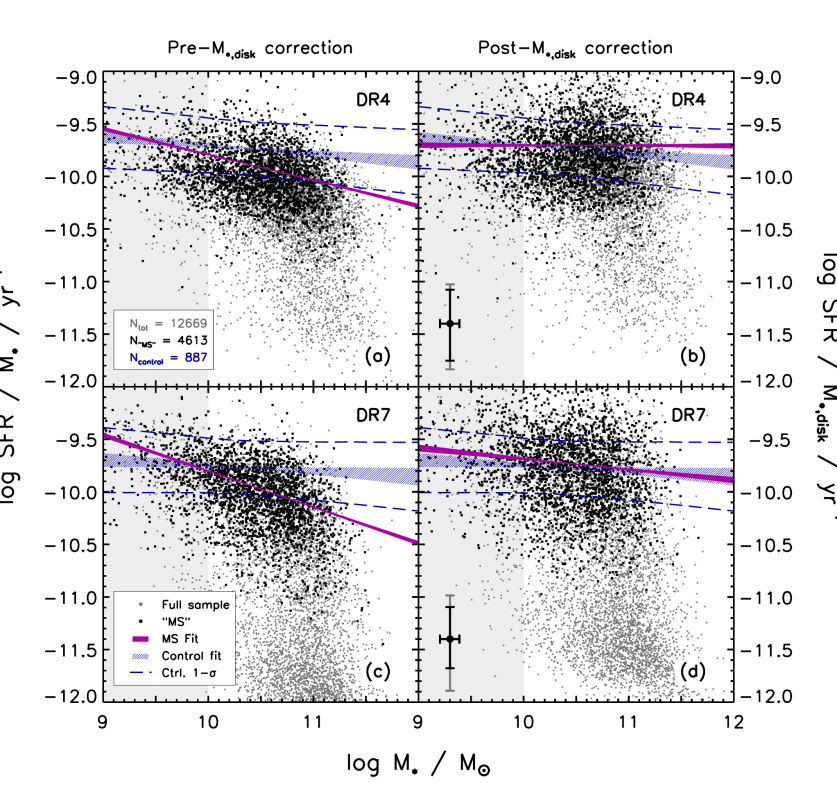
Figure 2 shows the data. Grey points represent all galaxies, black the MS-SUPER sample, constituting of the SFR density in the local universe (MS-ALL comprises ). Two additional points are illustrated here: 1) Dispersion in the MS, , is substantial; 2) Pure disks move from the top of the -- relation to the middle of --. We discuss in Section 6, but (2) is further evidence that the correction is physically meaningful: not only is pushed close to , but the original MS distribution is made to coincide with that of pure disks. Visually comparing the 1- control spread (dashed blue lines) to that of emphasizes this point.
In sum, re-normalizing by substantially (perhaps entirely) homogenizes SF efficiency in giant galaxies, placing bulge-dominated, systems near the level of pure disks one-tenth as massive.
4. Systematics
Once the MS is defined -- itself a effect (Figure 1) -- two systematics affect : calculation and estimation.
is affected by bulge/disk decomposition and calibration. Using B044 or B047 masses to calibrate has an effect comparable to statistical uncertainties. Adopting from Bell et al. (2003) changes similarly, but can boost by (B047 s). Using Petrosian magnitudes can induce (both data sets), but only for the BLUE DISK (and thus MS-SUPER) samples. Comparing S11-based to estimates derived from decompositions by Gadotti (2009, SDSS-based, but more complex than S11; ) or Allen et al. (2006, fit to independent Millennium Galaxy Catalogue imaging (); ), we find no trends larger than the scatter ( dex) at . Hence, systematics likely drive uncertainty in .
Figure 2a,c illustrates this. The (substantial) changes between B044 and B047 -- bi-modality at high mass, increased dispersion -- mainly reflect revised aperture corrections introduced after Salim et al. (2007) found B044 to overestimate in quiescent galaxies. Using a common , we find for all MS samples. Swapping B04 s for optical emission line estimates from the Padova-Millennium Galaxy and Group Catalogue (PM2GC -- Calvi et al., 2011, requiring no color-based corrections), we find for galaxies with , consistent with the analogous obtained from B047. Hence, given the B044/B047 offsets, systematics in are likely once the MS is defined.
5. Implications
We have identified a quantity that is roughly constant for star-forming galaxies at : . This implies that SF efficiency in the disks of star-forming galaxies (even bulge-dominated ones) is largely independent of global galaxy properties (e.g., halo mass). This is qualitatively different from (if anticipated by) findings regarding uniform in disk-dominated galaxies (Salmi et al., 2012), blue galaxies (likely because they are disk-dominated; see Section 1), and the correlation of with position on the MS (Martig et al., 2009; Williams et al., 2010; Lang et al., 2014; Omand et al., 2014), which our measurement of supports.
Indeed, our results suggest that the suppression of SF efficiency with due to bulge-growth is mostly superficial, caused by the association of ‘‘SF efficiency" with and the conflation of where and how SF occurs. That is, a key aspect of ‘‘mass-quenching" is ‘‘bulge-building", distinct from processes affecting SF where it occurs. In this we echo Kennicutt et al. (1994).
Whether bulge-growth is predominantly secular (converting dynamically ‘‘cold" disk material through, e.g., bar-instabilities; Kormendy & Kennicutt, 2004) or merger-driven (adding ‘‘hot" bulge material through interactions; Toomre & Toomre, 1972) is beyond the scope of this paper, but future measurements of disk stellar mass functions -- or indeed -- may shed light on this question. Regardless, investigations of halo heating and/or AGN-powered quenching might focus on the narrower question of how these mechanisms build/maintain bulges in healthy disks. (This and the previous point is refined in the next section.)
A third implication is worth noting. Since , the low- slope of the star-forming stellar mass function has remained constant at , yet is reported over the same interval almost universally (see Section 1 for references). These are inconsistent observations: implies should steepen (dramatically) with time. Our results suggest that, at (where it is measured at ), largely reflects . Extrapolations from this regime to lower- -- where star-forming galaxies are bulgeless -- may thus be inappropriate. If in fact at lower mass -- as results from Salim et al. (2007), Karim et al. (2011), and Whitaker et al. (2012) also hint -- the MS and would be reconciled.
6. The Width of the SFR Main Sequence
So far, we have neglected dispersion in the MS, . Given B044 data, this appears reasonable: dex, consistent with formal errors (Figure 2). However, B047 and numerous other data sets (e.g., Salim et al., 2007; Oemler et al., 2013, PM2GC) suggest --0.6 dex (peak-to-peak order of magnitude), implying that the width of the MS is qualitatively and quantitatively important.
Qualitatively, since , is necessary to preserve diversity in star formation histories (SFHs) as independently suggested by, e.g., stellar population synthesis (Poggianti et al. 2013; at least when ). Comparing Peng et al. (2010, Figure 19) with Gladders et al. (2013, Figure 2) reveals the contrast between and , respectively, in terms of SFH diversity.
Inversely, real dispersion quantitatively complicates the determination of SFHs based on MS evolution (Section 1): one must model . How this could be done is unclear; data are scanty at and -- key parameter space when modeling Milky Way analogs -- and local measurements suggest (and therefore its navigation) only becomes more important in this mass regime (Salim et al., 2007, §7.5).
Regardless, assuming it can be precisely measured, interpreting will remain a challenge. Different indicators probe different timescales ( vs. -- yr for optical and UV/IR metrics, respectively), so ambiguity in the causes of -- e.g., minor-mergers/starbursts (Dressler et al., 2013; Abramson et al., 2013), extended periods of enhanced gas accretion, stochasticity -- and thus its relevance to the ‘‘fundamental" history of galaxies may persist. If so, the utility of the MS as a model for individual systems will remain questionable.
One can always imagine the opposite, however. If is ‘‘truly" small (e.g., Salmi et al., 2012), our results suggest a quasi-identical SFH for all galactic disks (up to a scaling), with global galaxy-to-galaxy variations coming from bulge-building or environmental developments. Future IFU/resolved spectroscopic studies of galaxies at all redshifts could shed substantial light on this issue.
In sum, the ‘‘ correction" is surely not the end of the story. Though it homogenizes star-forming disks in hosts with a range in -- placing, e.g., M31 and M33 on more similar footing -- quenched disks exist at all which cannot be brought onto (some variant of) the MS. Other factors -- bars, disk dynamics, halo heating, AGN activity, environment -- must help pull these systems off the (flat) ridge-line defined by normal disks; the key point is that these processes may manifest themselves in the dispersion and not the slope of the MS.
7. Summary
Re-normalizing by disk stellar mass, can account for dex of declining per decade , essentially removing the dependence of SF efficiency on galaxy mass for star-forming systems with blue disks (if not all star-forming galaxies). Besides suggesting a key part of ‘‘mass-quenching" is ‘‘bulge-building" -- distinct from processes affecting SF in disks -- our findings ease tension between the MS and the evolution of the stellar mass function, and reinforce two important points:
-
•
‘‘Understanding galaxy evolution demands the routine bulge--disk decomposition of the giant galaxy population at all redshifts," (Allen et al., 2006);
-
•
Dispersion in likely reflects real diversity in SFHs and should not be ignored.
Upcoming IFU surveys (e.g., MaNGA; www.sdss3.org/future/manga.php) may constrain intrinsic spreads in ) and thus mechanisms shaping SFHs. Regardless, -- and -- should serve as benchmarks for future theoretical models of galaxy evolution.
Acknowledgements
L.E.A. thanks Ryan Quadri, Daniel Masters, and Sean Johnson for many helpful discussions. He dedicates this paper to Hortense Lieberthal Zera (1916-2014), a loving grandmother and stellar personality.
Funding for the Sloan Digital Sky Survey (www.sdss.org) was provided by the Alfred P. Sloan Foundation, the Participating Institutions, the National Aeronautics and Space Administration, the National Science Foundation, the U.S. Department of Energy, the Japanese Monbukagakusho, and the Max Planck Society.
References
- Abazajian et al. (2009) Abazajian, K. N., Adelman-McCarthy, J. K., Agüeros, M. A., et al. 2009, ApJS, 182, 543
- Abramson et al. (2013) Abramson, L. E., Dressler, A., Gladders, M. D., et al. 2013, ApJ, 777, 124
- Allen et al. (2006) Allen, P. D., Driver, S. P., Graham, A. W., et al. 2006, MNRAS, 371, 2
- Behroozi et al. (2013) Behroozi, P. S., Wechsler, R. H., & Conroy, C. 2013, ApJ, 770, 57
- Bell et al. (2003) Bell, E. F., McIntosh, D. H., Katz, N., & Weinberg, M. D. 2003, ApJS, 149, 289
- Blanton & Roweis (2007) Blanton, M. R., & Roweis, S. 2007, AJ, 133, 734
- Blanton et al. (2005) Blanton, M. R., Schlegel, D. J., Strauss, M. A., et al. 2005, AJ, 129, 2562
- Brinchmann et al. (2004) Brinchmann, J., Charlot, S., White, S. D. M., et al. 2004, MNRAS, 351, 1151
- Calvi et al. (2011) Calvi, R., Poggianti, B. M., & Vulcani, B. 2011, MNRAS, 416, 727
- Croton & Farrar (2008) Croton, D. J., & Farrar, G. R. 2008, MNRAS, 386, 2285
- Cucciati et al. (2012) Cucciati, O., Tresse, L., Ilbert, O., et al. 2012, A&A, 539, A31
- Daddi et al. (2007) Daddi, E., Dickinson, M., Morrison, G., et al. 2007, ApJ, 670, 156
- Dekel & Birnboim (2004) Dekel, A., & Birnboim, Y. 2004, in American Institute of Physics Conference Series, Vol. 743, The New Cosmology: Conference on Strings and Cosmology, ed. R. E. Allen, D. V. Nanopoulos, & C. N. Pope, 162--189
- Dressler et al. (2013) Dressler, A., Oemler, Jr., A., Poggianti, B. M., et al. 2013, ApJ, 770, 62
- Gadotti (2009) Gadotti, D. A. 2009, MNRAS, 393, 1531
- Gladders et al. (2013) Gladders, M. D., Oemler, A., Dressler, A., et al. 2013, ApJ, 770, 64
- Guo et al. (2013) Guo, Q., White, S., Angulo, R. E., et al. 2013, MNRAS, 428, 1351
- Hopkins et al. (2013) Hopkins, P. F., Keres, D., Onorbe, J., et al. 2013, ArXiv e-prints
- Ilbert et al. (2010) Ilbert, O., Salvato, M., Le Floc’h, E., et al. 2010, ApJ, 709, 644
- Karim et al. (2011) Karim, A., Schinnerer, E., Martínez-Sansigre, A., et al. 2011, ApJ, 730, 61
- Kauffmann et al. (2003) Kauffmann, G., Heckman, T. M., White, S. D. M., et al. 2003, MNRAS, 341, 33
- Kennicutt et al. (1994) Kennicutt, Jr., R. C., Tamblyn, P., & Congdon, C. E. 1994, ApJ, 435, 22
- Kereš et al. (2005) Kereš, D., Katz, N., Weinberg, D. H., & Davé, R. 2005, MNRAS, 363, 2
- Kormendy & Kennicutt (2004) Kormendy, J., & Kennicutt, Jr., R. C. 2004, ARA&A, 42, 603
- Kroupa (2001) Kroupa, P. 2001, MNRAS, 322, 231
- Lagos et al. (2011) Lagos, C. D. P., Lacey, C. G., Baugh, C. M., Bower, R. G., & Benson, A. J. 2011, MNRAS, 416, 1566
- Lang et al. (2014) Lang, P., Wuyts, S., Somerville, R., et al. 2014, ArXiv e-prints
- Leitner (2012) Leitner, S. N. 2012, ApJ, 745, 149
- Lilly et al. (1996) Lilly, S. J., Le Fevre, O., Hammer, F., & Crampton, D. 1996, ApJ, 460, L1
- Liske et al. (2003) Liske, J., Lemon, D. J., Driver, S. P., Cross, N. J. G., & Couch, W. J. 2003, MNRAS, 344, 307
- Madau et al. (1996) Madau, P., Ferguson, H. C., Dickinson, M. E., et al. 1996, MNRAS, 283, 1388
- Martig et al. (2009) Martig, M., Bournaud, F., Teyssier, R., & Dekel, A. 2009, ApJ, 707, 250
- Neistein & Dekel (2008) Neistein, E., & Dekel, A. 2008, MNRAS, 383, 615
- Noeske et al. (2007) Noeske, K. G., Weiner, B. J., Faber, S. M., et al. 2007, ApJ, 660, L43
- Oemler et al. (2013) Oemler, Jr., A., Dressler, A., Gladders, M. G., et al. 2013, ApJ, 770, 61
- Omand et al. (2014) Omand, C., Balogh, M., & Poggianti, B. 2014, ArXiv e-prints
- Pannella et al. (2009) Pannella, M., Carilli, C. L., Daddi, E., et al. 2009, ApJ, 698, L116
- Peng et al. (2010) Peng, Y.-j., Lilly, S. J., Kovač, K., et al. 2010, ApJ, 721, 193
- Poggianti et al. (2013) Poggianti, B. M., Calvi, R., Bindoni, D., et al. 2013, ApJ, 762, 77
- Rodighiero et al. (2010) Rodighiero, G., Cimatti, A., Gruppioni, C., et al. 2010, A&A, 518, L25
- Salim et al. (2007) Salim, S., Rich, R. M., Charlot, S., et al. 2007, ApJS, 173, 267
- Salmi et al. (2012) Salmi, F., Daddi, E., Elbaz, D., et al. 2012, ApJ, 754, L14
- Simard et al. (2011) Simard, L., Mendel, J. T., Patton, D. R., Ellison, S. L., & McConnachie, A. W. 2011, ApJS, 196, 11
- Tomczak et al. (2014) Tomczak, A. R., Quadri, R. F., Tran, K.-V. H., et al. 2014, ApJ, 783, 85
- Toomre & Toomre (1972) Toomre, A., & Toomre, J. 1972, ApJ, 178, 623
- van de Voort et al. (2011) van de Voort, F., Schaye, J., Booth, C. M., & Dalla Vecchia, C. 2011, MNRAS, 415, 2782
- Whitaker et al. (2012) Whitaker, K. E., van Dokkum, P. G., Brammer, G., & Franx, M. 2012, ApJ, 754, L29
- Williams et al. (2010) Williams, R. J., Quadri, R. F., Franx, M., et al. 2010, ApJ, 713, 738
- Wuyts et al. (2011) Wuyts, S., Förster Schreiber, N. M., van der Wel, A., et al. 2011, ApJ, 742, 96
- York et al. (2000) York, D. G., Adelman, J., Anderson, Jr., J. E., et al. 2000, AJ, 120, 1579