Lyman edges in supermassive black hole binaries
Abstract
We propose a new spectral signature for supermassive black hole binaries (SMBHBs) with circumbinary gas discs: a sharp drop in flux bluewards of the Lyman limit. A prominent edge is produced if the gas dominating the emission in the Lyman continuum region of the spectrum is sufficiently cold (K) to contain significant neutral hydrogen. Circumbinary discs may be in this regime if the binary torques open a central cavity in the disc and clear most of the hot gas from the inner region, and if any residual UV emission from the individual BHs is either dim or intermittent. We model the vertical structure and spectra of circumbinary discs using the radiative transfer code TLUSTY, and identify the range of BH masses and binary separations producing a Lyman edge. We find that compact supermassive () binaries with orbital periods of , whose gravitational waves are expected to be detectable by pulsar timing arrays, could have prominent Lyman edges. Such strong spectral edge features are not typically present in AGN spectra and could serve as corroborating evidence for the presence of an SMBHB.
keywords:
accretion, accretion discs – black hole physics – galaxies: active1 Introduction
Supermassive black holes (SMBHs) are present in the centres of most, if not all, nearby galaxies (see reviews by e.g. Kormendy & Richstone 1995; Ferrarese & Ford 2005). If two galaxies containing SMBHs merge, this should then result in the formation of a SMBHB (e.g. Begelman et al. 1980). Thus, given the hierarchical model for structure formation, in which galaxies are built up by mergers, one would naively expect SMBHBs to be quite common.
Many candidates for binary BHs have been identified on kiloparsec scales, including two galaxies with spatially resolved active binary nuclei (Komossa et al. 2003; Fabbiano et al. 2011; see, e.g. the review by Komossa 2006 and Shen et al. 2013 and references therein). At parsec scales, however, there is only one clear example: a radio observation of a BH pair with a projected separation of 7 pc (Rodriguez et al., 2006). There remain no confirmed binary black holes at subparsec separations.
The lack of observational evidence for binaries at small separations suggests that the SMBHs either remain inactive during the merger, or that they merge within a small fraction of a Hubble time and are consequently rare (Haiman et al. 2009). Another possibility is that the spectrum of a compact binary differs significantly from those of single-BH active galactic nuclei (AGN). A better understanding of the spectral energy distributions (SEDs) and lightcurves from circumbinary discs is necessary to determine whether binaries may therefore be missing from AGN surveys or catalogs (Tanaka, 2013).
Gravitational waves (GWs) from a merging SMBHB may be detected in the next decade by pulsar timing arrays (PTAs; Bizouard et al. 2013). Identifying the gravitational wave source in EM bands would also have considerable payoffs for cosmology and astrophysics (e.g. Phinney 2009). Unfortunately, GWs yield limited precision on the sky position. For a PTA source, of order 102 (and perhaps as many as 104) plausible candidates may be present within the 3D measurement error box (Tanaka et al., 2012). Concurrent EM observations would then be necessary to identify the GW source.
Many different EM signatures have been proposed for SMBHBs. These include periodic luminosity variations commensurate with the orbital frequency of the source (Haiman et al. 2009 and references therein) and broad emission lines that are double-peaked and/or offset in frequency (Shen et al. 2013 and the references therein). Additionally, the evacuation of a central cavity by the binary could lead to a spectrum that is a distinctively soft (Milosavljević & Phinney, 2005; Tanaka & Menou, 2010), and has unusually weak broad optical emission lines, compared to typical AGN (Tanaka et al., 2012). Other work (Gültekin & Miller, 2012; Roedig et al., 2014) describes spectral signatures of discs with partial cavities, which may show up in the SED as broad, shallow dips.
We here propose that, in addition to the above signatures, the presence of a central cavity in a circumbinary disc could produce distinct absorption edges in the optical/UV (in particular, at the Lyman limit). This is analogous to the prominent Lyman break in galactic spectra a few Myr after a starburst, when the composite emission is dominated by less massive stars with cooler atmospheres (Leitherer et al., 1999; Schaerer, 2003). Physically, such an edge would be present if the disc is cold enough ( K) to have sufficient neutral (ground-state) hydrogen to absorb Lyman continuum photons. The disc should also be hot enough (conservatively K); for yet cooler discs, the continuum emission redward of the Lyman limit may be obscured by metal absorption features.
This Letter is organized as follows. In §2, we describe the details of our disc and emission models. In §3, we show examples of spectra for binary BH discs, and compare these to those of single BH discs. In §4, we discuss caveats, including emission from mini-discs around each of the individual BHs that could mask the Lyman edge. We summarize our main conclusions and the implications of this work in §5.
2 Disk Models
In order to model disc spectra, we must begin with a model for the disc. In particular, we need the energetics (i.e. how much energy is dissipated from tidal torques and viscous heating throughout the disc). We here adopt the analytic models in Kocsis et al. (2012, hereafter KHL12). These are modified versions of a standard Shakura & Sunyaev (1973) accretion disc, to incorporate the angular momentum transfer and the corresponding heating of the disc by the binary torques. The models self-consistently track the co-evolution of the disc and the binary orbit, through a series of quasi-steady, axisymmetric configurations.
There are several qualitatively different solutions for such a system, depending on the parameters of the binary (i.e. masses and orbital separation) and the disc (i.e. viscosity and accretion rate). For the purposes of this Letter, we concentrate on the case where a central cavity is opened and maintained, as the lack of the hot inner regions is responsible for the Lyman edges in the spectrum. Our conclusions on Lyman edges simply rely on emission from disc patches with effective temperature K dominating the composite UV spectrum, and should not be sensitive to model details.
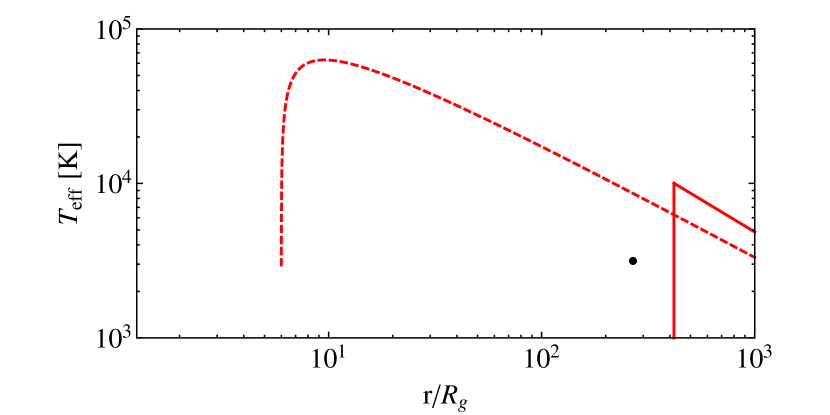
Fig. 1 shows illustrative examples of radial profiles of the effective temperature (defined by , where is the Stefan-Boltzmann constant, and is the total dissipation rate per unit disc surface area, including both viscous and tidal heating). The solid curve shows for a circumbinary disc around a binary, with mass ratio and accretion rate (assuming a radiative efficiency of 10%). The secondary is located at the radius 230 (), creating a cavity inside 470 . We assume in all of our models that the BHs are non-spinning, and adopt a viscosity parameter . For the other less important parameters, we use the same fiducial parameters as KHL12, except we set to be consistent with our assumption of vertically uniform dissipation The dashed curve shows, for comparison, for a disc around a single BH with the same mass. Most importantly, this figure shows that outside the cavity, the circumbinary disc is hotter (by a factor of two; see also Lodato et al. 2009) than the corresponding single-BH disc, but still not nearly as hot as the innermost regions of this single-BH disc.
2.1 SEDs: previous models
In the simplest model for the emerging spectrum, each disc annulus emits as a blackbody, with the effective temperature determined by the heating rate from viscous and tidal torques in that annulus. A more sophisticated version is a composite “greybody” spectrum. The blackbody emission in each disc annulus is modified by a correction factor, accounting for the effects of electron scattering opacity (Milosavljević & Phinney, 2005; Tanaka & Menou, 2010), to obtain
| (1) |
Here, is the ratio of absorption to total opacity. For this model, we adopt the Kramers’ bound-free opacity at solar metallicity for and cm2 g-1. We refer the reader to Tanaka & Menou (2010) for a detailed discussion of the greybody disc model.
2.2 SEDs: new RT models
The greybody model ignores important radiative transfer (RT) effects. In particular, the opacity is assumed to be a smooth function of frequency. In reality, the bound-free opacities have sharp thresholds, corresponding to the onset of absorption from various species in the disc. For example, photons with energies above the Lyman limit 13.6eV (or frequency 3.28 1015 Hz) can be absorbed by neutral (ground-state) hydrogen (H) within the disc. This sharp change in opacity can cause a corresponding prominent edge in the emerging disc spectrum. This may be understood as follows: in a plane-parallel infinite atmosphere, one sees the source function at optical depth unity along the line of sight. Thus, the smaller opacity redwards of the Lyman limit means that we see the source function from deeper in the disc, where the temperature is (generally) higher. The higher temperature then translates into a greater flux redward of the Lyman limit (e.g. Hubeny & Hubeny 1997).
As the temperature increases, H is more ionized, decreasing the H bound-free opacity. Eventually, the combined electron scattering and free-free opacities overwhelm the discontinuity in the bound-free opacity, and the opacity on both sides of the Lyman edge becomes nearly equal, washing out any absorption edge in the spectrum. As the temperature continues to increase, non-local thermodybnamic equilibrium (NLTE) effects may cause an emission edge instead.
To model the emission from the disc, we use the RT code TLUSTY (Hubeny & Lanz 1995). This code self-consistently solves the equations of vertical hydrostatic equilibrium, energy balance, RT, and the full non-LTE statistical equilibrium equations for all species that are present in the disc. Contributions from all bound-free and free-free transitions at all frequencies of interest are included, while bound-bound transitions are assumed to be in detailed balance.
We model H as a nine-level atom and He as a four-level atom. Electron scattering, including Comptonization is also included. We assume that the disc is composed of H and He (at their Solar ratio). Metals are not included, but would make little difference to continuum spectra for K K. For any given annulus, we calculate the vertical structure by specifying the vertical gravity , disc surface density , and the total energy dissipation rate . Spectra are insensitive to the surface density (provided the disc remains optically thick) and, for computational convenience, we fix throughout this Letter. Thus, specifying the radial profile and vertical gravity fully determines the spectrum emerging from the disc annulus at radius . is approximated to be linear in and proportional to the square of the local Keplerian angular frequency, . The composite spectrum may be computed by summing over all annuli.
Although we have assumed that flux is radiatively transmitted through the disc, most of our model annuli have convectively unstable zones. Models with small density inversions (density increasing outward) also occur. These would be unstable. Finally, we assume that tidal and viscous torques dissipate energy locally, and uniformly in height (i.e. equal dissipation per unit column mass). The vertical energy distribution is poorly understood, and real discs may be advective, or the energy may be carried away by density waves (Dong et al., 2011; Duffell & MacFadyen, 2012).
3 Results: Edges in Disk Spectra
In this section, we show examples of composite circumbinary disc spectra, and compare these to the simpler black– and greybody models, as well as to the corresponding single–BH disc spectra.
In the left-hand panel of Fig. 2, the solid (dashed) curves show composite disc spectra corresponding to the circumbinary (single-BH) disc in Fig. 1. Realistically, the disc may extend to 2000 , where it would become gravitationally unstable, according to the Toomre criterion. However, due to practical issues with convergence, we were only able to get models within 40 of the inner disc edge, and we only integrate the emission from this region. However, the excluded region is cooler than the inner edge of the disc and its emission should not mask the Lyman edge.
The TLUSTY binary spectrum (in black), shows a prominent break at the Lyman limit ( Hz), which is not present in the black– or greybody disc models (shown in blue and red, respectively). Overall, the blackbody model overpredicts the flux at both low and high frequencies, but underpredicts it immediately below the Lyman limit. The greybody model does a better job at frequencies below the Lyman limit, but overpredicts the flux more significantly at higher frequencies.
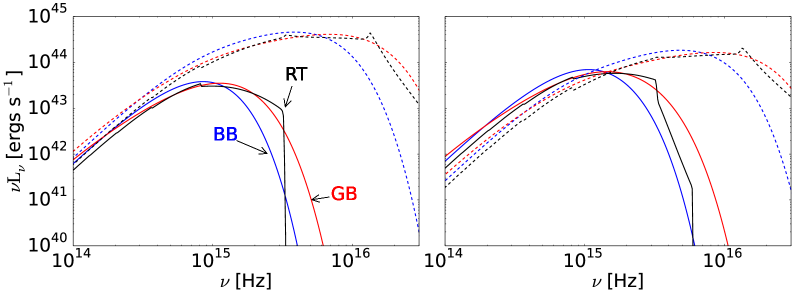
In contrast to the binary-BH spectrum, the single-BH spectrum has no sharp absorption edge at the Lyman limit (although there is a weak kink). This is because, as shown in Fig. 1, the innermost region of the single-BH disc is much hotter than the inner edge of the binary disc. Specifically, the binary disc has a maximum of 11,000, whereas, the single-BH disc is considerably hotter, with a maximum of 80,000 K (we have chosen a somewhat high so that inner edge of the circumbinary disc is above . However, we have verified that there is no Lyman edge in the single BH case for ). For a spinning BH, the inner edge is expected to be closer to the BH horizon (following the innermost stable circular orbit), which would further increase the maximum temperature in the single-BH case. However, winds may limit the maximum in single-BH discs to 50,000 K (Laor & Davis, 2014).
In the right-hand panel of Fig. 2, we show another set of illustrative disc spectra, with the same parameters as in the left panel, except for a lower mass (). In this case, the binary disc is hotter (K at the inner edge) and the Lyman edge feature is correspondingly weaker. The single-BH model looks similar to the one shown in the left.
3.1 Binary parameter space with edges
We now discuss under what conditions binary discs are likely to have prominent Lyman edges.
If the inner edge of the disc falls below a particular threshold temperature, the composite disc spectrum will have a prominent Lyman absorption edge. An example of a spectrum close to the threshold temperature is the one shown in the right-hand panel of Figure 2: if the disc were much hotter, the Lyman edge feature would be wiped out. The precise threshold will depend on the vertical gravity and other parameters. Physically, the vertical gravity sets the scale height, which determines the vertical density. The density, in turn, determines the ionization state, which then affects the opacity difference between the two sides of the Lyman limit.
To establish a quantitative criterion for the threshold , we find the maximum effective temperature such that there is at least an order of magnitude drop in the flux at the Lyman limit (for different gravity parameters). We then establish the following fitting formula between the threshold temperature as a function of the square of the local Keplerian angular frequency, :
| (2) |
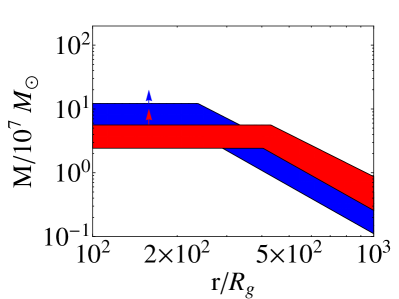
This is accurate to 111Assuming g cm-2. In the optically thick limit changes in the may affect the threshold by in the range . At higher , the threshold temperature increases less steeply with . However, lies outside our parameter space of interest. At lower we were unable to construct models at the threshold, and simply extrapolated this fit. at 160 for a 10 BH. Note that the spectrum in the right-hand panel of Fig. 2 would not satisfy our conservative criterion. We also impose a low-temperature threshold of 104 K, below which metal absorption becomes important and possibly causes metal edges to appear in the spectrum. Comparing the maximum disc temperature to the fitting formula above, we identify regions in binary parameter space which are cool enough to have Lyman edges.222Using the hottest annulus, as opposed to full composite spectra, is a good proxy to identify the presence/absence of the Lyman edge. In Fig. 3, we show the ranges of masses and separations for which a prominent Lyman edge is produced, for two different accretion rates and mass ratios. The corresonding ranges of orbital periods, and time-scale over which the edge would be visible, may be calculated (to within a factor of a few) by the following fitting formulas.
| (3) | ||||
| (4) |
Note that for a given and , there is a maximum total mass for the edge which is set by our low temperature threshold:
| (5) |
4 Mini-discs
In general, we would not expect any central cavity to be completely empty. As first discussed in the smoothed-particle hydrodynamic simulations of Artymowicz & Lubow (1996) and confirmed by several recent works (Hayasaki et al., 2007; MacFadyen & Milosavljević, 2008; Cuadra et al., 2009; Shi et al., 2012; Roedig et al., 2012; D’Orazio et al., 2013; Farris et al., 2013; Gold et al., 2013) gas leaks into the cavity through non-axisymmetric streams. These streams can feed “mini-discs” around each individual BH, at rates set by the viscous time-scale of each mini-disc. The recent simulations suggest that accretion rates inside the cavity may be comparable to those onto a single-BH.
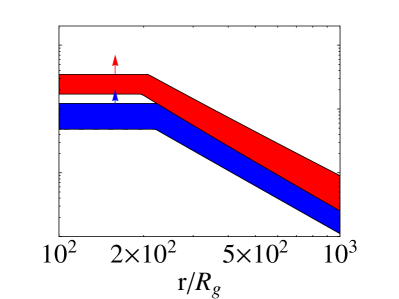
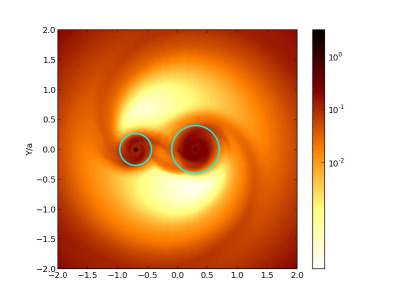
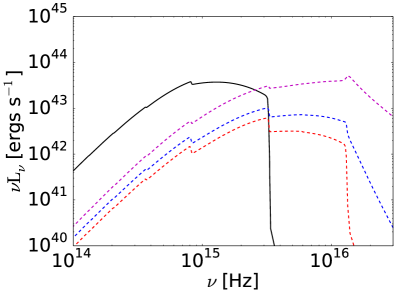
The emission from hot mini-discs may mask the Lyman edge feature. To illustrate this, we calculate spectra for the discs shown in Fig. 8b of Farris et al. 2013 (reproduced here as the left panel of Fig. 4). This figure shows a time averaged surface density profile for a binary. The simulation is scale-free so the masses, separation, and accretion rate are arbitrary. We adopt a and separation . For , the masses of the primary and secondary are then and , and the system is on the verge of the GW inspiral stage.
To model the spectrum of the circumbinary disc, we use from an axisymmetric KHL12 circumbinary disc model with inner radius at 460 (even though the simulated disc is in fact lopsided; note that the simulations are isothermal and do not predict ). To obtain the profile, we set . We likewise model the circumsecondary disc as a standard thin disc around a non-spinning BH (with truncation radius of 400 , where is defined in terms of just the secondary mass. This is roughly consistent with the size of the circumsecondary disc in Fig. 4). Fig. 4 shows spectra of the circumbinary and circumsecondary discs, assuming that 50% (purple), 10% (blue), and 5% (red) of the external fuels the secondary. For the 5% case, the Lyman edge is still prominent. However, it is greatly reduced for 10%, and for 50% it is completely obscured. Thus, if more than a few % of the in the cicumbinary disc leaks into the cavity and fuels a radiatively efficient, hot accretion flow, the Lyman edge can be obscured. As discussed above, Farris et al. (2013) find circumsecondary accretion rates comparable to the rate onto a single BH, which would favor the case. There should also be some emission from the circumprimary disc, which we have not included.
However, there are two reasons why Lyman edges could remain detectable, even with efficient fueling of the individual BHs. First, most of the gas entering the cavity may fuel the secondary (rather than the primary) BH. This could then lead to a radiatively inefficient, super-Eddington accretion flow, rather than a thin mini-disc; such discs have much fainter fluxes in the UV (see, e.g. Kawaguchi 2003). Second, the fueling of the individual BHs may be intermittent. The simulations listed in the preceding paragaphs show that the rate at which the gas enters the cavity fluctuates strongly, tracking the binary’s orbital period. Whether the BHs can accept this fuel depends on the viscous time-scale in their vicinity. There is some evidence from 3D magnetohdydrodynamic simulations that the effective may strongly increase inside the cavity (Shi et al., 2012; Noble et al., 2012; Gold et al., 2013). The streams from the circumbinary disc would then rapidly accrete onto the individual BHs, and mini-discs would either not form or would be intermittent (Tanaka, 2013). The relevant time-scale would be the viscous time of the mini-disc, which should generally extend to the tidal truncation radius as long as the specific angular momentum of the accreting streams exceeds that at the ISCO (Roedig et al., 2014). Ultimately, the prominence of the Lyman edge features is tied to the nature of the mini-disks, and requires a better understanding of these flows.
5 Summary and Conclusions
In this Letter, we have proposed that spectral edges, in particular at the Lyman limit, may be characteristic signatures of a circumbinary disc. Our conclusions can be summarized as follows.
-
1.
If binary torques clear a cavity in the circumbinary disc, the disc spectrum may exhibit a sharp drop at the Lyman limit. This is because the hottest region (i.e. the inner edge) of the disc is cool enough to have neutral H, absorbing nearly all flux blueward of the Lyman limit. This occurs below a critical which generally lies in the range 10,000 K-20,000 K, depending on vertical gravity and other parameters. At lower temperatures, absorption from metals (i.e. C) may cause spectral edges redward of the Lyman limit.
-
2.
Observationally, AGN spectra only show Lyman edges due to absorption by intervening neutral gas (see Antonucci et al. 1989). The inner regions of a single-BH AGN disc are hotter than for binaries (Fig. 1), and can mask any edge produced in the outer disc, leaving only a small “kink”(Fig. 2). Such kinks are not seen observationally, and understanding what would smear them (e.g. general relativistic effects or winds) is an open theoretical problem. For an overview of the Lyman edge problem in AGN spectral modeling see, e.g. Kolykhalov & Sunyaev (1984) and Koratkar & Blaes (1999).
-
3.
Neutral H in the binary’s host galaxy, unrelated to the nuclear accretion disc itself, could cause a Lyman edge (as seen in a few AGNs). However, in the case of the disc, one could look for rotational broadening of the edge due to orbital motions in the disc, with velocities of order km/s. This may cause a 10% smearing on the edge.
-
4.
A portion of the binary parameter space could have a truncated circumbinary disc, with in the critical range for a prominent Lyman edge (Fig. 3). This parameter space partially overlaps with the expected typical parameters for individually resolvable PTA sources. These are very massive binaries, with , and separations ranging from 10’s to 1000’s of , and mass ratios peaking at but with a long tail to lower values (Sesana et al., 2012).
-
5.
Efficient fueling of the BHs inside the central cavity could mask the Lyman edge feature in the circumbinary disc spectrum. For example, persistent emission from hot mini-discs (see Farris et al. 2013) would obscure the Lyman edge. However, if the accretion flows onto the individual BHs are radiatively inefficient and/or intermittent (Tanaka, 2013), the Lyman edge could remain visible, or appear periodically on the time-scale of the binary’s orbit (which could be weeks to years; Haiman et al. 2009).
-
6.
The proposed Lyman edge signature could be used in combination with other proposed EM signatures to refine the search for SMBHBs. We have conducted a preliminary search for the Lyman edge feature in x-ray weak quasars discussed in Brandt et al. 2000. In particular we looked at FUSE and IUE spectra for the ten objects in their Table 2, but found no sign of any Lyman edge feature.
If detected in an AGN, a prominent Lyman edge would tighten the case for the presence of a compact binary BH.
We thank Shane Davis for sharing a modified version of TLUSTY and for technical help, as well as for providing an initial table of spectral models. We also thank Shane Davis, Omer Blaes, Ivan Hubeny, Jules Halpern, and Frits Paerls for insightful conversations. ZH acknowledges support from NASA grant NNX11AE05G.
References
- Antonucci et al. (1989) Antonucci R. R. J., Kinney A. L., Ford H. C., 1989, ApJ, 342, 64
- Artymowicz & Lubow (1996) Artymowicz P., Lubow S. H., 1996, ApJ, 467, L77
- Begelman et al. (1980) Begelman M. C., Blandford R. D., Rees M. J., 1980, Nature, 287, 307
- Bizouard et al. (2013) Bizouard M. A., Jenet F., Price R., Will C. M., 2013, Classical and Quantum Gravity, 30, 220301
- Brandt et al. (2000) Brandt W. N., Laor A., Wills B. J., 2000, ApJ, 528, 637
- Cuadra et al. (2009) Cuadra J., Armitage P. J., Alexander R. D., Begelman M. C., 2009, MNRAS, 393, 1423
- Dong et al. (2011) Dong R., Rafikov R. R., Stone J. M., 2011, ApJ, 741, 57
- D’Orazio et al. (2013) D’Orazio D. J., Haiman Z., MacFadyen A., 2013, MNRAS, 436, 2997
- Duffell & MacFadyen (2012) Duffell P. C., MacFadyen A. I., 2012, ApJ, 755, 7
- Fabbiano et al. (2011) Fabbiano G., Wang J., Elvis M., Risaliti G., 2011, Nature, 477, 431
- Farris et al. (2013) Farris B. D., Duffell P., MacFadyen A. I., Haiman Z., 2013, ArXiv e-prints
- Ferrarese & Ford (2005) Ferrarese L., Ford H., 2005, Space Sci. Rev., 116, 523
- Gold et al. (2013) Gold R., Paschalidis V., Etienne Z. B., Shapiro S. L., Pfeiffer H. P., 2013, Physical Review, submitted; e-print arXiv:1312.0600
- Gültekin & Miller (2012) Gültekin K., Miller J. M., 2012, ApJ, 761, 90
- Haiman et al. (2009) Haiman Z., Kocsis B., Menou K., 2009, ApJ, 700, 1952
- Haiman et al. (2009) Haiman Z., Kocsis B., Menou K., Lippai Z., Frei Z., 2009, Class. Quantum Grav., 26, 94032
- Hayasaki et al. (2007) Hayasaki K., Mineshige S., Sudou H., 2007, Publications of the Astronomical Society of Japan, 59, 427
- Hubeny & Hubeny (1997) Hubeny I., Hubeny V., 1997, ApJ, 484, L37
- Hubeny & Lanz (1995) Hubeny I., Lanz T., 1995, ApJ, 439, 875
- Kawaguchi (2003) Kawaguchi T., 2003, ApJ, 593, 69
- Kocsis et al. (2012) Kocsis B., Haiman Z., Loeb A., 2012, MNRAS, 427, 2660
- Kolykhalov & Sunyaev (1984) Kolykhalov P. I., Sunyaev R. A., 1984, Adv. in Sp. Res., 3, 249
- Komossa (2006) Komossa S., 2006, Mem. Soc. Astron. Ital., 77, 733
- Komossa et al. (2003) Komossa S., Burwitz V., Hasinger G., Predehl P., Kaastra J. S., Ikebe Y., 2003, ApJ, 582, L15
- Koratkar & Blaes (1999) Koratkar A., Blaes O., 1999, PASP, 111, 1
- Kormendy & Richstone (1995) Kormendy J., Richstone D., 1995, ARA&A, 33, 581
- Laor & Davis (2014) Laor A., Davis S. W., 2014, MNRAS, 438, 3024
- Leitherer et al. (1999) Leitherer C., Schaerer D., Goldader J. D., González Delgado R. M., Robert C., Kune D. F., de Mello D. F., Devost D., Heckman T. M., 1999, ApJS, 123, 3
- Lodato et al. (2009) Lodato G., Nayakshin S., King A. R., Pringle J. E., 2009, MNRAS, 398, 1392
- MacFadyen & Milosavljević (2008) MacFadyen A. I., Milosavljević M., 2008, ApJ, 672, 83
- Milosavljević & Phinney (2005) Milosavljević M., Phinney E. S., 2005, ApJ, 622, L93
- Noble et al. (2012) Noble S. C., Mundim B. C., Nakano H., Krolik J. H., Campanelli M., Zlochower Y., Yunes N., 2012, ApJ, 755, 51
- Phinney (2009) Phinney E. S., 2009, Science White Paper submitted to the Astro2010 Decadal Survey; e-print arXiv.org:0903.0098
- Rodriguez et al. (2006) Rodriguez C., Taylor G. B., Zavala R. T., Peck A. B., Pollack L. K., Romani R. W., 2006, ApJ, 646, 49
- Roedig et al. (2014) Roedig C., Krolik J. H., Miller M. C., 2014, ApJ, 785, 115
- Roedig et al. (2012) Roedig C., Sesana A., Dotti M., Cuadra J., Amaro-Seoane P., Haardt F., 2012, A&A, 545, A127
- Schaerer (2003) Schaerer D., 2003, A&A, 397, 527
- Sesana et al. (2012) Sesana A., Roedig C., Reynolds M. T., Dotti M., 2012, MNRAS, 420, 860
- Shakura & Sunyaev (1973) Shakura N. I., Sunyaev R. A., 1973, Astron. Astrophys., 24, 337
- Shen et al. (2013) Shen Y., Liu X., Loeb A., Tremaine S., 2013, ApJ, 775, 49
- Shi et al. (2012) Shi J.-M., Krolik J. H., Lubow S. H., Hawley J. F., 2012, ApJ, 749, 118
- Tanaka & Menou (2010) Tanaka T., Menou K., 2010, ApJ, 714, 404
- Tanaka et al. (2012) Tanaka T., Menou K., Haiman Z., 2012, MNRAS, 420, 705
- Tanaka (2013) Tanaka T. L., 2013, MNRAS, 434, 2275