Charge-order fluctuations and superconductivity in two-dimensional organic metals
Abstract
We report comprehensive Raman and infrared investigations of charge-order (CO) fluctuations in the organic metal -(BEDT-TTF)2SF5CHFSO3 and superconductor -(BEDT-TTF)2SF5CH2CF2SO3. The charge-sensitive vibrational bands are analyzed through an extension of the well-known Kubo model for the spectral signatures of an equilibrium between two states. At room temperature, both salts exhibit charge fluctuations between two differently charged molecular states with an exchange frequency of about . The exchange rate of the metallic salt remains roughly constant down to 10 K, while in the superconductor the exchange velocity starts to decrease below 200 K, and a “frozen” charge-ordered state emerges, and coexists with the charge-order fluctuation state down to the superconducting temperature. These findings are confronted with other spectroscopic experiments, and a tentative phase diagram is proposed for the BEDT-TTF quarter-filled salts.
pacs:
74.70.Kn, 74.25.Gz, 71.30.+h,I Introduction
Understanding the mechanism of superconductivity in strongly-correlated low-dimensional systems represents one of the major challenges of modern solid state physics. The competition/cooperation between different interactions, including electron-phonon, gives rise to complex phase diagrams, with Mott-like instabilities close to the superconducting one. In recent years, theoretical and experimental studies have suggested that fluctuations of an ordered state may mediate superconductivity. Among organic superconductors, magnetic fluctuations are thought to be relevant in certain classes of compounds,powell11 but in recent years attention has been focused on charge-order (CO) fluctuations occurring in quasi-two-dimensional quarter-filled systems.merino01 ; dressel04 ; seo06 However, the actual role of CO states and fluctuations on the superconductivity mechanism is still waiting for a deep understanding.
In order to shed light on the above issue, here we report the temperature evolution of the infrared and Raman spectra of two quarter-filled isostructural salts of bis(ethylenedithio)tetrathiafulvalene (BEDT-TTF, see inset of Fig. 1), characterized by the so-called packing. One of them, -(BEDT-TTF)2SF5CH2CF2SO3 (hereafter -SC), is a superconductor with K, geiser96 whereas the other, -(BEDT-TTF)2SF5CHFSO3 (hereafter -M), remains metallic down to the lowest temperature.ward00
Infrared and Raman spectroscopy has indeed proved to be a very useful tool in identifying the presence of charge disproportionation in the organic compounds,bozio80 ; pecile89 ; dressel04 since vibrational spectroscopy directly probes the charge distribution on lattice sites. The frequencies of the charge-sensitive vibrations of BEDT-TTF are known, and probing of charge distribution in the insulating state is a well established technique.yamamoto05 ; girlando11 Quite recently, it has been independently suggestedgirlando12 ; yakushi12 that vibrational spectroscopy can also be fruitfully exploited to analyze charges and charge fluctuations in metallic systems. The idea is borrowed from nuclear-magnetic-resonance spectroscopy, where it is well known that the line shape relevant to two chemical species in equilibrium depends on the difference in frequency between the two absorption energies and the speed of exchange. In this “two-states jump model”,kubo69 when the exchange is slow with respect to the energy difference one sees two bands, whereas when the exchange is fast one observes a single band in between the two energy levels. In a previous paper,girlando12 we have adapted the model to optical transitions, and tested it on the charge-sensitive infrared active C=C antisymmetric stretch of BEDT-TTF. Here we extend the model to Raman spectroscopy, and present a full comparative analysis of the temperature evolution of the spectra of the above mentioned superconducting and metallic salts.
II Experimental
The studied compounds were prepared as described in the literature.geiser96 ; ward00 The infrared (IR) spectra have been already published,drichko09 ; kaiser10 and are reproduced here for comparison. The Raman spectra have been collected from the crystal face with a Renishaw 1000 microspectrometer, with 647.1 nm excitation from a Lexel Krypton laser, with 0.1 mW power at the sample. Temperatures down to 10 K have been reached with ARS closed cycle cryostat fitted under the Raman microscope.
III Vibrational selection rules and the effects of e-mv coupling
The -SC and -M are isostructural, crystallizing in the triclinic system, with two formula units per unit cell.ward00 ; geiser96 The structure is characterized by layers of BEDT-TTF in the crystal plane, separated by the organic anions. Within the cation layer, the BEDT-TTF are arranged in tilted dimerized stacks, typical of the -packing motif,mori98 with the strongest interaction along the crystallographic -axis, i.e. perpendicular to the stacks. The center of inversion relates two BEDT-TTF molecules (e.g., A and A′ in Fig. 1), and the two pairs, AA′ and BB′, are crystallographically independent. We remark that the 300 K crystal structure of -M exhibits some degree of disorder in the terminal ethylene groups.ward00 No disorder is observed in the structure of -SC, which however has been collected at 123 K.
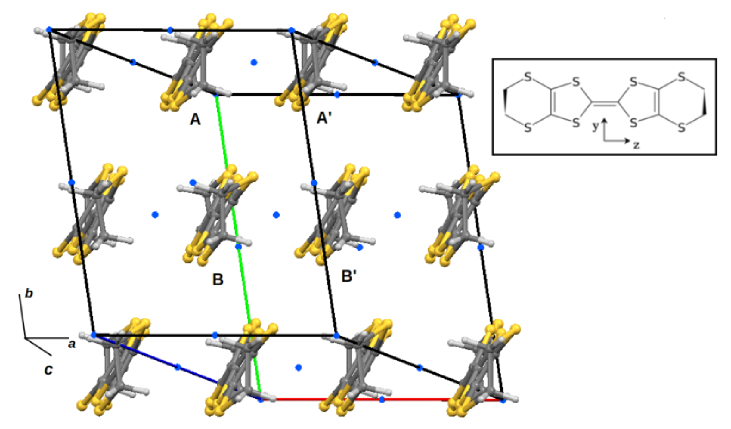
For the Raman and IR selection rules it is convenient to start by dealing separately with the two pairs of inequivalent dimers AA′ and BB′. Each pair is considered as a supermolecule, residing on a crystallographic inversion center. We can therefore apply the symmetric dimer model to carry out the spectral predictions and to analyze the effects of the electron-molecular vibration (e-mv) interaction.rice79 ; painelli86 In a centro-symmetric dimer, the vibrations of each molecular unit combine in-phase and out-of-phase. In the molecular symmetry, the 72 normal modes of each BEDT-TTF molecule are classified as: 18 (R) + 18 (R,IR) + 18 (R,IR) + 18 (R,IR), where R and IR indicate Raman and infrared activity, respectively.girlando11 In the dimer, we then have 72 (R) and 72 (IR) vibrations. The in-phase modes are completely decoupled from the charge-transfer (CT) interaction within the dimer,rice79 and we expect weak Raman intensity for modes originating from the in-phase combination of , and molecular vibrations. In other words, the Raman spectra of the dimer will be dominated by the 18 totally symmetric () vibrations in the molecular symmetry. The IR activity of the out-of-phase combination of the molecular vibrations belonging to the , and species will be substantially unaltered in the dimer: the modes will be polarized along the long molecular axis, namely approximately along the crystal axis (Fig. 1), the ones perpendicularly to the molecular planes (approximately along the crystal axis), and the perpendicularly to the former two (approximately along ). On the other hand, the out of phase combinations of the modes interact with the electronic system: they present a downward shift with respect to the corresponding Raman active in-phase combination, and borrow intensity from the CT electrons. Both the frequency shift and the intensity borrowing are connected to , the zero-frequency electronic susceptibility, and to , the square of the e-mv coupling constants.rice79 ; painelli86 The e-mv coupled modes will be polarized along the stack ( crystal axis), like the molecular vibrations.
We now turn attention to the interaction between the AA′ and BB′ dimers. It is formally an “interstack” interaction, but actually the hopping integral between the stacks is larger than that along the stack.ward00 We shall continue the analysis by taking the dimer as a supermolecular entity, although the results are not different from those obtainable by starting from the separated molecules. In the following, when we refer to modes of symmetry, for instance, we actually mean “the combination of molecular modes within the dimer (either in-phase or out-of-phase, depending on the context). Since the dimers are inequivalent, we can speak about approximately in-phase and out-of-phase coupled dimer vibrations, with corresponding pseudo Davydov splitting.turrell In any case, the spectral prediction concerning the non-totally symmetric (in the molecular symmetry) vibrations are not substantially altered with respect to those seen above for a single dimer (or stack). For example, the modes we shall be concerned with in the following, are weak in Raman, and appear in the IR spectra polarized along the -axis (almost perpendicular to ). They will not exhibit any appreciable splitting, since anti-parallel transition dipole moments cancel each-other.schwoerer On the other hand, important spectroscopic effects are expected for the modes, following the “interstack” CT interaction, due to the e-mv coupling. In the analysis, we can follow again a dimer-like approach. In this case, however, the dimer is non-symmetric: according the x-ray data, the A and B stacks are inequivalent and bear a different molecular charge.geiser96 ; ward00 The consequences of e-mv coupling on the IR spectra of such kind of systems has been first analyzed by M. J. Rice et al.rice80 for MEM(TCNQ)2 (MEM = N-methyl-N-ehylymorpholinium, TCNQ = tetracyanoquinodimethane). Girlando et al.girlando82 have extended the model to consider the consequences of e-mv coupling on the Raman spectra of a mixed-stack solid like TTF-CA (TTF = tetrathiafulvalene, CA = chloranil), which from the point of view of symmetry is equivalent to a non-symmetric dimer.
The spectral consequences of e-mv coupling in a non-symmetric dimer differ from those in a symmetric dimer. In particular, there is no in-phase and out-of-phase coupling between monomer-degenerate modes. This has an important consequence for the mutual exclusion rule for the Raman and infrared activity: all the modes of the BEDT-TTF moieties are active (with the same frequency) in Raman and in IR, hence both the spectra are affected by the e-mv interaction. The frequencies of the e-mv perturbed modes can be obtained from the diagonalization of the following “force constants” matrix:painelli86 ; hanfland88
| (1) |
where is the unperturbed frequency, and is the Kronecker delta. The zero-frequency electronic susceptibility depends on the CT excitation frequency, , and on the molecular ionicity , , and is maximum for equally charged molecules (the symmetric dimer). We finally remark that whereas the consequences of e-mv interaction on the IR spectral features have been accurately reproduced in terms of the appropriate model,rice80 ; girlando82 very little is known about the expected Raman intensities, also because these are connected more to the intra-molecular electronic structure.
In the following, we shall mainly deal with the charge-sensitive molecular vibrations, namely the three C=C stretching modes, , and (known respectively as , and in the molecular symmetry).girlando11 The mode is not coupled to the electronic system. It may appear with weak intensity in the Raman spectrum, but is well detectable in the IR spectra polarized along the -axis. In case the A and B dimers (on adjacent stacks) bear different charges, it will appear as a doublet, with the same polarization. The modes are instead affected by the e-mv interaction, connected to the interaction between the inequivalent dimers. Therefore the frequencies of the modes may have a nonlinear dependence on the molecular charge. Such dependence can be calculated by diagonalizing the matrix of Eq. (1), and is shown in Fig. 2. The parameters used are:girlando11 ) cm-1, meV, ) cm-1, meV. In the spirit of a semiempirical approach, the CT frequency which appears in the espression in the dimer model has been taken as adjustable parameter, cm-1.
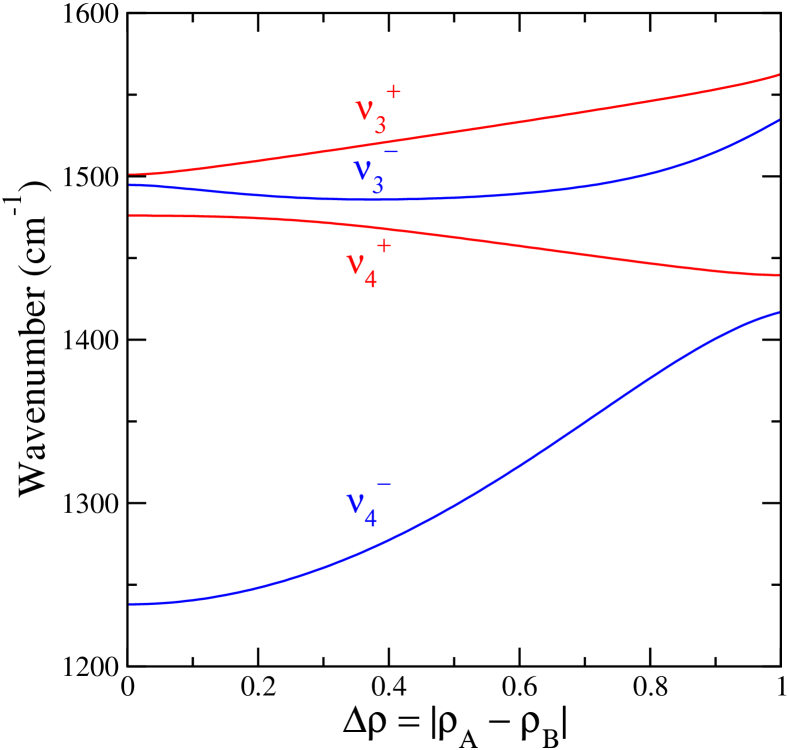
In Fig. 2 the frequencies of the and modes of the two stacks are displayed as a function of their charge difference, . corresponds to two equivalent stacks, with uniform charge distribution, and in this point the difference between the in-phase (red in the figure) and out-of-phase (blue) coupled vibrations reflects the only effect of e-mv interaction. By increasing above zero all the four vibrations become coupled together and to the electronic system with the resulting non-linearities observed in the Figure. The red and blue curves now correspond to charge-poor and charge-rich molecules, respectively. Actually, as it has been already noted,yakushi12 the mode retains a linear behavior for small charge disproportionation . Above such a values, only the frequency of the “charge poor” molecule (, red line) continues to have a linear dependence. In any case, the molecular ionicity can be estimated for the whole range of values by comparing the observed Raman frequencies to Fig.2 diagram.
IV Results
Fig. 3 reports the Raman spectra of -SC at room temperature and at 10 K in the spectral region where the totally symmetric charge-sensitive modes occur (1200-1600 cm-1, cf. Fig. 2). At 300 K, only one asymmetric band is detected, which splits into three bands as the temperature is reduced to 10 K. No band is detected in the region where the mode is expected. The is the mode most strongly coupled to the electronic system, and the component displays large IR intensity,girlando11 but is generally rather weak and broad in Raman. Thus it is rarely detected there.yamamoto12 In the present case the mode is difficult to identify also in IR, since it overlaps with low-energy electronic transitions.kaiser10 ; dong99 The three bands seen in the low-temperature spectrum of -SC clearly correspond to the and (in the order of decreasing wavenumber). The latter is rather insensitive to the charge (Fig. 2), so the analysis of the temperature evolution of the molecular charges for the two salts considered here will be based on the mode in Raman spectra, which will complement that based on the , active in IR.girlando12
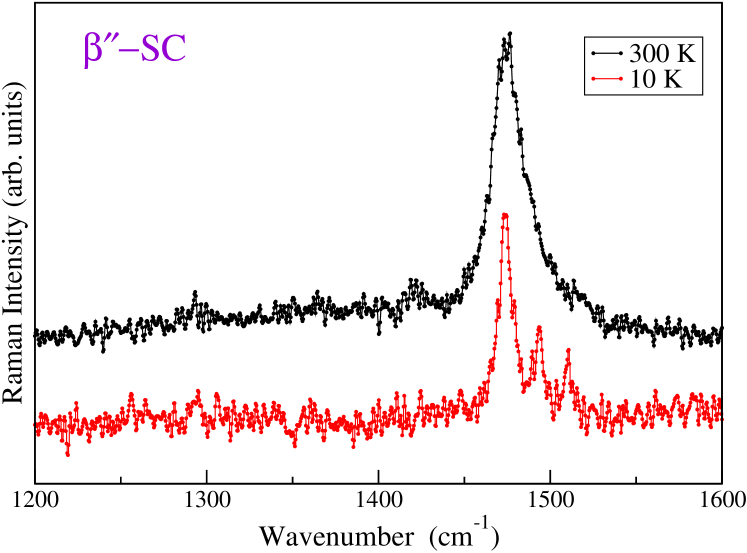
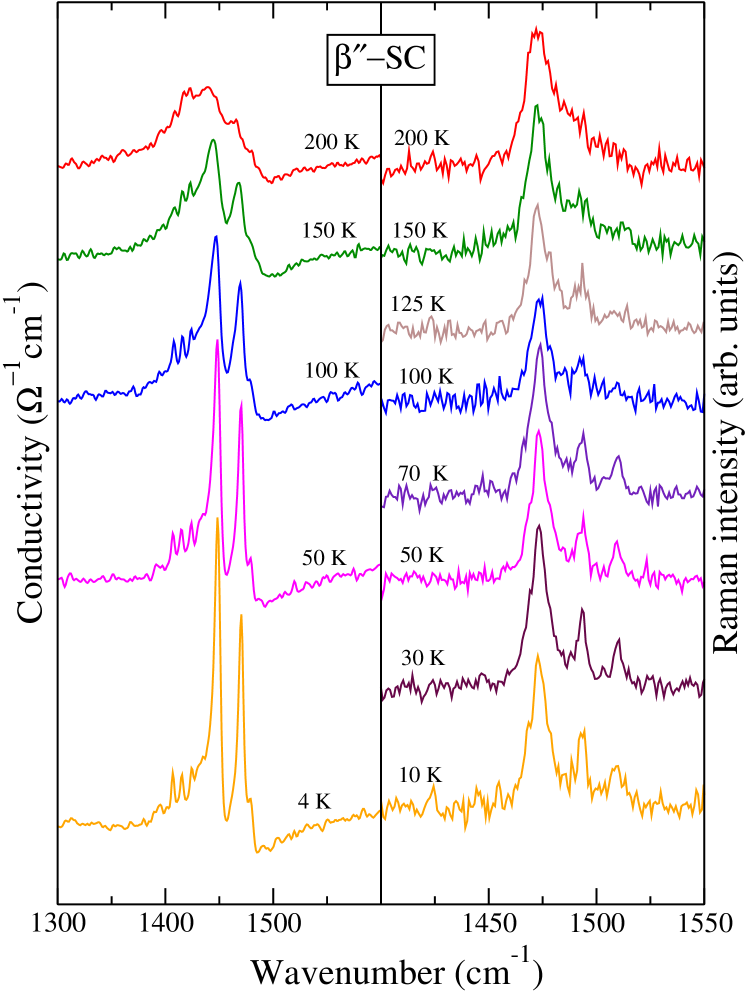
Fig. 4 compares the temperature evolution of the infrared conductivity (left, from Ref. drichko09, ) and of the Raman spectra (right) of -SC in the spectral region of interest. Whereas the ambient-temperature Raman spectrum (Fig. 3) do not allow to clearly separate the contribution of the and modes, at 200 K a broad feature between 1485 and 1510 cm-1 can be unambiguously identified. At room temperatures the polarized IR spectra present a very broad band, centered around 1440 cm-1, which is associated with the mode and is indicative of charge fluctuations.girlando12 At 200 K the 1440 cm-1 IR band starts to show a more complex structure (Fig. 4, top left), whereas at 150 K a doublet clearly emerges both in IR and in Raman, signaling the beginning of some sort of charge localization. By lowering the temperature, the frequencies of the doublet remains basically unaltered, the separation of approximately 20 cm-1 corresponding to a charge difference of about 0.2 (Ref. girlando12, and Fig.2). The intensities of the doublet increase with temperature, a fact that can be better appreciated from the IR data. The IR spectra also show that the broad band centered around 1440 cm-1 at room temperature is still present at 4 K, with an intensity which progressively decrease with lowering . In Raman measurements, this is less evident, due to the intrinsic weakness of the signal.
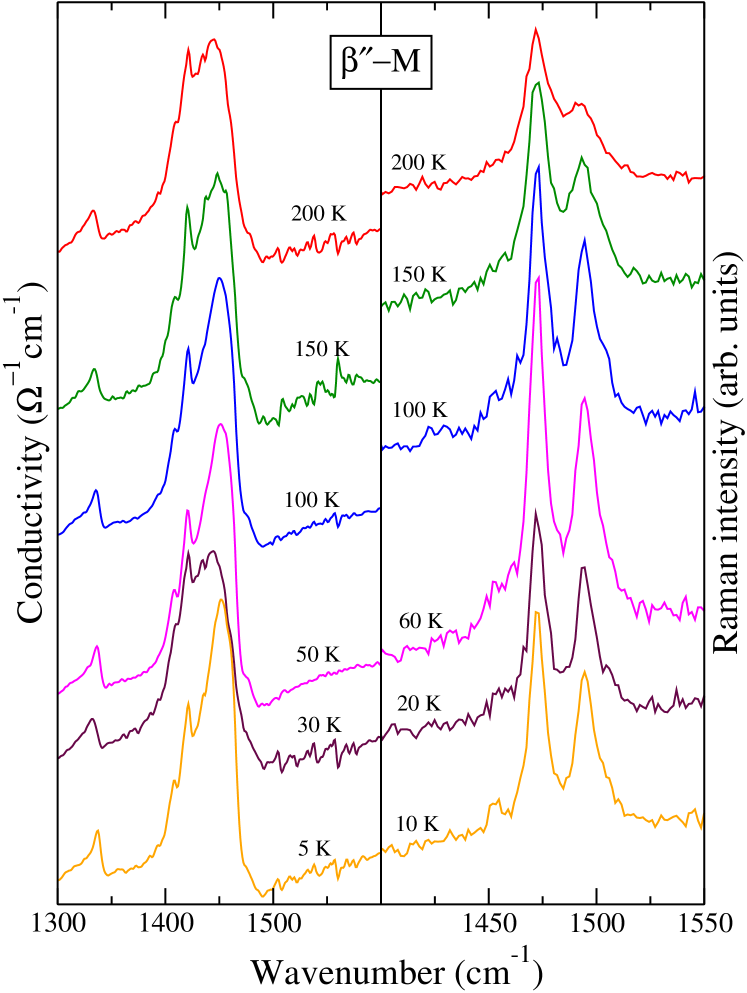
The temperature-evolution of -M conductivity and Raman spectra, shown in Fig. 5, differs markedly from that of -SC. In fact, in IR conductivity the band associated to the mode, around 1449 cm-1, remains broad down to 5 K. The situation is similar in the Raman spectra, where we can identify the 1472 cm-1 band with the mode, but where at all temperatures we observe a single band, at about 1494 cm-1, to be associated with the . Since the x-ray structure indicate two inequivalent stacks bearing different charges,ward00 it is clear that in this case we have a persistent charge fluctuation regime, that we shall now analyze in more detail.
V Analysis
In Ref. girlando12, we have suggested that the frequency and band-shape of the mode in the fluctuation regime can be understood by assuming the charge to “jump” stochastically between differently charged molecules. Kubo has shown that in case of two chemical species with some exchange between them and absorption energies relatively close, the line shape depends on the difference in frequency between the two absorption energies and the exchange rate. In case the exchange is slow, two distinct narrow bands are present. As the exchange becomes faster the lines move closer together and widen. In the limit of very fast exchange only one wide band is observed right between the two levels.kubo69
Kubo’s “two-states-jump model” has been adapted to account for frequency and band-shape of the mode in different regimes. The model can be actually used both for IR and Raman, by substituting the Raman intensity in place of the IR oscillator strength.girlando12 ; yakushi12 ; Sedlmeier12
The band-shape function is given by the real part of:
| (2) |
here , where and are the oscillator strengths (Raman intensities) of the bands of frequency and and common halfwidth . The charge fluctuation velocity is , and is the sum of the intrinsic width and the exchange rate , . Finally, the average and weighted frequency, and , are defined by:
| (3) |
If the transition rate , Eq. (2) yields two separated bands located at and , while if , the motional narrowing will give one single band centered at the intermediate frequency . On the other hand, when we shall observe one broad band whose spectral weight is shifted towards the mode with higher oscillator strength.
Fitting the experimental spectra with Eq. (2) will then provide the frequencies and , i.e. the corresponding ionicity , the ratio of the oscillator strengths, and the velocity of the charge fluctuations. In the IR range the fitting is constrained, as the frequencies and oscillator strengths are bound to follow the calculated dependence on .girlando11
.
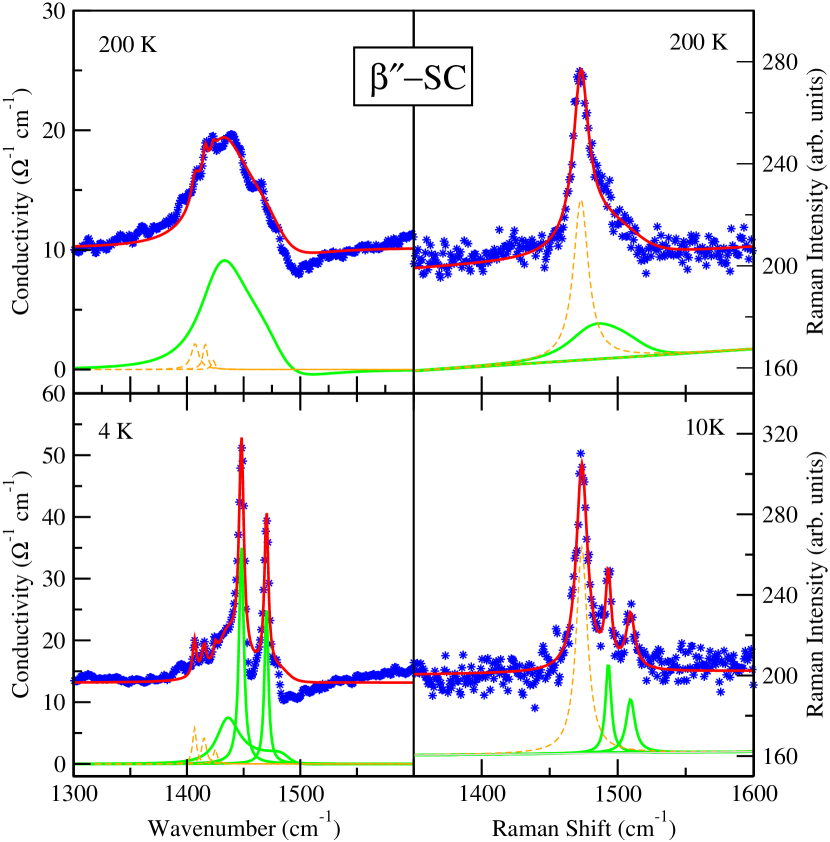
The fit of the 200 and 5 K IR spectrum of -SC is shown in the left panels of Fig. 6. At 200 K, the single broad and somewhat structured band can be satisfactorily fitted with three weak Lorentzian bands associated with charge-unrelated CH2 bending modes (dotted orange lines in the Figure), and by Eq. (2) fluctuation model relevant to the (green line). The fitting parameters of the latter are reported in Tab. 1. The 4 K IR data are reproduced as the superposition of two Lorentz oscillators, due to mode relevant to a static CO state, and one Eq. (2) bandshape, related to the surviving fluctuation regime, all indicated by the green line in the bottom left panel of the figure. The static CO states correspond to the Lorentzians bands at 1448 cm-1 with and 1470 cm-1 with , whereas the parameters of the fluctuating regime are reported in Table 1.
| SC | M | ||||||||
| IR | Raman | IR | Raman | ||||||
| (K) | 200 | 4 | 200 | 10 | 200 | 5 | 200 | 10 | |
| (cm-1) | 72 | 56 | 57 | – | 55 | 45 | 40 | 25 | |
| 0.52 | 0.40 | 0.52 | – | 0.40 | 0.32 | 0.38 | 0.30 | ||
| (cm-1) | 22 | 11 | 21 | – | 24 | 22 | 26 | 25 | |
In the 200 K Raman spectrum (right upper panel of Fig. 6) the mode peaks at 1472 cm-1; we have fitted the band by a simple Lorentzian since even in the fluctuation regime the exchange velocity, as estimated from the IR data, is much less than the frequency difference between the two differently charged states (Fig. 2). Once this contribution is subtracted, the high frequency side of the band, due to the , can be fitted by Eq. (2). The obtained parameters are consistent with those extracted from the IR spectrum and are summarized in Tab. 1. In the K Raman spectrum (lower right panel of Fig. 6) we can identify three bands. The low-frequency peak corresponds to the mode of the charge-rich molecules. The two other Raman bands are assigned to the mode of the charge-rich and charge-poor BEDT-TTF in a CO frozen state. They can be analyzed in terms of simple Lorentzian oscillators centered around 1493 and 1509 cm-1, corresponding to and 0.57, respectively. The findings are in perfect agreement with the results obtained from the analysis of the IR mode. Given the weak intensity of the spectrum, it is not possible in this case to identify bands which could be attributed to the surviving fluctuation regime.
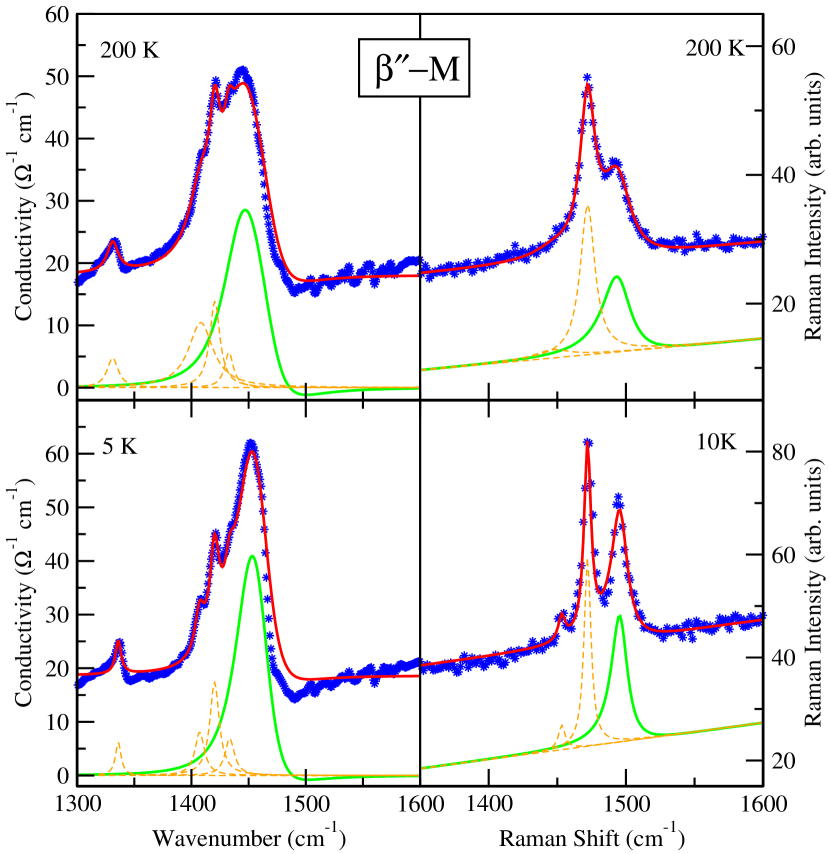
For the metallic compound -M the fits of the 200 and 10 K IR and Raman spectra are presented in Fig. 7 in the spectral region of the charge sensitive modes. The 200 K spectra look very similar to the corresponding ones of -SC, and can be described with the two-state jump model. Here we had to subtract the charge-unrelated bands, either connected to the CH2-bending mode in the IR spectrum or the feature observed in the Raman spectrum (dashed orange lines). The fit parameters for the IR and Raman data are reported in Tab. 1. When commenting Fig. 5 we have already noted that in -M the fluctuation regime is retained down to lowest temperatures. The analysis of the IR and Raman spectra, performed in the same fashion as for the 200 K spectra, provides a consistent picture: the obtained parameters are reported in Tab. 1. The comparison between the fit parameters at the two different temperature reveals that the variation in the spectra upon lowering is more due to a change in the ground state ionicity than to a change in .
.
VI Discussion
The simultaneous analysis of the IR and Raman spectra of -SC and -M gives a quite consistent picture. At room temperature both salts are in a charge-order fluctuation regime. The A and B stacks bear a different amount of charge, and fluctuations occur between these “stripes” aligned along the -axis. Upon lowering the temperature to 5-10 K, the spectra of -M and -SC evolve distinctively. This difference in the temperature-dependence is illustrated in detail in the top and middle panel of Fig. 8, where we report the parameters which best characterize the charge order, the disproportionation and the exchange velocity . For the metallic salt -M, the fluctuation regime persists down to the lowest temperature; the exchange velocity remains essentially unchanged (within the fitting uncertainties) and the charge distribution becomes slightly more uniform. In the SC salt -SC, a “frozen” CO state starts to emerge below 200 K, well above the superconducting phase at K; this state coexists with the fluctuation regime down to the lowest temperatures.
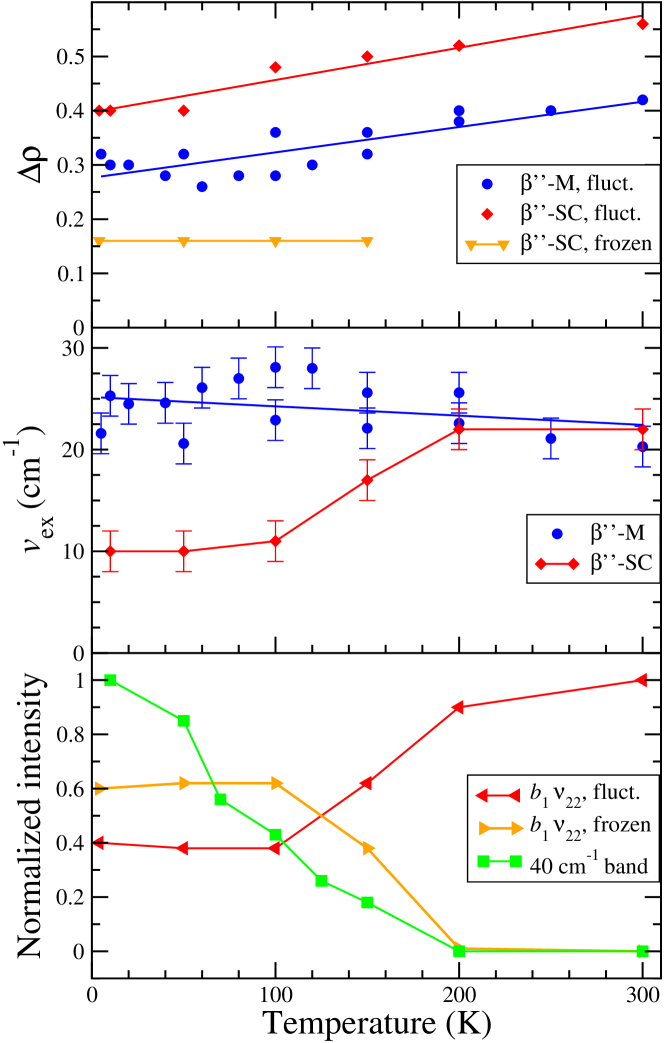
The temperature evolution of the spectra (Fig. 4) suggests that the relative weight of the frozen CO regime, whose is constant with , increases at the expenses of the fluctuating regime. This is quantitatively shown in the bottom panel of Fig. 8, where the temperature dependence of the normalized intensities of the corresponding bands is plotted. The normalization is performed with respect to the total intensity of the bands, which is approximately constant with temperature. The bands corresponding to the frozen CO regime start to borrow intensity from those corresponding to the fluctuating regime mainly in the range between 200 and 100 K. Below this temperature, the relative intensities remains approximately constant, and at the superconducting temperature the fluctuating regime is still present. Indeed, of -SC (middle panel of Fig. 8) halves between 200 and 100 K, but does not go to zero, which would imply a complete metal to insulator transition.
It is instructive to connect the present data with complementary measurements on the two salts. The x-ray analysis indicates that a charge disproportionation is already present at 300 K,geiser96 ; ward00 but the existence of the charge fluctuation regime makes both salts two-dimensional metals; actually “bad metals” as for most BEDT-TTF salts. By lowering , the resistivity of -SC exhibits a change in slope around 150 K, where the spectral signatures of a frozen CO clearly appear, and the fluctuations starts to slow down. In contrast, no anomalies are observed in the temperature-dependent resistivity of -M.glied09
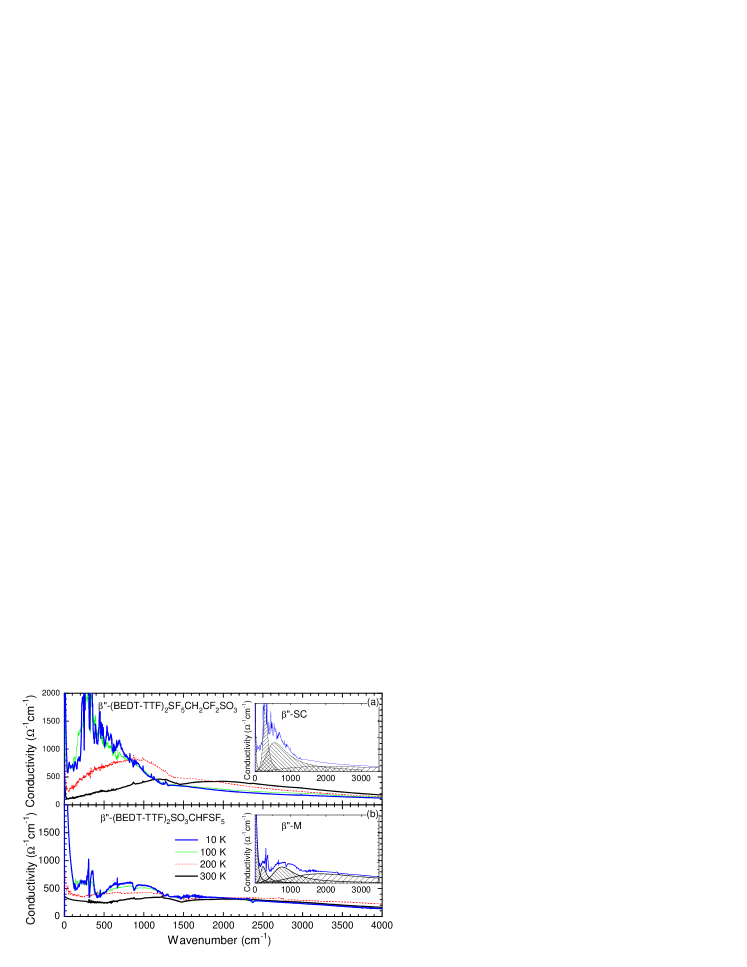
As shown in Fig. 9, the optical conductivity within the plane contains three main features which are common to both salts:kaiser10
-
•
A broad band around 2000-3000 cm-1, associated with site-to-site transitions within fluctuating CO patterns;
-
•
a narrow Drude peak describing the coherent-carrier response that is also responsible for the dc transport and superconductivity;
- •
In addition there are two features observed in the in-plane conductivity spectra, which distinguish -SC from -M, and which start to develop below approximately 150 K when the charge localization begins:kaiser10
-
•
A phonon mode at cm-1 that is only observed for the electric vector polarized perpendicular to the -axis (therefore roughly parallel to , cf. Fig. 1). The temperature evolution of its intensity (normalized to the intensity at the lowest temperature) is reported in the lower panel of Fig. 8 (squares, green line).
-
•
An additional broad feature appears around 300 cm-1 in the optical spectrum polarized along the axis. The temperature evolution of this band is difficult to follow, since the band changes shape and position (in addition to the intensity). A similar mode may also be present in the -M salt; however its intensity is much weaker and it remains a more or less temperature independent.
The interpretation of this distinctive second feature remains uncertain;kaiser10 it is not clear whether and how it is associated with the presence of the mixed phase, containing fluctuating and frozen CO. On the other hand, the bottom panel of Fig. 8 demonstrates that the intensities of the cm-1 band and the mode that is associated to the frozen CO regime below K increase simultaneously. This is a strong indication that the two features have the same origin. Hence we associate the low-frequency mode with oscillations of the frozen CO. Since this mode is polarized along the -axis, namely along the stacks, the frozen CO is established along the stack. In other words the inversion symmetry present in the stacks is actually broken, and the charge disproportionation involves the A and A′ (and in analogy B and B′) molecules along the stack (Fig. 1). This symmetry breaking is not detected by the x-ray analysis below K,geiser96 but it is well known that x-ray detects long range order only, whereas vibrational spectroscopy probes the local environment. In this interpretation, the low-frequency phonon would be associated with oscillations of a charge-ordered string along the -axis, whereas we recall that the fluctuations presumably occur between the charge-ordered stripes on different stacks, namely, along the -axis (Fig. 1).
In the light of the above data, we suggest that below approximately 200 K two different, almost orthogonal, types of charge order start to develop in SC: a fluctuating CO between A and B stacks, leading to the broad bands interpreted in terms of Eq. (2), and frozen CO strings along the stacks, leading to the low-frequency mode at cm-1. This picture is strongly reminiscent of the coexistence of different sorts of charge modulation observed by diffuse x-ray in -(BEDT-TTF)2Cs(SCN)4 ( = Co, Zn).nogami99 Udagawa and Motomeudagawa07 have attributed this coexistence to the competition between nearest-neighbor electron-electron interaction, causing a regular charge order, and Fermi surface nesting, leading to a commensurate charge-density wave. A similar scenario might be applicable to the present case, since the frozen CO appears to be related to an intermolecular phonon. Diffuse x-ray investigation as a function of temperature on both -SC and -M amended by appropriate modeling is required to confirm this idea.
It is instructive to take into consideration two other salts in the series -(BEDT-TTF)2SF5RSO3, i.e. -(BEDT-TTF)2SF5CH2SO3 (hereafter -I),ward00 and -(BEDT-TTF)2SF5CHFCF2SO3 (hereafter -MI). olejniczak99 ; jones00 ; schlueter01 ; garlach02 The two salts are isomorphous with -SC and -M, but have very distinct electrical properties: -I is semiconductor already at room temperature, whereas -MI has a metal-to-insulator transition around K. Unfortunately, infrared data have been collected only in the conducting plane, and Raman spectroscopy has been measured at room temperature only. From the optical conductivityolejniczak09 and from a reanalysis of the Raman data presented in Ref. ward00, , we deduce that -I is in a full CO state, with to 0.6. On the other hand, the room temperature Raman spectrum of -MI in the charge sensitive region is practically identical to that of -M,schlueter01 suggesting a fluctuating CO regime with very similar . The metal-insulator transition of -MI has been ascribed to electron localization due to anion ordering. It is plausible to assume that the anion ordering also induces a CO on the cation.
To summarize, at room temperature the four salts of the -(BEDT-TTF)2SF SO3 family all display a charge disproportionation between 0.4 and 0.6, most probably between the A and B stacks (cf. Fig. 1). -I is in a fully charge-ordered state, whereas the other three salts are in a charge-fluctuation regime, with metallic conductivity. By lowering the temperature, -M remains in the fluctuating regime, whereas -MI undergoes a phase transition around K accompanied by charge localization. Finally, below 200 K -SC exhibits a “mixed phase”, with the coexistence of fluctuating and frozen regimes. This coexistence persists down to the superconducting phase.
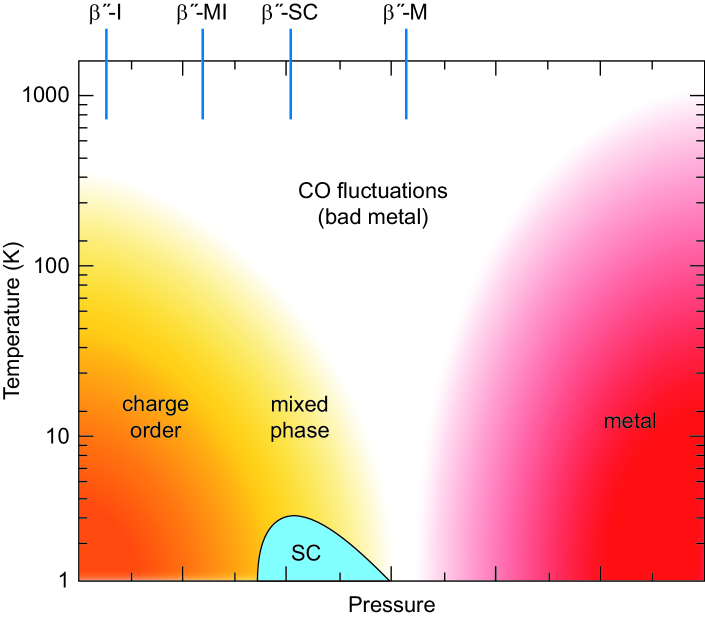
Based on the above scenario, we propose the empirical phase diagram presented in Fig. 10. The pressure axis refers to chemical pressure, and could be replaced by the intermolecular Coulomb interaction , running in opposite direction. This diagram can be compared with that theoretically proposed for the and the (BEDT-TTF) structuresmerino01 and also applicable to the -(BEDT-TTF) compounds.Dressel03 ; Drichko06 Our empirical diagram is very similar, the conductivity of the metallic phase is typical of a “bad metal”, and presumably due to charge fluctuations between the BEDT-TTF units. However, we also find that between the metallic phase and the charge-ordered insulating phase, there is a region of coexistence, where the system is still metallic, but regions of frozen charge order develop. The region of coexistence is rather intriguing, and of course cannot be predicted within mean field theories. On the other hand, the coexistence is not due to macroscopic domains at the borderline between two phases, since the temperature interval is rather large, and perfectly reproduced in different runs and measurements. As we have already stated, the coexistence is likely due to the competition between two different interactions, driving towards different charge-ordered states.
VII Conclusions
In a comprehensive study we have compared the temperature dependence of the Raman and infrared active charge-sensitive vibrations of BEDT-TTF in -SC and -M salts. We could delineate the interplay of charge order, charge fluctuations and superconductivity in these two-dimensional quarter-filled electron systems. Two distinct charge-ordered states could be identified in -SC: one fluctuating and the other static; they are almost orthogonally polarized and coexist below 200 K down to the critical temperature K. This “mixed phase”, not found in -M, is likely the results of the competition/cooperation of different interactions. It then becomes clear that very weak additional interactions may tune the system towards one or the other ground state. In this scenario, it is uncertain whether or not the “mixed phase” is essential to the development of superconductivity, since so far this phase has been found only in -SC, and not in other superconductors with either or in the similar or structure. But of course it has not been expressly looked for.
Acknowledgments
The work in Parma has been supported by the Italian Ministry of University and Research (M.I.U.R.) under the project PRIN-2010ERFKXL. We would like to thank the Deutsche Forschungsgemeinschaft (DFG) for financial support. N. Drichko acknowledges a support of Margarete von Wrangell Habilitationstipendium. J. A. Schlueter acknowledges support from the Independent Research/Development program while serving at the National Science Foundation.
References
- (1) B. J. Powell and R. H. McKenzie, Rep. Prog. Phys. 74, 056501 (2011).
- (2) J. Merino and R. H. McKenzie, Phys. Rev. Lett. 87, 237002 (2001).
- (3) M. Dressel and N. Drichko, Chem. Rev. 104, 5689 (2004).
- (4) H. Seo, J. Merino, H. Yoshioka and M. Ogata J. Phys. Soc. Japan 75, 051009 (2006).
- (5) U. Geiser, J. A. Schlueter, H. H. Wang, A. M. Kini, J. M. Williams, P. P. Sche, H. I. Zakowicz, M. L. Vanzile, J. D. Dudek, P. G. Nixon, R. W. Winter, G. L. Gard, J. Ren, and M.-H. Whangbo, J. Am. Chem. Soc. 118, 9996 (1996).
- (6) B. H. Ward, J. A. Schlueter, U. Geiser, H. H. Wang, E. Morales, J. P. Parakka, S. Y. Thomas, J. M. Williams, P. G. Nixon, R. W. Winter, G. L. Gard, H.-J. Koo, and M.-H. Whangbo, Chem. Mater. 12, 343 (2000).
- (7) R. Bozio and C. Pecile, in The Physics and Chemistry of Low Dimensional Solids, L. Alcacer Ed. (Reidel, Dordrecht, 1980) p. 165.
- (8) C. Pecile, A. Painelli, and A. Girlando, Mol. Cryst. Liq. Cryst. 171, 69 (1989).
- (9) T. Yamamoto, M. Uruichi, K. Yamamoto, K. Yakushi, A. Kawamoto, and H. Taniguchi, J. Phys. Chem. B 109 15226 (2005).
- (10) A. Girlando, J. Phys. Chem. C 115, 19371 (2011).
- (11) A. Girlando, M. Masino, S. Kaiser, Y. Sun, N. Drichko, M. Dressel, and H. Mori, phys. stat. sol. b, 249, 953 (2012).
- (12) K. Yakushi, Crystals, 2, 1291 (2012).
- (13) R. Kubo, in Stochastic Processes in Chemical Physics, K. E. Shuler, Ed., Advances in Chemical Physics, 15, Ch. 6, J. Wiley, New York, (1969).
- (14) N. Drichko, S. Kaiser, Y. Sun, C. Claus, M. Dressel, H. Mori, J. Schlueter, E. I. Zhyliaeva, S. A. Torunova, and R. N. Lyubovskaya, Physica B 404, 490 (2009).
- (15) S. Kaiser, M. Dressel, Y. Sun, A. Greco, J. A. Schlueter, G. L. Gard, and N. Drichko, Phys. Rev. Lett. 105, 206402 (2010).
- (16) T. Mori, Bull. Chem. Soc. Jpn 71, 2509 (1998).
- (17) M. J. Rice, Solid State Comm. 31, 93 (1979).
- (18) A. Painelli and A. Girlando, J. Chem. Phys. 84, 5655 (1986).
- (19) G. Turrell, Infrared and Raman Spectra of Crystals (Academic Press, London and New York, 1972).
- (20) M. Schwoerer and H. C. Wolf, Organic Molecular Solids (Wiley-VCH, Weinheim, 2007), p. 137.
- (21) M. J. Rice, V. M. Yartsev, and C. S. Jacobsen, Phys. Rev. B 21, 3437 (1980).
- (22) A. Girlando, R. Bozio, C. Pecile, and J. B. Torrance, Phys. Rev. B 26, 2306 (1982).
- (23) M. Hanfland, A. Brillante, A. Girlando, and K. Syassen, Phys. Rev. B 38, 1456 (1988).
- (24) T. Yamamoto, Crystals 2, 893 (2012).
- (25) J, Dong, J. L. Musfeldt, J. A. Schlueter, J. M. Williams, P. G. Nixon, R. W. Winter and G. L. Gard, Phys. Rev. B 60, 4342 (1999).
- (26) K. Sedlmeier, S. Elsässer, D. Neubauer, R. Beyer, Dan Wu, T. Ivek, S. Tomić, J.A. Schlueter, and M. Dressel, Phys. Rev. B 86, 245103 (2012).
- (27) M. Glied, S. Yasin, S. Kaiser, N. Drichko, M. Dressel, J. Wosnitza, J. A. Schlueter, and G. L. Gard, Synth. Metals 159, 1043 (2009)
- (28) J. Merino, A. Greco, N. Drichko, and M. Dressel, Phys. Rev. Lett. 96, 216402 (2006).
- (29) N. Drichko, M. Dressel, C. A. Kuntscher, A. Pashkin, A. Greco, J. Merino, and J. Schlueter, Phys. Rev. B 74, 235121 (2006).
- (30) Y. Nogami, J.-P. Pouget, M. Watanabe, K. Oshima, H. Mori, S. Tanaka, and T. Mori, Synth. Metals 103, 1911 (1999).
- (31) M. Udagawa and Y. Motome, Phys. Rev. Lett. 98, 206405 (2007).
- (32) I. Olejniczak, B. Jones, Z. Zhu, J. Dong, J. L. Musfeldt, J. A. Schlueter, E. Morales, U. Geiser, P. G. Nixon, R. W. Winter, and G. L. Gard, Chem. Mater. 1999, 11, 3160-3165.
- (33) B. R. Jones, I. Olejniczak, J. Dong, J. M. Pigos, Z.T. Zhu, A. D. Garlach, J. L. Musfeldt, H.-J. Koo, M.-H.Whangbo, J. A. Schlueter, B. H. Ward, E. Morales, A. M. Kini, R. W. Winter, J. Mohtasham, and G. L. Gard, Chem. Mater. 12, 2490 (2000).
- (34) J. A. Schlueter, B. H. Ward, U. Geiser, H. H. Wang, A. M. Kini, J. Parakka, E. Morales, H.-J. Koo, M.-H. Whangbo, R. W. Winter, j. Mohtasham, and G. L. Gard, J. Mater. Chem. 11, 2008 (2001).
- (35) A. D. Garlach, J. L. Musfeldt, J. M. Pigos, B. R. Jones, P. A. Varughese, I. Olejniczak, A. Graja, M.-H. Whangbo, J. A. Schlueter, U. Geiser, U., and G. L. Gard, Chem. Mater. 2002, 14, 2969-2976.
- (36) I. Olejniczak, B. Barszcz, A. Graja, and J. A. Schlueter, Mat. Sci. Poland 27, 619 (2009).
- (37) M. Dressel, N. Drichko, J. Schlueter, and J. Merino, Phys. Rev. Lett. 90, 167002 (2003).
- (38) N. Drichko, M. Dressel, C. A. Kuntscher, A. Pashkin, A. Greco, J. Merino, and J. Schlueter Phys. Rev. B 74, 235121 (2006).