11email: ozamora@iac.es 22institutetext: Departamento de Astrofísica, Universidad de La Laguna (ULL), E-38206 La Laguna, Tenerife, Spain 33institutetext: Laboratoire Univers et Particules de Montpellier, Université Montpellier 2, CNRS, F-34095 Montpellier, France 44institutetext: Consejo Superior de Investigaciones Científicas (CSIC), Spain
Circumstellar effects on the Rb abundances in O-rich AGB stars
For the first time we explore the circumstellar effects on the Rb (and Zr) abundance determination in O-rich asymptotic giant branch (AGB) stars by considering the presence of a gaseous circumstellar envelope with a radial wind. A modified version of the spectral synthesis code Turbospectrum was used to deal with extended atmosphere models and velocity fields. The Rb and Zr abundances were determined from the resonant 7800 Å Rb I line and the 6474 Å ZrO bandhead, respectively, in five representative O-rich AGB stars with different expansion velocities and metallicities. By using our new dynamical models, the Rb I line profile (photospheric and circumstellar components) is very well reproduced. Interestingly, the derived Rb abundances are much lower (by 1-2 dex) in those O-rich AGB stars showing the higher circumstellar expansion velocities. The Zr abundances, however, remain close to the solar values. The Rb abundances and [Rb/Zr] ratios derived here significantly resolve the problem of the present mismatch between the observations of intermediate-mass (4–8 M☉) Rb-rich AGB stars and the AGB nucleosynthesis theoretical predictions.
Key Words.:
Stars: AGB and post-AGB – Stars: abundances – Stars:evolution – Nuclear reactions, nucleosynthesis, abundances – Stars: atmospheres – Stars: late-type1 Introduction
The asymptotic giant branch (AGB) is the last nuclear-burning phase of low- and intermediate-mass stars (0.8 M 8 M☉). The AGB stars are among the main contributors to the chemical enrichment of the interstellar medium since they suffer strong mass loss together with nucleosynthesis processes (see e.g. Busso et al. 1999). Low-mass AGB stars (M 4 M☉) can turn C-rich (i.e. C/O 1) because of the dredge-up of carbon from the bottom of the convective envelope to the stellar surface. The -process allows the production of elements heavier than iron by neutron-captures. In these stars, the 13C(, n)16O reaction is assumed to operate as the main neutron source (e.g. Abia et al. 2001). On the other hand, intermediate-mass AGB stars ( 4 M 8 M☉) are O-rich stars (C/O 1) because of the operation of hot bottom burning (HBB), which burns carbon at the base of the convective envelope, thus preventing the formation of a carbon star (Sackmann & Boothroyd 1992). In these carbon stars, the -process elements are expected to form mainly by the neutrons released by the 22Ne(, n)25Mg reaction, in a higher neutron density environment than in lower mass AGB stars (García-Hernández et al. 2006). The relative abundance of s-elements such as Rb to other neighboring ones such as Sr, Y, and Zr is an indicator of the neutron density, namely a discriminant of the stellar mass and the main neutron source at the -process site (Lambert et al. 1995; Abia et al. 2001; García-Hernández et al. 2006).
Observationally, a low [Rb/Zr] ratio ( 0) is found in low-mass AGB stars (Plez et al. 1993; Lambert et al. 1995; Abia et al. 2001) while higher mass AGB stars display [Rb/Zr] 0 (García-Hernández et al. 2006, 2007, 2009). García-Hernández et al. (2006, 2009, hereafter Paper I and Paper II, respectively) derived the Rb and Zr abundances in several Galactic and Magellanic Cloud intermediate-mass AGB stars among a sample of OH/IR stars. The Rb abundances and [Rb/Zr] ratios found in these objects represent a challenge for theoretical AGB nucleosynthesis models, which do not predict the extreme Rb overabundances ([Rb/Fe] 2 dex) and extraordinarily high [Rb/Zr] ratios observed (van Raai et al. 2012; Karakas et al. 2012). However, the Rb abundance was derived from the resonant Rb I absorption line at 7800 Å, using hydrostatic model atmospheres. The Rb I line is probably affected by contamination from one or more circumstellar (CS) components, as has already been suggested by the detection of blue-shifted CS Rb I absorption lines in several of these extreme O-rich AGB stars (see Paper I, II).
In the present Letter, we explore for the first time the CS effects on the Rb and Zr abundances derived in extreme O-rich AGB stars. To this end, we use more realistic model atmospheres that include a gaseous CS envelope. The much lower Rb abundances (and [Rb/Zr] ratios) derived here significantly alleviate the actual mismatch between the AGB nucleosynthesis predictions and the optical observations of intermediate-mass (4–8 M☉) Rb-rich AGB stars.
2 The sample stars
We selected a representative sample of five massive Rb-rich AGB stars from Papers I and II: four Galactic stars and one LMC star, covering several OH expansion velocities, variability periods, and metallicities The relevant information for the sample stars is shown in Table 2. All stars belong to the OH/IR class, with OH expansion velocities and variability periods available in the literature. We chose those stars with high signal-to-noise (S/N 30-50) optical spectra for reliable Rb and Zr abundance determinations. The resolving power of the observations is R / 40,0000 to 50,000 for the Galatic stars and R60,000 for the LMC star (see Papers I and II for further observational details). The sample stars display a variety of Rb I 7800 Å line strengths and profiles. Two stars (IRAS 050986422 and IRAS 184291721) display weak non-shifted Rb I lines while the other three stars (IRAS 063006058, IRAS 190592219, and IRAS 044986842) show a blue-shifted Rb I absorption feature that is indicative of a CS envelope moving outwards in the line of sight111The observed Rb I line in IRAS 063006058 is resolved in two components (circumstellar and stellar).. As was already shown in Papers I and II, classical MARCS hydrostatic models are not able to account for the blue-shifted absorption feature. Furthermore, the Rb abundances derived in Papers I and II with these hydrostatic model atmospheres are significantly larger than AGB nucleosynthesis models predictions (see e.g. van Raai et al. 2012). The most remarkable case is the LMC star IRAS 044986842 with [Rb/M] = 5.0222In Paper II, an average metallicity of [M/H]=1.4, as estimated from a few very weak metallic lines around the Rb I line, was used in the synthesis. Here, however, we prefer to adopt the LMC average metallicity ([M/H] = 0.3) in the synthesis in order to be consistent with the original metallicity of the atmosphere model..
3 Abundance analysis using dynamical models
3.1 Turbospectrum spectral synthesis code with extended atmospheres and velocity fields
For a proper analysis of the circumstellar component around the Rb I 7800 Å line, we have modified the v12.1 of the spectral synthesis code Turbospectrum (Alvarez & Plez 1998; Plez 2012) to deal with extended atmospheres and velocity fields. The Doppler effect due to the expanding envelope of the star is implemented in Turbospectrum by the modification of the routines that compute the line intensities at the stellar surface. Concerning the radiative transfer, the source function is assumed to be the same as computed in the static case without a wind (see Gustafsson et al. 2008). The scattering term of the source function (Jλ) is not shifted to save computing time. Scattering is only included for the continuum. We carefully checked this approximation by comparing it with Monte Carlo simulations (see Sect. 3.3) because in cool CS envelopes photons are mostly scattered in resonance lines and are not thermally emitted as we assume here. In this way, the scattering term is computed as in the static case using the Feautrier method (Nordlund 1984; Gustafsson et al. 2008). The velocity field is taken into account through a shift of the absorption coefficient . The source function is built using the static Jλ and the shifted Bλ. The emerging intensity is then computed in the observer frame by a direct quadrature of the source function. This algorithm is sensitive to numerical errors (Mihalas & Kunasz 1986). Therefore, a high sampling of the optical depth and the wavelength points is used to minimise errors in the opacity interpolation.
3.2 Dynamical atmosphere models
The atmospheric parameters adopted for the individual analysis of each star are taken from Papers I and II, using solar reference abundances by Grevesse et al. (2007). Furthermore, our dynamical models are constructed from the original MARCS hydrostatic atmosphere model structure, expanding the atmosphere radius by the inclusion of a wind out to 5 stellar radii, with a radial velocity field in spherical symmetry. The stellar radius is defined as the radius corresponding to in the MARCS hydrostatic model, where r is the distance from the stellar centre and the Rosseland optical depth. The stellar wind is computed under the assumptions of mass conservation (Eq. 1) and radiative thermal equilibrium (Eq. 2), following a classical velocity law (Eq. 3),
| (1) |
| (2) |
| (3) |
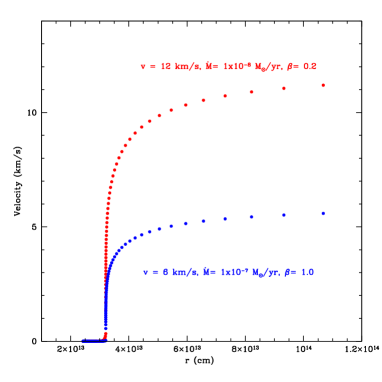
where () is the density of the envelope at radius , Ṁ is the mass-loss rate, and is the velocity of the envelope. The velocity is calculated by means of Eq. 3, where is a reference velocity for the onset of the wind and the exponent is an arbitrary free parameter. For the onset of the wind, we take and the extension of the envelope begins from the outer radius of the hydrostatic model. The envelope is extended making use of Eq. 2, layer by layer, out to . The distance corresponds to the maximum radius in our calculations, with temperature = 900 K, because Turbospectrum cannot compute for lower temperatures because of numerical reasons. For the mass-loss rate Ṁ and the exponent, we use values in the typical range of AGB stars: Ṁ 10-9–10-4 M☉ yr-1 in steps of factors of 10 and 0–1.6 in steps of 0.2. Finally, we assume as the terminal velocity (see Table 2) because the OH maser emission is found at very large distances of the central star (see e.g. Decin et al. 2010). Figure 2 shows examples of the velocity law adopted in our dynamical models.
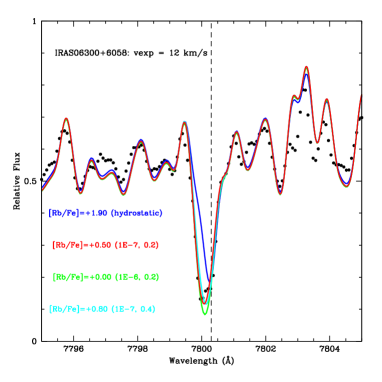
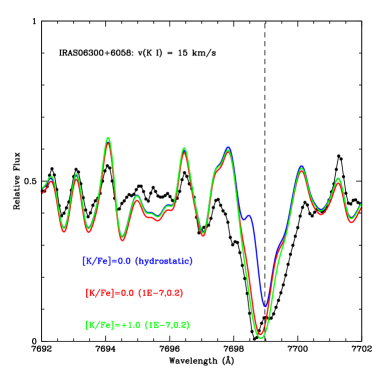
The resulting grid of synthetic spectra is compared to the observed spectra in order to find the best fit to the Rb I line profile and the adjacent pseudocontinuum. Figure 3 shows several fits for the Rb I 7800 Å and K I 7699 Å lines (with similar atomic parameters) in IRAS 063006058 to check the consistency of our models. In the left panel, we modify the (Ṁ, ) pair and the abundance of Rb until the best fit (in red) to the observations (in black) is obtained. Remarkably, the best model (Ṁ, ) = (110-7, 0.2) gives a Rb abundance of +0.5, which is much lower than the hydrostatical abundance (see Table 1). Curiously, the CS K I component is blue-shifted by 2-3 kms-1 relative to that in Rb I, suggesting a slightly higher velocity for the K I expanding gas. Thus, we test the same models for the K I line fitting in the right panel but varying the K abundance and the terminal velocity. Acceptable fits to the K I line are obtained for solar K abundances and a slightly higher terminal velocity of 15 kms-1, as suggested by the blue-shifted CS K I line. We note that increasing the K abundance may improve the fit a little bit. At present we cannot discard some K production in these stars as the consequence of proton-captures on Ar nuclei during HBB (Ventura et al. 2012).
3.3 Monte Carlo simulations
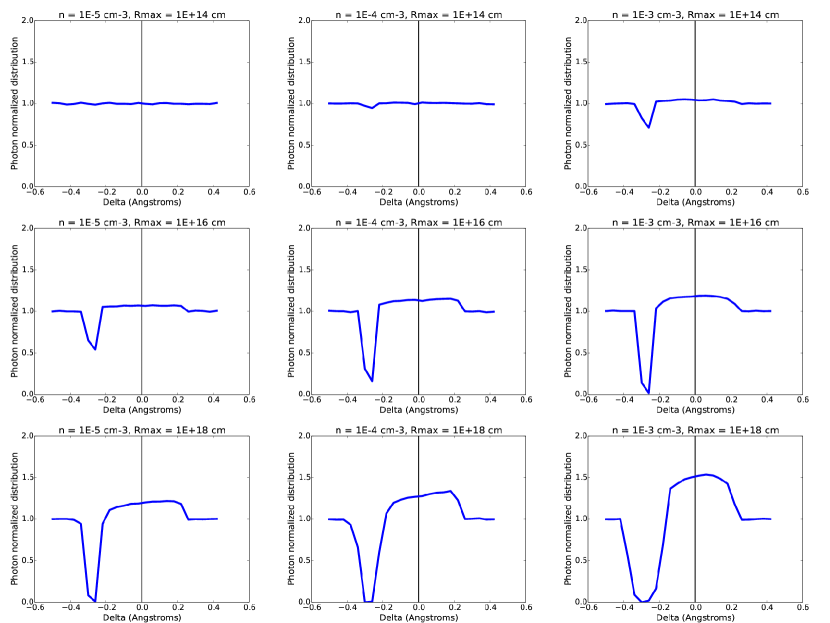
As we already commented in Sect. 3.1, to check if our neglect of line scattering in Turbospectrum does not affect the interpretation of the observed spectra, we performed complementary Monte Carlo simulations (MCS) that only take into account photon scattering for the radiative transfer. Three-dimensional MCS were carried out throwing a large number of photons (106 for accurate statistics) through the expanding envelope of a star, taking the initial wavelength, optical depth at which the photon will be scattered , and throwing direction of the incident photon as random numbers. The photon of wavelength has an absorption probability 1e. The random at which the photon will be scattered follows uniform statistics, i.e. the same number of photons are thrown for each wavelength in all directions. Thus, we study the emergent photon distribution (spectrum) obtained for the CS component around the K I 7699 Å line. The results can be extrapolated to the CS component of the Rb I 7800 Å line, taking into account that the density of K is 300 times the Rb density for solar composition. As we only want to study how the line profile changes qualitatively with a very simple code the parameters describing the envelope are assumed constant in each simulation: temperature, T; (K); density of K I atoms, n (cm-3); expansion velocity, vexp (km s-1); and maximum envelope size, Rmax (cm, 1 AU1.51010 cm), We performed 216 simulations in total, covering the following space of parameters: T = 10, 100, 1000 K; n = 1, 1, 1, 1 cm-3; vexp = 5, 10, 15 km s-1 and Rmax = 1, 1, 1, 1, 1, 1 cm. A representative subset of the results obtained for T = 1000 K - the coolest temperature that Turbospectrum is able to compute - and vexp = 10 km s-1 are shown in Fig. 5. For other envelope temperatures or expansion velocities, the resulting line profiles are very similar. In short, the most frequent line profile obtained from MCS is a blue-shifted absorption feature with a weak and broader emission component. The envelope parameters of the simulations displaying a blue-shifted absorption feature with weak emission are within the range of the dynamical atmosphere models used in Turbospectrum, which ends at Rmax = 1.6 cm. For example, for Rmax = 1.6 cm some weak emission is obtained in two MCS only, corresponding to a higher density of n = 1 cm-3. PCygni profiles, i.e. with a strong emission component, are less frequent (14%) and they are obtained only at very high densities and/or large envelope sizes. In the rest (30%) of the MCS, the spectrum is flat and no absorption and/or emission line is found in the distribution of the emergent photons for very low density (n 1 cm-3) and small envelope size (Rmax 1015 cm) values (Fig. 5).
The optical observations of Rb in massive Galactic AGB stars tell us that a non-shifted (purely photospheric) or a blue-shifted Rb I (with a CS component) line are by far the most frequent cases (see Paper I). There is only one star IRAS 123776102 with a clear PCygni Rb I profile; perhaps the star IRAS 180502213 also shows some weak emission. These two stars are among the reddest Rb-rich AGB stars, also showing very high OH expansion velocities (20 km s-1), and they are presumably the most evolved and extreme stars. Indeed, Justtanont et al. (2013) estimate envelope sizes from 9x1015 cm to 2.5x1016 cm in a few Galactic OH/IR stars (massive AGBs) from Herschel observations. Only one star in this work, WX Psc, has an optical counterpart. Although the S/N around 7800 Å is quite low, a strong Rb I absorption line is clearly detected in the WX Psc optical spectrum (Paper I). Interestingly, the estimated mass-loss rate for WX Psc (10-5 M⊙ yr-1) is lower by one order of magnitude than that for the more obscured stars. Furthermore, Betelgeuse observations (Plez & Lambert 2002) show that a mass-loss rate of 10-6 M⊙ yr-1 results in a double K I 7699 Å line with emission in the center thanks to the photon scattering but this emission is feeble in the integrated star spectrum and the circumstellar absorption dominates. Taking into account the results of the MCS and the cited observational constraints, we conclude that Turbospectrum (Sect. 3.1), provides a reasonable approximation for the stars studied here.
4 Results and discussion
The parameters of the dynamical atmosphere models providing the best fit to the observations and the derived Rb and Zr abundances ([Rb/M]dyn and [Zr/M]dyn) are shown in Table 1. The Rb abundances ([Rb/M]) as determined in Papers I and II from hydrostatic models are also shown for comparison. We note, however, that Papers I and II used solar abundances from Grevesse & Sauval (1998) while we assume here the most recent solar composition by Grevesse et al. (2007). For this reason, Table 1 also lists the re-derived Rb abundances ([Rb/M]static) using the hydrostatic models with our adopted solar abundances. Our static Rb abundances agree well, within the errors, with those previously derived in Papers I and II.
| IRAS name | (K) | g | Ṁ (M☉ yr-1) | (km s-1) | [Rb/M] | [Rb/M]staticb | [Rb/M]dynb | [Zr/M]dynb | |
|---|---|---|---|---|---|---|---|---|---|
| Galactic stars | |||||||||
| 050986422 | 3000 | 0.5 | 1.0 | 1.0 10-8 | 6 | 0.1 | 0.0 0.4 | 0.0 0.4 | 0.3 0.3 |
| 063006058 | 3000 | 0.5 | 0.2 | 1.0 10-7 | 12 | 1.6 | 1.9 0.4 | 0.5 0.7 | 0.1 0.3 |
| 184291721 | 3000 | 0.5 | 1.0 | 1.0 10-8 | 7 | 1.2 | 1.2 0.4 | 1.0 0.4 | 0.3 0.3 |
| 190592219 | 3000 | 0.5 | 0.4 | 1.0 10-7 | 13 | 2.3/2.6 | 2.4 0.4 | 0.8 0.7 | 0.3 0.3 |
| LMC star | |||||||||
| 044986842 | 3400 | 0.0 | 1.0 | 1.0 10-7 | 13 | 3.9c | 3.3 0.4 | 1.5 0.7 | 0.3 0.3 |
$a$$a$footnotetext: See Paper I and II. $b$$b$footnotetext: The uncertainties represent the formal errors due to the sensitivity of the derived abundances to slight changes in the model atmosphere parameters (Teff=100 K, [M/H]=0.3, =1 kms-1, log g=0.5, FWHM=50 mÅ, =0.2, log(Ṁ/M⊙yr-1)=1.0) for each star. $c$$c$footnotetext: We scale the Rb overabundance derived by Paper II, [Rb/M] = +5.0, to the adopted LMC metallicity [M/H] = 0.3.
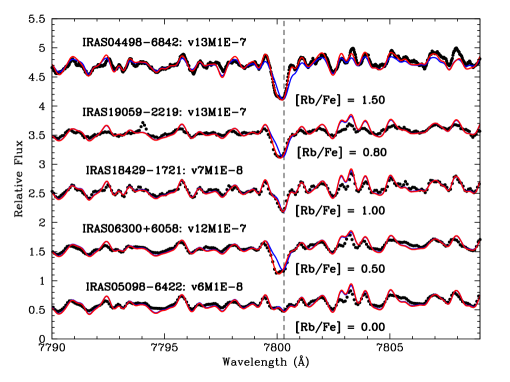
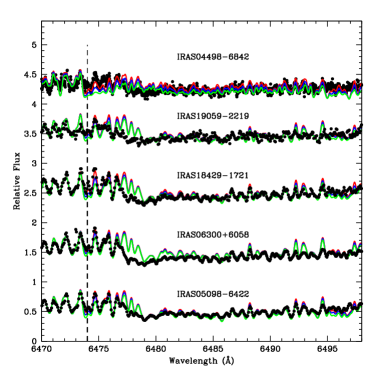
Interestingly, the new Rb abundances (in the range [Rb/M]0.01.5 dex; Table 1) derived from our dynamical models display a dramatic decrease of 1.4 dex to 1.8 dex with respect to the static case (Table 1) in the more extreme stars, namely those stars showing the highest expansion velocities and mass-loss rates such as IRAS 063006058, IRAS 190592219 and IRAS 044986842. However, for the less extreme stars with a lower expansion velocity and mass-loss rate (IRAS 050986422 and IRAS 184291721), the Rb abundances obtained from dynamical models remain close, within 0.2 dex, to those from hydrostatic models. In Fig. 1, we display the observed Rb I line profiles in our O-rich AGB sample (black dots) together with the best synthetic spectra as obtained from the new dynamical models (red lines) versus the static ones (blue lines). Our dynamical atmosphere models reproduce the observed Rb I line profiles (photospheric and circumstellar components) very well, much better than the classical hydrostatic models. The 6474 Å ZrO bandhead, because it is formed deeper in the atmosphere, is less affected than the Rb I line, and the Zr abundances (nearly-solar; see Fig. 4) derived from dynamical models are similar to those obtained with the hydrostatic models (see Papers I and II).
Remarkably, we find that relatively low mass-loss rates (10-710-8 M⊙ yr-1) give superior fits to the observed Rb I line profiles. Higher mass-loss rates of 10-6 M⊙ yr-1 give Rb I absorption lines that are too strong even for solar Rb abundances (see Fig. 3). According to Justtanont et al. (2013), the envelope size of 1x1016 cm and the mass-loss rate of 10-4 M⊙ yr-1 estimated in optically obscured OH/IR AGB stars can be taken as upper limits for massive AGB stars with optical counterparts; i.e. like our sample stars with useful spectra around the Rb I line because the heavily obscured OH/IR massive AGB stars studied by Justtanont et al. (2013) have already entered the superwind phase. Our best fits for the Rb I 7800 Å line profiles in optically bright massive AGB stars are those with mass-loss rates lower than 10-6 M⊙ yr-1. Thus, we conclude that the Rb I line profiles observed in massive AGB stars are consistent with these stars still experiencing relatively low mass-loss rates just before the superwind phase when the Rb density and the envelope size are not very high and this is supported by the MCS presented above (Sect. 3.3).
Standard nucleosynthesis models for intermediate-mass AGB stars show that the predicted Rb abundances range from [Rb/M]0.0 up to 1.44 dex, depending on the progenitor mass and metallicity (see van Raai et al. 2012); the predicted Rb production increases with increasing stellar mass and decreasing metallicity. Maximum [Rb/M] overabundances of 1.04 and 1.44 are found for a solar metallicity 6.5 M☉ star and for a LMC metallicity 6 M☉ star, respectively (van Raai et al. 2012). More recently, Karakas et al. (2012) have delayed the beginning of the superwind phase in solar metallicity nucleosynthesis models of massive AGB stars. These models produce more Rb than in the standard van Raai et al. models because the star experiences more thermal pulses before the superwind phase at the very end of the AGB. The maximum Rb production ([Rb/M]=1.34 dex) is predicted to occur for the 6 M☉ case. By considering the error bars in the spectroscopic analysis (see Table 1) and the theoretical uncertainties (see e.g. van Raai et al. 2012; Karakas et al. 2012), the Rb abundances are now in fair agreement with the massive AGB nucleosynthesis models, both standard and with delayed superwinds. The nearly-solar derived Zr abundances in IRAS 050986422, IRAS 063006058, and IRAS 190592219 (Table 1) translate into [Rb/Zr] ratios of 0.3, 0.4, and 0.5, respectively, which agree quite well with the theoretical predictions (-0.2 [Rb/Zr] 0.6). However, the [Rb/Zr] ratios in IRAS 18429-1721 (0.7) and IRAS 04498-6842 (1.2) are still higher than predicted. As already pointed out in the literature (see e.g. van Raai et al. 2012), a possible solution to this observational problem is that gaseous Zr, with a condensation temperature (1741 K) higher than that for Rb (800 K), condensates into dust grains, producing the apparent Zr underabundance that we measure from the ZrO bandheads.
In summary, the Rb abundances and [Rb/Zr] ratios derived here significantly resolve the problem of the present mismatch between the observations of massive (4–8 M☉) Rb-rich AGB stars and the theoretical predictions. In the near future, we plan to carry out a chemical analysis based on these new dynamical models for all the Rb-rich AGB stars already studied in Papers I and II. This undoubtedly will help us to constrain the actual nucleosynthesis models for the more massive AGB stars.
Acknowledgements.
O.Z., D.A.G.H. and A.M. acknowledge support provided by the Spanish Ministry of Economy and Competitiveness under grant AYA-2011-27754.References
- Abia et al. (2001) Abia, C., Busso, M., Gallino, R., et al. 2001, ApJ, 559, 1117
- Alvarez & Plez (1998) Alvarez, R. & Plez, B. 1998, A&A, 330, 1109
- Busso et al. (1999) Busso, M., Gallino, R., & Wasserburg, G. J. 1999, ARA&A, 37, 239
- Decin et al. (2010) Decin, L., Justtanont, K., De Beck, E., et al. 2010, A&A, 521, L4
- García-Hernández et al. (2006) García-Hernández, D. A., García-Lario, P., Plez, B., et al. 2006, Science, 314, 1751
- García-Hernández et al. (2007) García-Hernández, D. A., García-Lario, P., Plez, B., et al. 2007, A&A, 462, 711
- García-Hernández et al. (2009) García-Hernández, D. A., Manchado, A., Lambert, D. L., et al. 2009, ApJ, 705, L31
- Grevesse et al. (2007) Grevesse, N., Asplund, M., & Sauval, A. J. 2007, Space Sci. Rev., 130, 105
- Grevesse & Sauval (1998) Grevesse, N. & Sauval, A. J. 1998, Space Science Reviews, 85, 161
- Gustafsson et al. (2008) Gustafsson, B., Edvardsson, B., Eriksson, K., et al. 2008, A&A, 486, 951
- Justtanont et al. (2013) Justtanont, K., Teyssier, D., Barlow, M. J., et al. 2013, A&A, 556, A101
- Karakas et al. (2012) Karakas, A. I., García-Hernández, D. A., & Lugaro, M. 2012, ApJ, 751, 8
- Lambert et al. (1995) Lambert, D. L., Smith, V. V., Busso, M., Gallino, R., & Straniero, O. 1995, ApJ, 450, 302
- Mihalas & Kunasz (1986) Mihalas, D. & Kunasz, P. B. 1986, Journal of Computational Physics, 64, 1
- Nordlund (1984) Nordlund, A. 1984, Methods in Radiative Transfer, ed. W. Kalkofen, 211–233
- Plez (2012) Plez, B. 2012, Turbospectrum: Code for spectral synthesis, astrophysics Source Code Library 1205.004
- Plez & Lambert (2002) Plez, B. & Lambert, D. L. 2002, A&A, 386, 1009
- Plez et al. (1993) Plez, B., Smith, V. V., & Lambert, D. L. 1993, ApJ, 418, 812
- Sackmann & Boothroyd (1992) Sackmann, I.-J. & Boothroyd, A. I. 1992, ApJ, 392, L71
- van Raai et al. (2012) van Raai, M. A., Lugaro, M., Karakas, A. I., García-Hernández, D. A., & Yong, D. 2012, A&A, 540, A44
- Ventura et al. (2012) Ventura, P., D’Antona, F., Di Criscienzo, M., et al. 2012, ApJ, 761, L30
Appendix A Table A.1 and Figures A.1, A.2, and A.3
| IRAS name | SpType | (km s-1) | Period (days) |
| Galactic stars | |||
| 050986422 | M7e | 6.0 | 394 |
| 063006058 | M7+ | 12.3 | 440 |
| 184291721 | M9 | 6.9 | 1508 |
| 190592219 | M8 | 13.3 | 510 |
| LMC star | |||
| 044986842 | M | 13.0 | 1292 |
.
Appendix B Monte Carlo simulations; Fig. B.1