Excitonic Bose-Einstein condensation above room temperature
Abstract
We show that finite temperature variational cluster approximation (VCA) calculations on an extended Falicov-Kimball model can reproduce angle-resolved photoemission spectroscopy (ARPES) results on Ta2NiSe5 across a semiconductor-to-semiconductor structural phase transition at 325 K. We demonstrate that the characteristic temperature dependence of the flat-top valence band observed by ARPES is reproduced by the VCA calculation on the realistic model for an excitonic insulator only when the strong excitonic fluctuation is taken into account. The present calculations indicate that Ta2NiSe5 falls in the Bose-Einstein condensation regime of the excitonic insulator state.
pacs:
71.35.Lk, 71.20.-b, 67.85.Jk, 03.75.NtI Introduction
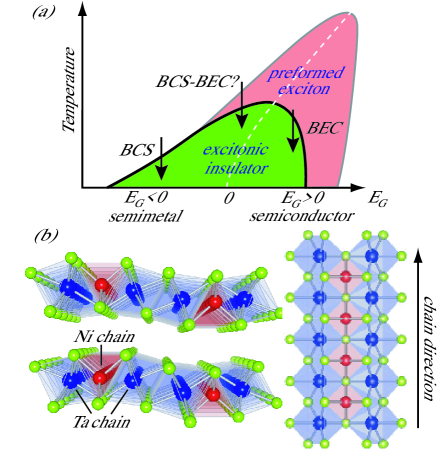
The diversity of Bose-Einstein condensation (BEC) with spin (and orbital) degrees of freedom is one of the main targets in the research of ultracold atom systems. Wang2010 ; Lin2011 ; Ho2011 On the other hand, in electronic systems with hole-like and electron-like Fermi pockets, interaction between hole and electron in the Fermi pockets tends to induce charge density wave (CDW) or spin density wave (SDW) with wave vector which spans the hole-like and electron-like Fermi pockets in the Brillouin zone. Such CDW or SDW transitions can be described as Peierls transitions due to Fermi surface nesting. An alternative way to understand CDW or SDW transitions in the electronic systems is the theory for excitonic insulators that was proposed nearly half a century ago. Mott1961 ; Jerome1967 ; Zittartz1967 ; Halperin1968 Since the electron and hole concentrations are relatively low, Coulomb interaction between holes and electrons in the Fermi pockets is weakly screened and stabilizes electron-hole bound states (excitons) with wave vector . In the Peierls picture and the excitonic insulator picture for metallic systems, the CDW or SDW transitions are basically BCS type. On the other hand, the theory of excitonic insulators can be extended to semiconductors where excitons are formed due to Coulomb interaction between valence band holes and conduction band electrons and undergo BEC. Very recently, BCS-BEC crossover of excitonic insulator has been examined in more advanced calculations using such as Mott-Wannier-type exciton model with -matrix approximation Bronold2006 and extended Falicov-Kimball model (EFKM). Ihle2008 ; Phan2010 ; Seki2011 If the normal state above the excitonic transition temperature is semimetallic namely the magnitude of the band gap , the excitonic transition is well described in the BCS framework. On the other hand, the excitonic transition is expected to be a BEC of excitons if the normal state is semiconducting or as schematically shown in Fig. 1(a). In the BEC regime with , large amount of excitons are preformed above the excitonic transition temperature and the excitonic transition corresponds to the BEC of excitons.
The BEC transition temperature of excitons can be much higher than those of liquid He or cold atoms since the electron and hole masses are much smaller than atomic masses. Therefore, the BEC regime of the excitonic insulator can provide a unique opportunity to study “high temperature” BEC. Real materials studied in relevance to excitonic insulator states are limited to several rare-earth or transition-metal calcogenides such as Tm(Se,Te) Neuenschwander1990 ; Wachter2004 and -TiSe2. Cercellier2007 The possible excitonic insulator transition in Tm(Se,Te) has been studied using various transport measurements including electrical resistivity Neuenschwander1990 and heat conductivity. Wachter2004 Although the increase of electrical resistivity at the transition and the increase of heat conductivity at the low temperature are assigned to the BEC and the superfluidity of excitons respectively, the excitonic insulator transition in Tm(Se,Te) is not established well due to the lack of quantitative theory. On the other hand, the CDW transition in semimetallic -TiSe2, which has hole-like (electron-like) Fermi pockets at the zone center (boundary), has been identified as a BCS-like excitonic insulator transition by angle-resolved photoemission spectroscopy (ARPES). Cercellier2007 The BCS-like excitonic transition in -TiSe2 is a semimetal-to-semimetal transition due to the small off-stoichiometry or the small difference between the hole and electron densities. Therefore, it is rather difficult to characterize the excitonic transition by means of transport measurement, and the band dispersion observed by ARPES is the very direct evidence of the excitonic transition. The BCS-like excitonic transition can be described by the mean-field theory and the ARPES result can be compared with the theoretical calculation. Cercellier2007 As for the BEC-like excitonic transition, it has been proposed that Ta2NiSe5 would have an excitonic insulator transition in the BEC regime based on the ARPES results below the transition temperature. Wakisaka2009 The BEC-like excitonic transition is an insulator-insulator transition, and it is rather difficult to identify the BEC of excitons using transport measurement. Similar to the BCS-like excitonic transition in -TiSe2, the band dispersion observed by ARPES can be one of the most straightforward evidence of the excitonic transition. Namely, the single particle excitation can be a finger print of the excitonic BEC just like the opening of superconducting gap in the BEC of Cooper pairs. However, the BEC regime of the excitonic insulator transition cannot be described by the mean-field theory and, therefore, a new theory beyond mean-field approximation should be developed and compared with the ARPES result in order to establish the excitonic insulator transition in the BEC regime. In this sense, the BEC-like excitonic transition is not well established yet in any real materials including Ta2NiSe5.
As illustrated in Fig. 1(b), Ta2NiSe5 has a quasi-one-dimensional (quasi-1D) structure where Ni and Ta atoms are arranged in one dimensional chains. Sunshine1985 ; DiSalvo1986 Resistivity of Ta2NiSe5 is insulating below 500 K and exhibits an anomaly around 325 K which is assigned as second-order or weak first-order structural phase transition without CDW. The resistivity exhibits insulating behaviors both above and below the transition temperature at 325 K. The magnetic susceptibility shows a gradual drop around 325 K suggesting spin singlet formation. The flattening and sharpening of the valence band top in insulating Ta2NiSe5 suggests that the phase transition at 325 K corresponds to an excitonic insulator transition in the BEC regime. In addition, Ta2NiSe5 is unique in that the excitons are formed between the electrons and holes that are located in spatially separated chains: i.e., holes in the Ni chain and electrons in the two neighboring Ta chains in the quasi-1D structural units, which has an interesting similarity with the 2D bilayer electron systems of semiconductors where the electrons and holes are also spatially separated Eisenstein . In the present work, we have developed a finite temperature variational cluster approximation (VCA) methods on EFKM for Ta2NiSe5 and have applied it to interpret temperature-dependent ARPES results of Ta2NiSe5 across the transition and to reveal the nature of the transition in this material.
II extended Falicov-Kimball model
In order to include the electron correlation effects on the single-particle excitation spectra of Ta2NiSe5 across the excitonic insulator transition, we have employed VCA calculations on EFKM which is known as a minimal lattice model to describe the excitonic insulator state. Ihle2008 ; Phan2010 ; Seki2011 The Ta 5 and Ni 3 orbital degeneracy at the conduction-band bottom and the valence-band top is removed due to the quasi-one-dimensional structure. Seki2011 Therefore, in order to describe the excitonic condensation and spectral function of valence-band top, the Coulomb interaction between the valence-band hole and the conduction-band electron is enough and, consequently, the EFKM with non-degenerate and spinless conduction and valence bands is sufficient. The Hamiltonian of the EFKM Ihle2008 ; Phan2010 ; Seki2011 is given as
| (1) | |||||
where () denotes the annihilation (creation) operator of an electron on the -orbital (corresponding to the Ta 5 conduction band) at site and is the particle number operator. represents the spatially anisotropic hopping integral between neighboring sites parallel () and perpendicular () to the one-dimensional chain direction, as it is realized in the quasi-one-dimensional material Ta2NiSe5. These are the same for the -orbital (corresponding to the Ni 3-Se valence band). is the on-site energy split between the - and -orbitals and is the inter-orbital Coulomb repulsion between electrons. Note that can be considered as inter-orbital electron-hole attraction and thus can drive the excitonic insulator state in this model at low temperature. The effect of the electron-lattice interaction has been examined in Ref. Kaneko2013 and it has been found that the electron-lattice interaction plays a secondary role and helps the excitonic transition driven by the electron-hole interaction. Kaneko2013 The chemical potential is determined so as to maintain the average particle density at half filling. The order parameter is given by
| (2) |
We use a parameter set of eV, eV, eV, and eV so as to reproduce the single-particle excitation spectrum observed in ARPES for Ta2NiSe5 and the transition temperature at the same time. The dependence on the cluster size of the calculated results was checked by changing the cluster size such as the one-dimensional 4-, 5-, 6-site (8-, 10-, and 12-orbital) clusters, where each site contains a pair of the - and -orbitals, and no significant cluster-size dependence was found. Here, it should be noted that this parameter set corresponds to the semimetallic state in the non-interacting () limit while it can describe the semiconducting state due to the Hartree shift by . Phan2010
III Methods
III.1 Variational cluster approximation
The VCA Potthoff2003 with its finite temperature algorithm was employed to calculate the temperature dependence of the excitonic order parameter and the single-particle excitation spectra. Here, let us describe the formulation of the variational cluster approximation (VCA) at finite temperature used in this article.
First we briefly review the rigorous variational principle for the thermodynamic potential functional derived by Luttinger and Ward Luttinger1960 and revisited by Potthoff. Potthoff2003 It has been shown by Potthoff Potthoff2003 that the thermodynamic potential functional as a functional of the self-energy can be written as
| (3) |
where is the Legendre transform of the Luttinger-Ward functional , Luttinger1960 is the non-interacting Green’s function, and the self-energy is considered as a trial function for the variational calculation described below. represents the sum over fermionic Matsubara frequencies , where is the temperature and is an integer, and trace over the single-particle basis. The stationarity condition
| (4) |
gives the Dyson equation and the functional at the stationary point gives the thermodynamic potential of the system. Potthoff2003 ; Luttinger1960
The self-energy functional theory (SFT) Potthoff2003 provides a way to compute by using the fact that the functional form of depends only on the interaction terms of the Hamiltonian. In SFT, the original lattice is divided into disconnected finite-size clusters and the reference system is introduced as their collection. The clusters form a superlattice and have the same interaction term as the original system because the interaction term of the Hamiltonian of the extended Falicov-Kimball model [EFKM, Eq. (1)] is local in real space. Therefore the functional form of the reference system is the same for that of the original system. The exact thermodynamic potential of the reference system is given by , where and are the non-interacting Green’s function and the exact self-energy of the reference system, respectively. Then, by restricting the self-energy to , we can eliminate the functional and obtain
| (5) |
where is the unit matrix, represents the difference of the one-body terms between the original and reference systems, and is the exact Green’s function of the reference system. The size of these matrices are , where is the number of sites within a disconnected finite-size cluster.
The Hamiltonian of the reference system is defined as
| (6) | |||||
| (7) |
where is the Hamiltonian of the EFKM defined in Eq. (1), and is a Weiss field for excitonic condensation which is treated as a variational parameter. In other words, the self-energy is varied through and thus the varitational principle Eq.(4) is practically given by . Note that the solution with corresponds to the spontaneous EI state. Then we solve the eigenvalue problem for all excited states of a finite-size cluster and calculate the trial single-particle Green’s function. The Green’s function matrix in Eq. (5) is defined as
| (10) |
with the matrix elements of
| (11) |
where is an eigenstate of and is the corresponding eigenvalue.
III.2 Cluster perturbation theory
The single-particle excitation spectra are calculated by the cluster perturbation theory (CPT). Senechal2000 In the CPT, the single-particle Green’s function is given as
| (12) |
where () denotes the orbital index, is the position of the -th site within a cluster, and
| (13) |
is the CPT Green’s function Senechal2000 . Note that the wave vector can take arbitrary values in the Brillouin zone. The CPT is exact both in the non-interacting and atomic limits, and is expected to work well in strongly interacting regime since it is derived originally from the strong-coupling expansion for the single-particle Green’s function. In the weak- to intermediate-coupling regime, the CPT approximation is generally improved with increasing the cluster size. Senechal2000 Thus larger clusters are in principle required to obtain more accurate results. We have checked calculations of single-particle excitation spectra as well as the excitonic order parameters for one-dimensional clusters of the size and (8-,10-, and 12-orbital), where each site contains a pair of the - and -orbitals, and have found no significant cluster-size dependence. In the main text, calculated results for the (10-orbital) cluster are shown, thus the effects of statical and dynamical electron correlation within the cluster size are taken into account.
III.3 Angle-resolved photoemission spectroscopy
The ARPES data compared to the calculated results were taken at beamline 9A, Hiroshima Synchrotron Radiation Center (HSRC) using a Scienta R4000 analyzer with an angular resolution of and energy resolution meV using circularly polarized light of photon energy 23 eV. The ARPES data with higher quality than those reported in ref. 15 Wakisaka2009 cover the temperature range from 40 K to 360 K including the transition temperature 325 K. The ARPES data partially reported in ref. 20 Wakisaka2012 were reanalyzed considering the calculated results and are presented. ARPES spectra are obtained as where and are electron energy and wave vector. In the second derivative plot, is smoothed and is plotted as a function of electron energy and wave vector.
IV Results and discussion
IV.1 Transport properties
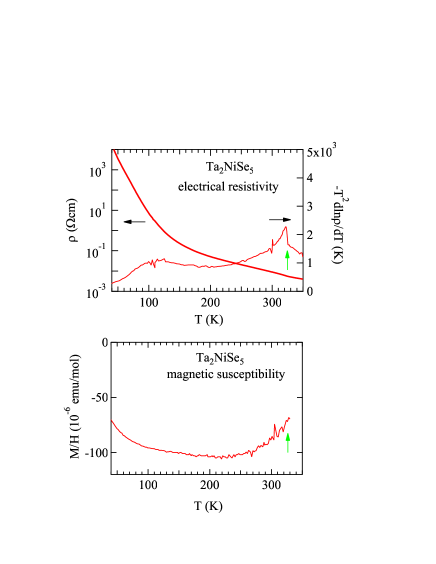
Figure 2 shows the electrical resistivity and as a function of temperature as well as the magnetic susceptibility of Ta2NiSe5. The electrical resistivity and of Ta2NiSe5 exhibit an anomaly at 325 K which corresponds to the excitonic insulator transition. The resistivity exhibits insulating behaviors both above and below the transition. If temperature dependence of resistivity is given by a simple activation type function with band gap of , and provides magnitude of . is estimated to be 1000 K which is consistent with the magnitude of the gap observed by ARPES. The magnetic susceptibility shows a gradual drop around 325 K which can be assigned to the gradual increase of the band gap due to the excitonic coupling between the valence band hole and the conduction band electron.
IV.2 Temperature dependence of ARPES spectra
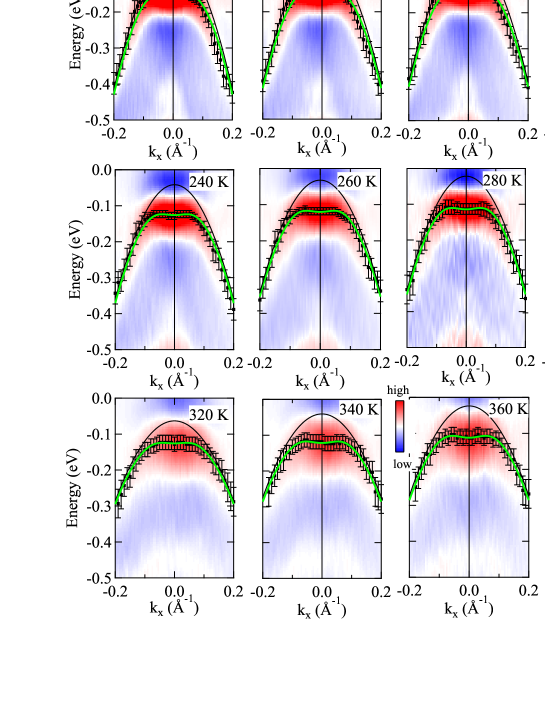
Figure 3 shows temperature dependence of ARPES spectra around the point. In order to capture the temperature evolution of the band dispersions, the valence-band-peak positions evaluated from the energy distribution curves (which are indicated by the dots with the error bars in Fig. 3) were fitted to the model function for the excitonic insulator band dispersion (shown by the thick solid curves in Fig. 3). The model function for the excitonic insulator band dispersion is obtained as below.
| (14) | ||||
| (15) | ||||
| (16) |
Here, and are the bare valence and conduction bands derived by a tight-binding model free from excitonic interaction. In the tight-binding model, the Ni-Se and Ta chains are considered to form one-dimensional band dispersion along the chain direction only through their nearest neighbor transfer integrals and without inter-chain hybridization. Assuming linear temperature dependence of the chemical potential, the model function is fitted to the valence-band-peak positions to optimize and the excitonic insulator order parameter as adjustable parameters. The fitting results are shown by the thick solid curves in Fig. 3, indicating that the fits are reasonably good to extract as a function of temperature. The bare valence-band dispersion without the excitonic coupling is indicated by the thin solid curves in Fig. 3.
IV.3 Comparison between VCA calculations and ARPES results
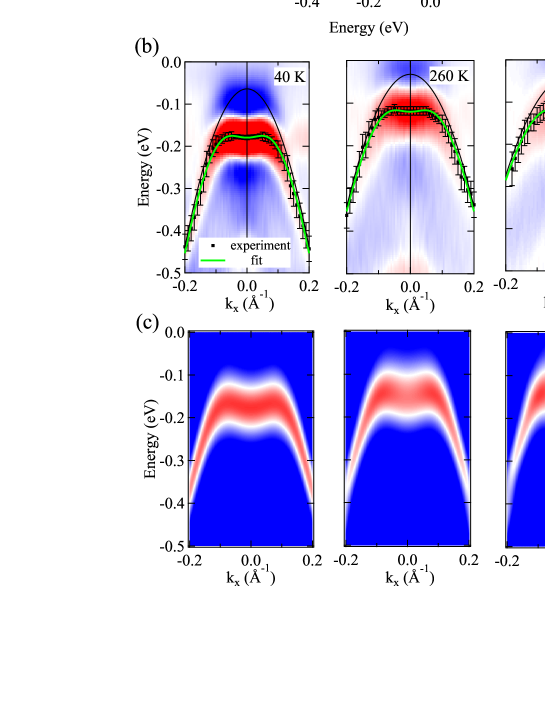
Overall valence-band dispersions observed by ARPES are consistent with the tight-binding or LDA band structure calculations Canadell1987 ; Kaneko2013 . However, there is a prominent discrepancy near the top of the valence band located at the point where characteristically flat band dispersion is observed as shown in Fig. 4(a). This flat band dispersion reminds the experimental ARPES result of -TiSe2 which is one of the candidate materials for showing excitonic insulator transition. Cercellier2007 ; Monney2009 ; Monney2010 The experimentally observed bands of -TiSe2 reported in the ARPES measurement Cercellier2007 are well reproduced by BCS-like theoretical calculation assuming the excitonic insulator transition to be the origin of its CDW transition. Monney2009 ; Monney2010 Paying attention to this similarity with -TiSe2, the ground state of Ta2NiSe5 can be viewed as an excitonic insulator state, in which Ni -Se valence band and Ta conduction band hybridize each other due to electron-hole Coulomb interaction. Wakisaka2009 In order to discuss the nature of the transition to the excitonic insulator state, we now analyze the temperature-dependent ARPES results across the transition Wakisaka2012 on the basis of finite temperature VCA calculations on EFKM.
Figure 4(b) shows temperature dependence in the second derivative plots of the ARPES energy distribution curves along the Ta and Ni chain directions. The second derivative plots at 40 K, 260 K, and 340 K are compared with the single-particle spectral function obtained by the VCA calculations on EFKM for 40 K, 270 K, and 340 K which are displayed in Fig. 4(c). The flat-top valence band at 40 K is well reproduced by the calculation on the EFKM with the appropriate parameter set as well as the previous mean-field calculation on the multi-band Hubbard model. Kaneko2013 Experimentally, as the temperature increases, the area of the flat band region in the momentum space decreases and the band top becomes closer to the Fermi level (). The band dispersion deviates from the parabolic behavior and the flattening of the band top still remains even at 340 K which is above the transition temperature. This situation is well explained by the present VCA calculation including the correlation effect beyond the mean-field or BCS limit. Here, it should be noted that the flat band dispersion at 40 K exhibits a dip at the point which is explained by the VCA calculation on the q-1D EFKM.
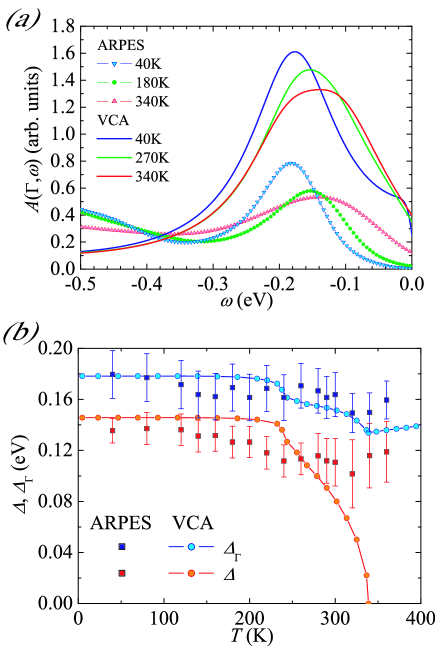
By fitting the band positions to the band dispersion renormalized in a mean-field treatment assuming the excitonic insulator order parameter as indicated in Fig. 4, one can decompose the temperature dependence of the band top energy into the temperature dependence of (due to the electron-hole interaction) and the temperature dependence of the bare valence band. The energy distribution curves (EDCs) of the point at 40 K, 260 K, and 340 K (from which the temperature dependence of the bare valence band is subtracted) are compared with the calculated spectra for 40 K, 270 K, and 340 K in Fig. 5(a). As the temperature increases, the EDC peak position is shifted towards lower binding energy and the EDC peak width of the flat band becomes broader. The substantial spectral broadening is reminiscent of the breaking of the quasi-particle peak structure, namely, the breaking of the BEC. The broadening is similar to that observed in the pseudogap region of the high cuprates although the cuprate case is more complicated with the pseudogap assigned to a possible competing order instead of the fluctuation of Cooper pairs. Kondo2013 Figure 5(b) shows the temperature dependence of the order parameter and (the energy position of the spectral peak relative to at the point) obtained from the calculation. Firstly, the value of is approximately 10 indicating that the present transition falls in the strong coupling regime. Secondly, remains finite even above the phase transition temperature as observed in the experiment showing that due to the Hartree shift by . Thirdly, the band flattening remains even above the transition temperature indicating the excitonic fluctuation. Interestingly, the strong coupling nature and the strong fluctuation above the transition in Ta2NiSe5 are very similar to the recent ARPES observation on the strong coupling superconductivity with a pseudo-gap behavior in FeSexTe1-x. Lubashevsky2012 The exciton fluctuation above the phase transition temperature is even indicated in a semimetal -TiSe2 system which is thought to fall in the BCS regime of the phase diagram. Monney2012a ; Monney2012b The present VCA calculation with fluctuation effect shows that the preformed exciton region in the conventional phase diagram [Fig. 1(a)] corresponds to the pseudo-gap phase with strong excitonic fluctuation. In addition, the transition-metal or rare-earth orbitals with spin and orbital degrees freedom under strong spin-orbit interaction can provide a variety of spin-orbit coupled condensates derived from their band gap structures and spin-orbital dependent Coulomb interactions. Therefore, the excitonic insulators including Ta2NiSe5 will provide a new playground to explore physics of BCS-BEC crossover in various bosonic systems with spin and orbital degrees freedom which have been attracting great interest due to the new discoveries in the ultracold atom systems. Wang2010 ; Lin2011 ; Ho2011
V Conclusion
In summary, the transition to the excitonic insulator state in Ta2NiSe5 has been identified as a BEC of excitons based on the comparison between the finite temperature VCA calculations and the ARPES results. A flat dispersion around the top of the valence band was observed and assigned as the effect of excitonic coupling between the valence and conduction bands. As the system exceeds the transition temperature, the flat feature of the valence band weakens though the exciton fluctuations remain finite which is due to the strong fluctuation effect expected in the BEC character of the excitonic insulator transition from the semiconductor phase.
Acknowledgements
The authors would like to thank E. Hanamura, S. Koshihara, and C. Monney for valuable discussions. K. Seki, Y. Wakisaka, T. Kaneko, and T. Toriyama acknowledge support from the JSPS Research Fellowship for Young Scientists. This research is supported by the Grant-in-Aid for Scientific Research from the Japan Society for the Promotion of Science.
References
- (1) C. Wang, C. Gao, C.-M. Jian, and H. Zhai, Phys. Rev. Lett. 105, 160403 (2010).
- (2) Y.-J. Lin, K. Jimenez-Garcia, and I. B. Spielman, Nature 471, 83 (2011).
- (3) T.-L. Ho and S. Zhang, Phys. Rev. Lett. 107, 150403 (2011).
- (4) N. F. Mott, Philos. Mag. 6, 287 (1961).
- (5) D. Jérome, T. M. Rice, and W. Kohn, Phys. Rev. 158, 462 (1967).
- (6) J. Zittartz, Phys. Rev. 162, 752 (1967).
- (7) B. I. Halperin and T. M. Rice, Rev. Mod. Phys. 40, 755 (1968).
- (8) F. X. Bronold and H. Fehske, Phys. Rev. B 74, 165107 (2006).
- (9) D. Ihle, M. Pfafferott, E. Burovski, F. X. Bronold, and H. Fehske, Phys. Rev. B 78, 193103 (2008).
- (10) V.-N. Phan, K. W. Becker, and H. Fehske, Phys. Rev. B 81, 205117 (2010).
- (11) K. Seki, R. Eder, and Y. Ohta, Phys. Rev. B 84, 245106 (2011).
- (12) J. Neuenschwander and P. Wachter, Phys. Rev. B 41, 12693 (1990).
- (13) P. Wachter, B. Bucher, and J. Malar, Phys. Rev. B 69, 094502 (2004).
- (14) H. Cercellier, C. Monney, F. Clerc, C. Battaglia, L. Despont, M. G. Garnier, H. Beck, P. Aebi, L. Patthey, H. Berger, and L. Forró, Phys. Rev. Lett. 99, 146403 (2007).
- (15) Y. Wakisaka, T. Sudayama, K. Takubo, T. Mizokawa, M. Arita, H. Namatame, M. Taniguchi, N. Katayama, M. Nohara, and H. Takagi, Phys. Rev. Lett. 103, 026402 (2009).
- (16) S. A. Sunshine and J. A. Ibers, Inorg. Chem. 24, 3611 (1985).
- (17) F. J. DiSalvo, C. H. Chen, R. M. Fleming, J. V. Waszczak, R. G. Dunn, S. A. Sunshine, and J. A. Ibers, J. Less-Common Metals 116, 51 (1986).
- (18) J. P. Eisenstein and A. H. MacDonald, Nature 432, 691 (2004).
- (19) M. Potthoff, Eur. Phys. J. B 32, 429 (2003); Eur. Phys. J. B 36, 335 (2003).
- (20) J. M. Luttinger and J. C. Ward, Phys. Rev. 118, 1417 (1960).
- (21) D. Sénéchal, D. Perez, M. Pioro-Ladriere, Phys. Rev. Lett. 84, 522 (2000).
- (22) Y. Wakisaka, T. Sudayama, K. Takubo, T. Mizokawa, N. L. Saini, M. Arita, H. Namatame, M. Taniguchi, N. Katayama, M. Nohara, and H. Takagi, J. Supercond. Nov. Magn. 25, 1231 (2012).
- (23) E. Canadell and M.-H. Whangbo, Inorg. Chem. 26, 3974 (1987).
- (24) T. Kaneko, T. Toriyama, T. Konishi, and Y. Ohta, Phys. Rev. B 87, 035121 (2013); Phys. Rev. B 87, 199902(E) (2013).
- (25) C. Monney, H. Cercellier, F. Clerc, C. Battaglia, E. F. Schwier, C. Didiot, M. G. Garnier, H. Beck, P. Aebi, H. Berger, L. Forro, and L. Patthey, Phys. Rev. B 79, 045116 (2009).
- (26) C. Monney, E. F. Schwier, M. G. Garnier, N. Mariotti, C. Didiot, H. Beck, P. Aebi, H. Cercellier, J. Marcus, C. Battaglia, H. Berger, and A. N. Titov, Phys. Rev. B 81, 155104 (2010).
- (27) T. Kondo, A. D. Palczewski, Y. Hamaya, T. Takeuchi, J. S. Wen, Z. J. Xu, G. Gu, and A. Kaminski, Phys. Rev. Lett. 111, 157003 (2013).
- (28) Y. Lubashevsky, E. Lahoud, K. Chashka, D. Podolsky, and A. Kanigel, Nature Physics 8, 309 (2012).
- (29) C. Monney, G. Monney, P. Aebi, and H. Beck, Phys. Rev. B 85, 235150 (2012).
- (30) C. Monney, G. Monney, P. Aebi, and H. Beck, New J. Phys, 14, 075026 (2012).
Figure captions:
Figure 1:
(Color online)
(a) Electronic phase diagram of excitonic insulator
as a function of temperature and band gap .
The white dashed curve indicates the boundary between
semimetal and semiconductor regions, which roughly
corresponds to the BCS-BEC crossover. In the BEC region,
preformed excitons are formed even above the excitonic
insulator transition temperature.
(b) Sketch of quasi-1D crystal structure of Ta2NiSe5.
The excitons are formed between the electrons at the Ta chains
and the holes at the Ni chains.
Figure 2:
(Color online)
Electrical resistivity and magnetic susceptibility of Ta2NiSe5
as functions of temperature. The arrows indicate the transition temperature.
Figure 3:
(Color online)
Second derivative plots of the ARPES spectra along the chain direction
of Ta2NiSe5 taken at various temperatures.
The valence-band-peak positions evaluated from the energy distribution curves
are indicated by the dots with the error bars. The fit to the excitonic insulator
band dispersion is shown by the thick solid curve.
The thin solid curve indicates the bare valence-band dispersion without
the excitonic coupling.
Figure 4:
(Color online)
(a) Second derivative plots of the ARPES spectra along the -X direction taken at 40 K.
The specific flat band is formed at the top of valence band.
(b) Band dispersions obtained from the ARPES spectra at 40 K, 260 K, and 340 K.
The dots with error bars indicate the band positions determined from the ARPES data.
The fit to the excitonic insulator band dispersion is shown by the thick solid curve.
The thin solid curve indicates the bare valence-band dispersion without the excitonic coupling.
(c) Single-particle excitation spectra for 40 K, 270 K, and 340 K obtained
by the VCA calculation.
Figure 5:
(Color online)
(a) ARPES spectra at point taken at 40 K, 260 K, and 340 K,
and single-particle excitation spectra at point calculated
for 40 K, 270 K, and 340 K and multiplied by the Fermi-Dirac distribution function.
(b) Temperature dependencies of the peak position of the
flat valence band at () and the order
parameter , which are extracted from the ARPES results
and are obtained from the VCA calculations.