Free electron properties of metals under ultrafast laser-induced electron-phonon nonequilibrium: a first-principles study
Abstract
The electronic behavior of various solid metals (Al, Ni, Cu, Au, Ti and W) under ultrashort laser irradiation is investigated by means of density functional theory. Successive stages of extreme nonequilibrium on picosecond timescale impact the excited material properties in terms of optical coupling and transport characteristics. As these are generally modelled based on the free electron classical theory, the free electron number is a key parameter. However, this parameter remains unclearly defined and dependencies on the electronic temperature are not considered. Here, from first-principles calculations, density of states are obtained with respect to electronic temperatures varying from K to K within a cold lattice. Based on the concept of localized or delocalized electronic states, temperature dependent free electron numbers are evaluated for a series of metals covering a large range of electronic configurations. With the increase of the electronic temperature we observe strong adjustments of the electronic structures of transition metals. These are related to variations of electronic occupation in localized -bands, via change in electronic screening and electron-ion effective potential. The electronic temperature dependence of nonequilibrium density of states has consequences on electronic chemical potentials, free electron numbers, electronic heat capacities and electronic pressures. Thus electronic thermodynamic properties are computed and discussed, serving as a base to derive energetic and transport properties allowing the description of excitation and relaxation phenomena caused by rapid laser action.
pacs:
81.40.-z,79.20.Ds,72.15.LhI Introduction
The dynamics of laser-excited materials is an area of intense research as diagnostics of laser-matter experiments can be discussed by back-tracking the transient properties of the irradiated material. Particularly, the primary phenomena of transient electronic excitation and energy transport are of utmost importance. Irradiating a metal by a short laser pulse ( fs) can lead to a significant rise of the electronic temperature with respect to the ionic lattice as the energy of the laser pulse can be deposited before the material system starts dissipating energy by thermal or mechanical ways. The electronic excitation can affect both electronic and structural properties of the solid, impacting optical coupling, transport and phase transitions. The confinement of the absorbed energy at solid density pushes the matter into an extreme nonequilibrium state and new thermodynamic regimes are triggered. The interplay between the ultrafast excitation and the material response still requires a comprehensive theoretical description for highly excited solid materials including in particular the excitation-dependent band structure evolution as this influence the response to laser action. [1] Recent advances in studying processes induced by short laser pulses have revealed the determinant role of primary excitation events. Their accurate comprehension is necessary to correctly describe ultrafast structural dynamics, [2, 3] phase transitions, [4, 5] nanostructure formation, [6] ablation dynamics, [7, 8] or strong shock propagation. [9] In such nonequilibrium conditions, conduction electrons participating to energy exchange are expected to evolve in time, depending on the excitation degree. [10] They largely determine the material transient properties and transformation paths. In this context, they are a crucial parameter required to describe complex ultrafast phenomena involving relaxation of excited states. Particularly, pure electronic effects (population and band distribution) determining transient coefficients before structural transitions set in are of interest and we will follow excitation influence in the form of nonequilibrium electronic temperature.
At the very beginning of the irradiation process, excited electrons are unhomogeneously distributed within the electronic band structure of the materials. By collisions and energy transfer, they fastly reach a Fermi-Dirac distribution. The electronic subsystem is thermalized and the concept of electronic temperature () can be applied. Mueller et al. have recently shown that the electron subsystem thermalizes within a characteristic time in the range of tens of femtoseconds for larger than K. [11] Then, a first relaxation channel is the energy transfer between electronic and vibrational excitations. This is commonly described by a two temperature model (TTM) [12, 13] based on the assumption that the occupation of electronic and phonons states can be separately described by two effective temperatures, the electronic and the ionic temperature . In standard approach, energy transfer between electrons and ions can be modeled by the product of the electron-phonon coupling parameter and the temperature difference. This relaxation occurs in the picosecond timescale. [14] Thus, there exists a period of time where the ionic temperature remains low while electrons fastly reach a thermalized state of high electronic temperature. In this case, strong alteration of electronic properties preceeds structural transformation, with consequences on the efficiency of energy deposition. Such nonequilibrium states can be modelled in the framework of first-principles calculations, by interrogating the electronic influence at various degrees of electronic heating, while disregarding in a first approximation, the ionic temperature effects.
Experimentally, excited solids in steady-state cannot be created and thermal nonequilibrium data in these particular conditions are difficult to be determined from integrated or time-resolved measurements. [15, 16, 17] In such complex conditions, simple estimations and models are used to access the behavior of intrinsic material properties. A strong need then exists to perform multiscale calculations both in space and in time, capable of replicating the observed behaviors and to predict material response under excitation. Most of the macroscopic models and behavior laws are based on the picture of free electrons commonly used to describe metals or even dielectric dynamics under laser irradiation. [1, 3, 13, 18] Ab initio microscopic calculations can supply macroscopic approaches (optical, thermal, hydrodynamical or mechanical) with implicit dependencies on material properties and electronic band structures. Since the density of free electrons is not an observable variable in a quantum mechanical perspective, its dynamics in thermally excited solids remains poorly explored whereas the transport parameters and measurable dynamics are commonly depicted and fitted by laws depending on .
It has already been shown in previous works that electronic structures determine the thermodynamic functions and scattering rates of the heated electron subsystem. [19] This work analyses and extends the largely used electronic thermodynamic properties derived from the free electron gas model by interrogating the evolution of the free carriers. This model, based on the assumption of free and non-interacting electrons, works satisfactory in case of simple metals (Na, Mg, Al…). However it cannot encompass the complexity observed for transition metals, where -electrons with a higher degree of localization than -electrons can still participate to optical processes. This indicates a potentially important role of electron confinement within more or less diffuse orbitals. Moreover, it has already been shown that the increase of the electronic temperature strongly affects the shape of the -band. [5] Under such strong modifications of the electronic systems, it is important to extract from calculations an effective free electron number per atom classically defining . This effective parameter can have importance whenever experimental optical or thermal properties are derived and used to extract other parameters such as temperature, stress or conductivity from a nonequilibrium solid. The objective of the investigations presented here is to quantify the effects of thermal activation energy around Fermi energy on consistently with a rigorously calculated band-structure accounting for Fermi smearing and -band shifting within the range of K.
We report results from a systematic study on DOS energy broadening performed on a free electron like metal (Al) and on transition metals (Ni, Cu, Au, W and Ti), some of them with noble character. Section II is devoted to the calculation and procedure details. In section III, DOS dependence on the electronic temperature is discussed. We focus on the observable energetic shift and narrowing of the -band and the implications on the chemical potential. Finally, in order to obtain the electron density relevant to light absorption, heat flux, or mechanical stress induced by electronic heating, an estimation of the number of free electron per atom, based on delocalized states considerations, is calculated at all electronic temperatures and discussed for all metals in Section IV. Concluding remarks on the effects of evolution on energetic and transport parameters, especially on electronic pressure and electronic heat capacity are made in section V.
II Calculations details
Calculations were done in the framework of the density functional theory (DFT), [20, 21] by using the Abinit package [22] which is based on a plane-waves description of the electronic wave functions. Projector augmented-waves atomic data [23, 24, 25] (PAW) are used to model nucleus and core electrons. The generalized gradient approximation (GGA) in the form parameterized by Perdew, Burke and Ernzerhof [26] or the local density approximation (LDA) functional developed by Perdew and Wang [27] are considered for the exchange and correlation functional. Semicore electronic states are included in PAW atomic data of Ti and W as they significantly improve the description of material properties. The Brillouin zone was meshed with Monkhorst-Pack method, [28] with a 30 30 30 -point grid. From the studied metals, only Ni is expected to have ferromagnetic properties, but our calculations showed that magnetic properties vanish above = K, thus, all calculations were done without using spin-polarized methods. To ensure high accuracy of calculations, lattice parameters were relaxed up to the point where stress goes beyond eV/Å, with a cutoff energy of 40 Ha.
| Elt | XC Functionals | Elec. Struc. | Chem. Struc. | lth | lexp | Rel. Err. | Bth | Bexp | Rel. Err. |
|---|---|---|---|---|---|---|---|---|---|
| Al | GGA | 33 | FCC | 4.04 | 4.05 | -0.4 | 79 | 81 | -2 |
| Ni | GGA | 34 | FCC | 3.51 | 3.52 | -0.3 | 192 | 191 | 1 |
| Cu | GGA | 34 | FCC | 3.64 | 3.61 | 0.6 | 142 | 133 | 6 |
| Au | LDA | 56 | FCC | 4.05 | 4.08 | -0.7 | 195 | 167 | 14 |
| Ti | GGA | 3343 | HCP (a,b) | 2.93 | 2.95 | -0.6 | 112 | 114 | 2 |
| HCP (c) | 4.66 | 4.69 | -0.6 | ||||||
| W | GGA | 55456 | BCC | 3.18 | 3.17 | 0.7 | 295 | 296 | -5 |
Al, Ni, Cu, Au, Ti, W cristallize in different phases depending on the environment conditions. Here, we focus on cristal structures adopted by metals at ambiant conditions, namely: face-centered cubic (FCC, space group , 225) structure for Al, Ni, Cu and Au; hexagonal close-packed (HCP, space group , 194) structure for Ti; and body-centered cubic (BCC, space group , 229) structure in the case of W. Once structures are chosen, the accuracy of PAW atomic data is tested through calculations at K conditions of lattice parameters and bulk moduli using Birch-Murnaghan equation of states. A good agreement is found between our calculated values and experimental data, that are provided in Table 1. Some differences are noticeable between computed and experimental bulk moduli, [31, 32, 33] especially when zero-point phonon effects are not taken into account. [31] This confirms the reliability of the used PAW atomic data. The theoretical lattice parameters computed at this step are then used to calculate dependent DOS.
To model laser irradiation effects, we consider timescales where the electrons are thermalized and their distribution can be described by electronic temperatures. Calculations were done with ranging from K to K while remains equal to K. A number of 40 bands per atom is used to ensure a maximum occupation below electrons of the highest energy band at K. dependent DFT calculations are performed following the generalization of the Hohenberg and Kohn theorem on many-body systems to the grand canonical ensemble as proposed by Mermin. [29] The finite electronic temperature is taken into account by considering a Fermi-Dirac distribution function applied to the Kohn-Sham eigenstates, ensuring a single thermalized state of electrons during the self-consistent field cycle. This involves a dependent electronic density and an electronic entropy part in the free energy potential with implicit and explicit dependencies. [22, 30] Equilibrium electronic density at a finite electronic temperature is determined by minimizing the free energy, the variational functional here, resulting in a dependent electronic structure.
III effect on Density of States
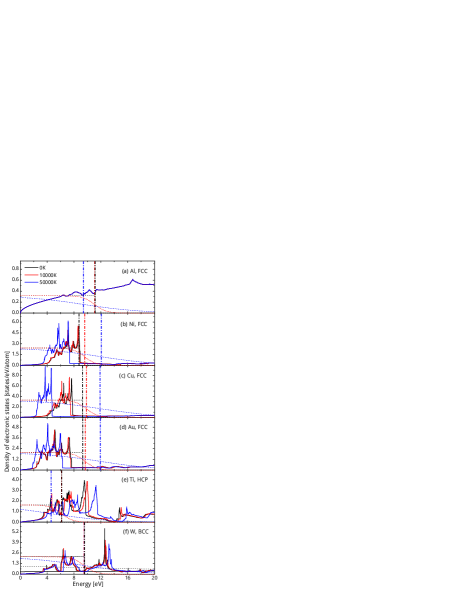
The following discussion is based on the precise determination of the electronic density of states of all the considered metals. Calculations are performed at twelve different electronic temperatures, from to K. [34] The DOS and associated Fermi-Dirac electronic distribution functions of the discussed metals are shown in Fig. 1 at the electronic temperatures of , and K. Here, for simplicity, the beginning of the valence band of the DOS was set at 0 eV for each . According to this representation, the number of valence electrons can be expressed as:
| (1) |
where is the DOS and is the Fermi-Dirac distribution ().
If we first focus the discussion on the DOS obtained at =0K, we can notice that they are similar to previous works. [35, 5, 19] For Al, the DOS adopts the shape of square root function of the energy, characteristic for a free electron like metal. With transition metals, the -band appears with a typical -block having a much higher density. This -block is filled or almost filled in case of Ni, Cu and Au, while the filling is roughly and in the case of Ti and W as showed by the location of the Fermi energy. Generally speaking, the -bands are narrow in the case of Ni, Cu and Au since almost all -states are filled, which leads to a weak and non-directional character of the -bonding. [36] At the opposite, they are much more expanded with the presence of pseudo-gaps in the case of Ti and W, exhibiting a stronger and more directional -bonding. [36]
III.1 Shift and shrinking of the -block
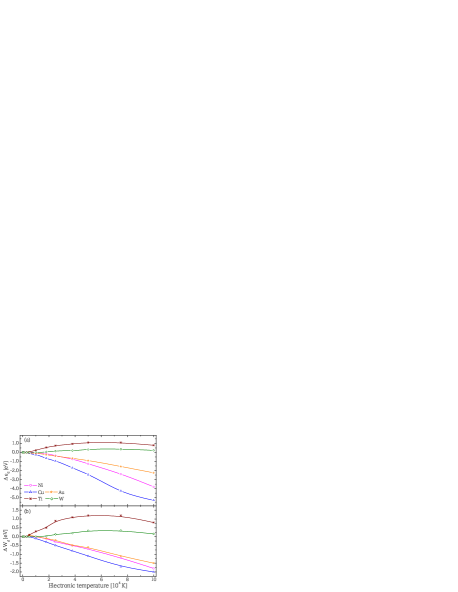
Density of states exhibit different dynamics when the electronic temperature increases. In the case of Al for example, the DOS is almost insensitive to . This constant behavior of the electronic structure was already noticed in Ref. [5]. On an other hand, transition metals exhibit more complex DOS due to the presence of -bands. Metals with -block fully or almost fully occupied by electrons (Ni, Cu and Au) exhibit a shrinking and a strong shift of the -block toward lower energies when increases. On the contrary, metals with partially filled -block (Ti and W) display an expansion and a shift toward higher energies of their -block when is increased. In order to quantify these phenomena, we show in Fig. 2 the relative change of the -block center [] as well as the relative change of the -block width [] with . For simplicity, they are deduced by considering a rectangular band model, whose sides are evaluated from the side slope of the electronic density surrounding the -block. Then, the -block center and width are estimated as and , where and superscripts correspond to the right and left sides of the rectangle.
The -block modifications observed here for Au were already reported in Ref. [5], with an explanation of the phenomenon based on changes of the electronic screening. When an electronic temperature is applied, the depopulation of 5-block leads to a decrease of the electronic screening which makes the effective electron-ion potential more attractive. [5] The consequence is a global shift of the electronic states toward lower energies. A similar effect likely occurs in the case of Ni and Cu even if the depopulation is now concerning -electrons instead of as in Au. Considering the shift toward higher energies and extension of the -block in case of Ti and W, one should expect an increase of the screening effect with the augmentation of for these two metals. To validate this assumption, the change of the number of -electrons and the changes of Hartree energies as a marker of the changes of electronic localization have been evaluated and are presented in Fig.3. We specify that the concept of electronic localization refers to a certain degree of spatial concentration of the charge density. The relevance of these observations are discussed below.
Except the case of Al, all considered metals have electronic configurations in the form of (n-1)n. Since the main quantum number is one of the dominant parameter characterizing the diffuse nature of an orbital, [37] (n-1)-orbitals are more localized and overlap less than n-ones. Consequently, the resulting -band is confined energetically with higher density of state. Electrons occupying this band are also experiencing spatial localization. Thus, one can expect that changes in the electronic screening mainly come from changes of the electronic occupation of this -band. To gather deeper insight, we computed the number of -electrons from integrations of angular-momentum projected DOS, and we plotted as a function of in Fig. 3a. As expected, decreases for Ni, Cu and Au. depopulates the -band, which leads to a decrease of the electronic screening as discussed previously. At the opposite, increases for Ti and W. This is a consequence of partially filled -block, since electronic excitation depopulates both -bands and the bottom part of the -band and populates the top part of the -band. Semicore electronic states also undergo an electronic depopulation at above K. For example, at K, the depopulation reaches 0.3 electrons for 3-semicore electronic states of Ti and 0.4 electrons for 4-semicore electronic states of W. Consequently, the total number of -electrons increases in agreement with a strengthening of the electronic screening at least up to K, where the depopulation of semicore states seems to moderate the effect, as we can see on Fig. 2 with a decrease of shifts and width changes. Finally, the behavior of Al is particular with an increase of and no effects on the density of states. This is related to the occupation of a high energy -band that does not contribute to the electronic localization.
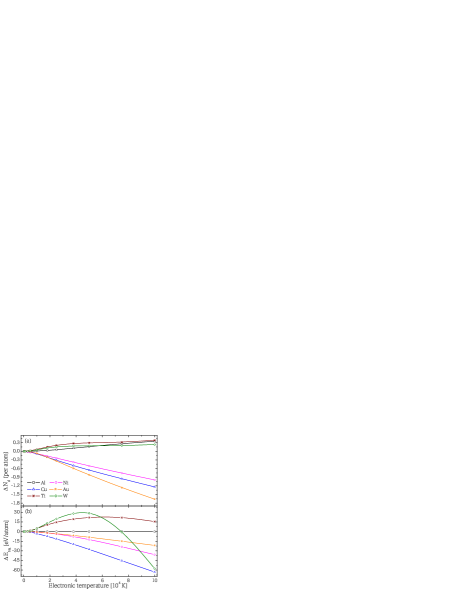
However, DOS angular-momentum projection methods suffer from some drawbacks. Firstly, they are performed on spheres centered on atoms and there is always some intersphere informations lost during the process. Consequently, some electronic states and some electrons are not accounted for. Secondly, projections on angular-momentum do not allow distinctions between 3, 4 or 5 bands. Then, the number of -electrons computed can be the summation of electrons from localized (n-1) band with n or even (n+1) delocalized bands. Thus, the variation of -electron numbers has some uncertainties, but still provides information about trends. In order to get a more precise perspective of how electronic screening is affected by , we rely on Hartree energy. The changes of Hartree energies with respect to are plotted in Fig. 3b. We recall that this energetic term is the Coulomb repulsive self-energy of the electronic density: . It corresponds to the global electron-electron interaction. In a perfectly homogeneous spatial distribution, this quantity would reach a minimum value, however, constrained by the electronic structure, electrons are not homogeneously distributed. Specifically, semicore states and (n-1)-bands strongly concentrate the charge density, which generates an electronic screening of the nucleus. Variations of the electronic occupation of these electronic states with impact Hartree energies, which can be related to a change of electronic screening. Thus, the evolution of with is an indicator for the gain or the loss of electronic localization. This will be mainly the consequence of changes due to the spatial confinement of the (n-1)-band we discussed above. The evolution of also reflects the change of electronic screening of the ions. On Fig. 3, we can notice a good correlation between and with at least up to temperatures of K. When the number of -electrons decreases there is a loss of electronic localization. This leads to a decrease of which signals a decrease of electronic screening. The opposite phenomenon occurs when the increases, with a gain of electronic localization leading to an increase of correlated to an increase of electronic screening. Finally, of Al remains roughly equal to zero, while the electronic occupation of high energy bands increases. It confirms that high energy bands, including -bands, are sufficiently delocalized to be considered as uneffective on electronic localization.
From and changes, some unexpected behaviors are also observed. Firstly, is correlated to in the case of Cu and Ni. The stronger is the decrease of , the stronger is the decrease of . However, this rule is no longer available when considering Au. This is due to the fact that -electrons belong to the 5-orbitals in the case of Au whereas they belong to 3-orbitals in the case of Cu and Ni. Associated to more diffuse orbitals, -electrons of Au are already less localized than those of Cu and Ni, and it leads to a lower loss of localization when -band is depopulated with the increase of . In other words, is lowered in the specific case of Au since its -electrons are already less localized. Secondly, is not correlated to in case of Ti and W at electronic temperature higher than K. Whereas the number of -electrons still increases, the Hartree energy decreases, with a particularly strong decrease for W. This is attributed to the electronic depopulations of semicore electronic states that occur at high as discussed above. The strong evolution of Hartree energy for W originates from the significant change of electronic screening generated by the depopulation of highly localized 4-electrons. We assume here that semicore electrons are fully thermalized with valence electrons even if semicore thermalization timescales are difficult to estimate. Being low in energies, these semicore states are not directly excited by laser irradiation and thermalization time is dependent on electron-electron collision frequency. [11, 38] At K, Fisher et al. [38] estimate about 1-10 sucessfull impact probabilities during irradiation timescale, for binding energies of semicore electronic states similar to the ones considered here. This suggests a short thermalization time but accurate description is beyond the scope of the present work.
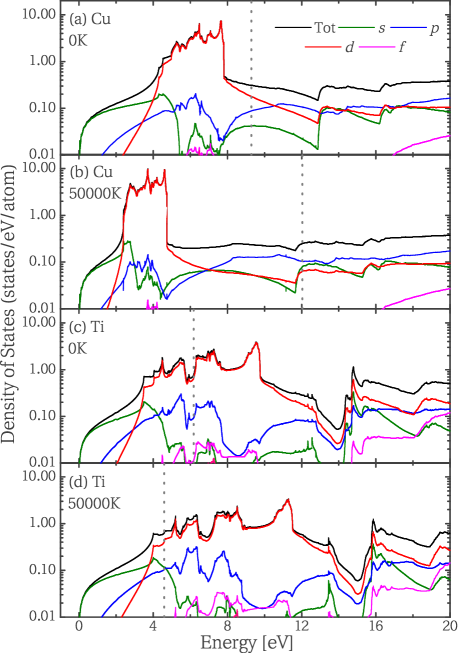
Generally speaking, we note a relatively good agreement between and on one side, and and on the other side. For Ni, Cu and Au, the decrease of leads to a loss of electronic localization that generates a decrease of . The effect can be related to the decrease of the electronic screening and thus to the increase of the global electron-ion effective potential that shifts electronics states of these metals toward lower energies. This shift applies non-homogeneously on the -block since bottom -block is less affected by depopulation and thus by changes of electronic screening than the top part, as can be seen on Fermi-Dirac distributions on Fig. 1(b-d). As a result the -block is shrinked, and and decrease. Shifts also apply to electronic states of higher energies, as shown for Cu on Fig. 4(a,b). For Ti and W, the increase of leads to an increase of . The corresponding gain in electronic localization produces a stronger electronic screening. As a result, the electron-ion effective potential is less attractive and bands are shifted toward higher energies. It also applies inhomogeneously to the -block with its bottom states less affected by changes of electronic population than its top states, as can be seen on Fermi-Dirac distributions on Fig. 1(e,f). As a consequence, the -block extends and is shifted toward higher energies, and and increase. Higher energy electronic states are also affected by this increase of electronic screening, as we can note with the shift of other bands toward higher energies for Ti on Fig. 4(c,d). This discussion synthesizes effects on DOS for a range of representative metals, with various possible impacts on electronic properties.
III.2 Electronic distributions
As discussed above, the electronic distribution is ensured by the Fermi-Dirac function characterized by the electronic chemical potential . As already showed by Lin et al., [19] the electronic chemical potential exhibits strong variations, depending on the material studied. More precisely, these variations are related to the assymmetric distribution of the density of electronic states from both sides of the Fermi energy. For this reason, the electronic chemical potential moves toward higher energies in the case of Ni, Cu and Au, while it is displaced toward lower energies in the case of Al, Ti and W. In the present calculations, the dependence of the DOS produces important shifts of the -block. Since the -block concentrates electronic states, is also strongly affected by these shifts. In Fig. 5, the relative changes of the electronic chemical potential is shown for all studied materials.
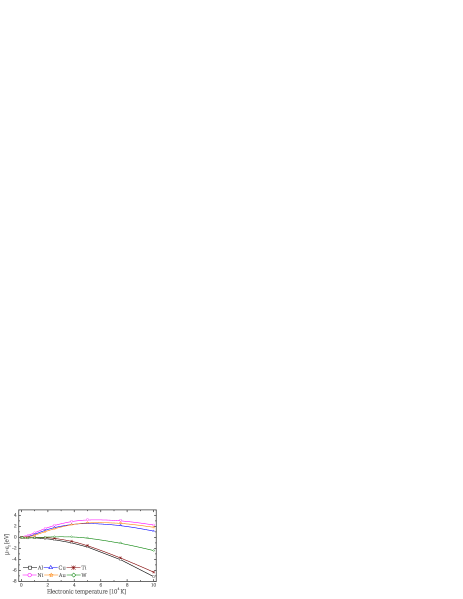
One important observation has to be made here. Previous works [19] reported evolutions of dependent properties computed from DOS performed at K. In the present case, this approach takes into consideration the relaxion of DOS with , and changes in the electronic structure are impacting the electronic chemical potential. As a general note, one can observe that trends are similar between the temperature evolution of derived from dependent DOS and originating from K DOS. The agreement is very good in the case of Al, that we can attribute to weak changes of its electronic structure with . However, in case of Ni, Cu and Au, the increase of is lowered in dependent DOS situation, a difference that is due to the shift of the -block with . Since the -block is the main electron reservoir, when it is shifted toward lower energies, the electronic chemical potential accounts for this evolution and its displacement tends to follow. In the case of Cu for example, at K, from dependent DOS is decreased by 2 eV compared to from K DOS. For W and Ti, the decrease of is also lowered in dependent DOS. This is attributed to the shift of the -block toward higher energies, which is accommodated by . This indicates the importance of considering effects on band structure while regarding the evolution of electronic populations, with direct consequences on the determination of free electron numbers.
IV Free electron numbers
The number of free electrons is a quantity difficult to define since the quality of being “free” is elusive. In metals, electrons are implicitly considered as free if they belong to orbitals having the highest main quantum number in the atomic electronic configuration (EC).[39] For example, EC of Al and Cu are respectively 33 and 34, and their corresponding number of free electrons are 3 and 1, respectively. The highest main quantum number is chosen as it characterizes the diffuse and overlapping nature of the orbitals. Hence, electrons belonging to those orbitals are assumed to be free of moving in a large space and by extension in the whole metal, with trajectories limited by collisions and with parabolic dispersion laws. However, the use of atomic electronic configurations induces a degree of incertitude when applied to condensed phases. In addition, determined from EC does not allow any change while increases. As a consequence, and motivated by the necessity of giving a certain evaluation of the free electron quantity, we computed the number of free electrons directly from the electronic structures of metals.
In order to improve the determination of , we have to distinguish electrons belonging to localized states (assumed to be non-free) from those belonging to delocalized states (considered as free). For this, it is important to determine which are the localized states in the density of states. -orbitals from electronic configuration of transition metals defined by (n-1)n are less diffuse than -orbitals due to lower main quatum number. Consequently, they overlap less and thus interact less than -orbitals. The resulting -bands produce a characteristic -block of very high density of electronic states. At the opposite, -bands are delocalized and generate -bands of low density with a square root distribution, similar to Al (see Fig. 1). The difference of density between localized -block and delocalized -bands is large and it is then easy to distinguish them in the DOS. Using a method to remove localized states from the DOS, one can compute free electron numbers according to the previous description, i.e. electrons occupying delocalized electronic states only. Accordingly, the number of free electrons is given by the integration of the DOS weighted by the Fermi-Dirac distribution:
| (2) |
with being the delocalized part of the density of states only.
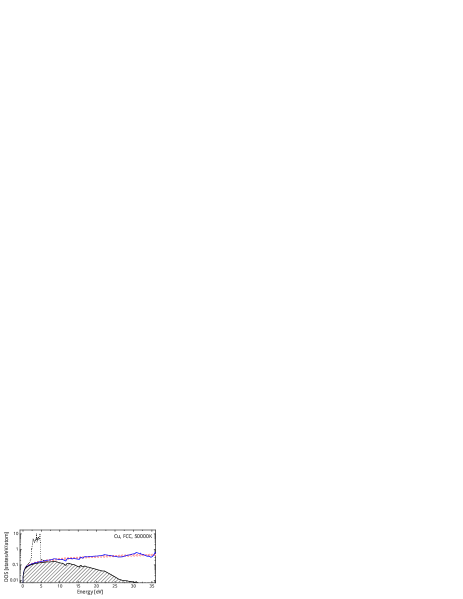
To remove localized states from the DOS, several methods can be used. One of the most simple implies to fit the density of states to a curve having a square root shape, as this will artificially remove the high density of states of the -block. [40] The square root shape is chosen since it is the distribution of the density of electronic states adopted by a free electron like metal, as observed for Al on Fig. 1a. Considering the electronic structure of -band metals, square root shape is thus a criterium for indentifying delocalized states. Here, in order to keep all DOS subtleties, this square root fit is only used to replace the -block, resulting in a DOS of delocalized states, that can be written as:
| (3) |
where is the fit of the DOS. The correction is only applied to the energy range containing the -block. Fig. 6 exemplifies the whole process in the case of the DOS of Cu, indicating the fit results at K. By proceeding that way, a small part of -electrons also contributes to the free electron number. We assume that a small part of the -band can be considered as delocalized too. The analysis of Hartree energies (Fig. 3b) already showed that some -electrons are less localized than others (case of Au 5-electrons versus case of 3-electrons of Ni and Cu). Moreover, the -band is not restricted to the very localized -block, as shown in Fig. 4. Part of it easily matches a square root distribution of electronic states, indicating non-negligible overlaps and interactions between -components, in a similar way to what is observed with -components. Finally, as previously discussed, -bonds are mainly weak and non-directional, [36] thus it would not be surprizing that, despite a strong localization character, part of -electrons have an ability to be mobile.
Once they are only made of delocalized states, the DOS can now be integrated and can be deduced. The number of free electrons per atom for all considered metals is presented in Fig. 7. It shows strong variations as increases, exept in the case of Al, where this number remains constant with free electrons per atom. This is an expected free electron behavior since excited electrons are leaving delocalized states to reach other delocalized states. For Ni, Cu and Au, the localized -block can be considered as a reservoir of non-free electrons susceptible to be depopulated with , depending on the relative location of the Fermi energy. Then, non-free electrons from the localized -block reach delocalized states and become free, which leads to an increase of with . In the case of Ti and W, the partially occupied -block plays an ambivalent role. At low the bottom part of the -block is filled of non-free electrons while the top part is empty but consists of localized states that can potentially trap excited electrons. As a consequence, remains constant or slightly decreases at low electronic temperatures. However, at temperatures above K, increases as in the case of Ni, Cu and Au, by populating delocalized states of higher energy.
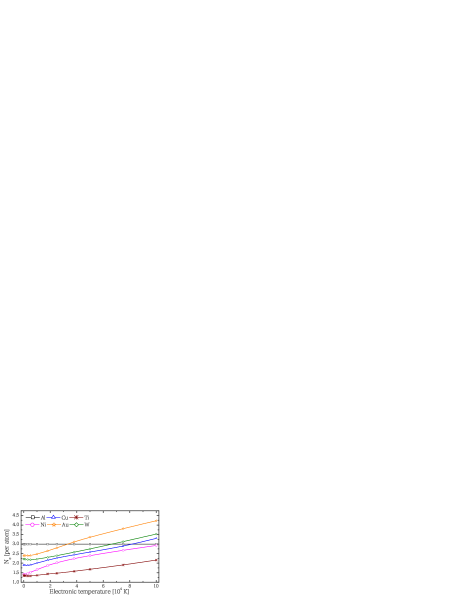
The typical values of deduced only from electronic configurations of isolated atoms are independent on the electronic temperature. They are provided in Table 2 alongside with the obtained by the present approach at 0K. As already mentioned, we obtained a good agreement in case of Al since the electronic structure is only made of delocalized states and thus remains constant and equal to the number of electrons from EC. However, differences can be large with respect to other metals, especially since electronic structure of condensed phases allows the transfer of electrons between bands. They also come from the fact that we considered the -band as partially delocalized. We observed that the free electron numbers calculated here approach values from other estimations. [41, 10] In case of Au, the present is higher than the value typically used. This is attributed to different Fermi energies, almost twice higher in our case (10.2 eV) than the value generally considered in the litterature (5.5 eV). [39] It should also be noted that prior hypothesis concerning the charge density led to compensating corrections on other electron parameters related to classical models (Drude), via e.g. the effective mass used for Au. [42]
V Energetic and transport parameters
In order to investigate to what level the band structure dependence on the excitation degree (via ) affects macroscopic transient characteristics and physical quantities, we evaluated thermodynamic properties of electrons when differs from . Such excitation character corresponds to ultrashort pulse laser irradiation of metal free surfaces, where the spatio-temporal evolution of the electron distribution and its return to equilibrium is calculated by a Boltzmann formalism [18] or by the two temperature model (electronic thermalization assumed). We recall that the TTM describes the energy evolution of electrons and ions subsytems using two diffusion equations coupled by an electron-phonon transfer term.[13] The electronic thermal energy gain is connected to the temperature by the electron specific heat . An accurate evaluation of this property is crucial in laser-matter interaction simulations since it provides a correct estimate of the rise of temperature in the electron system. TTM enables to take into account nonequilibrium effects on the kinetics of the material when it is included in classical molecular dynamics simulations or in two temperatures hydrodynamics approaches. [44, 6, 43] The electronic contribution to results directly from the electron heating, depending thus on but also on the density of states. Consequently, swift matter dynamics start especially due to the pressure gradient generated in the electron system. The key parameters to correctly reproduce the ultrafast nonequilibrium evolution of the material are then based on an electronic equation of states, connecting electronic specific heat and pressure with free electron density and temperature. and are generally derived from the thermodynamic properties of an ideal Fermi gas. [45, 48, 46, 47] This work allows to insert the subtle effects of DOS modifications allowing more accurate perspectives. Transport properties, i.e. electronic thermal and electrical conductivity and electron-phonon coupling strength are also important to complete the kinetic equations but they are beyond the scope of this paper and will be only briefly mentioned. We will focus here on the influence of band structure evaluation on electronic thermodynamic properties.
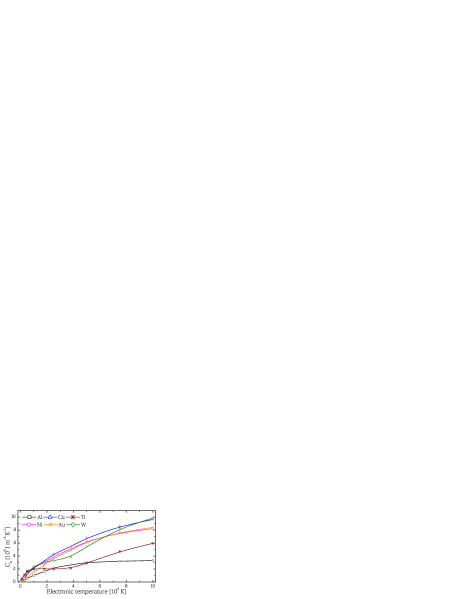
The electron specific heat of metals can be derived with respect to the electronic temperature by , where is the internal energy of the electron system. The evolution of the specific heat under electronic excitation is shown in Fig. 8 where several typical behaviors are observed. For Al, rapidly saturates to the lowest value of all other considered metals. The rest of metals remains far from saturation and reaches much higher values than Al. For W and Ti, exhibits a first leveling from K to K and restarts to increase at higher temperatures. At low and intermediate a relatively good agreement is found with those obtained from evaluated at 0K, where is neglected. [19] For transition metals, increasing discrepancies appear at higher temperatures, mainly due to shifts of the -block that are highly affected by increase. As expected, the temperature dependence of is linear at low electronic temperature and tends to saturate for high toward the non-degenerate limit , where includes both free electrons and part of -electrons. As already mentioned by Lin et al.,[19] thermal excitation from the -band results in a positive deviation of from the linear temperature dependence. Similar results are obtained with our temperature dependent calculations, with an additional deviation resulting from excitation of semicore electrons in case of Ti and W and high .
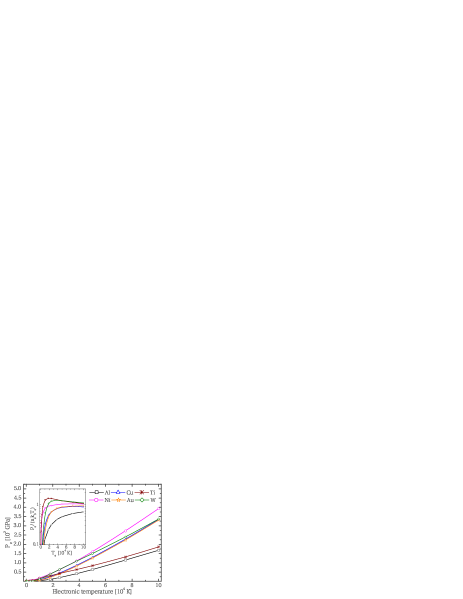
The electronic pressure is determined by the derivative of the electronic free energy with respect to volume as , where is the entropy of the system. The last term corresponding to the entropy contribution to the pressure has been shown to be largely dominant in this range of [30] evolution for the different metals is plotted in Fig. 9 and shows that increases rapidly as for low excitation then scales as for higher temperatures. At K, the electronic pressure is in the order of tens of GPa, and exceeds 100 GPa at K for all metals except Al. Finally, at K more than 300 GPa are reached in case of Ni, Cu, Au and W while it approaches a level of 200 GPa in case of Al and Ti. The fast increase of the electronic pressure is of interest since it is likely impacting the stability or the properties of materials and their evolution upon excitation, notably the initial steps of the thermodynamic trajectories. This strong increase of with comes from the occupation of the high energy states by the electrons, which is governed by the electronic structure and by entropic changes with the electronic temperature.
In order to exhibit band structure effects and to test our free electron approach, we renormalized with respect to the free electron gas pressure limit . The ratio is plotted in the inset of Fig. 9. At low electronic temperatures, degeneracy and band structure effects are dominating and the curves are far from the value of unity, that would characterize an ideal non-degenerated electron gas behavior. However, at higher electronic temperatures, curves tend to saturate at the value of 1.0, which indicates that the free electron numbers we have derived are consistently characterizing the electronic pressure of the system. This asymptotic behavior is not achieved using constant values of given by Ref. [39]. On an other hand, the effect of the entropy contribution on the renormalized is enhanced. The entropy contribution reflects the electronic disorder centered around the Fermi level. It comes from a compromise between the number of available electronic states and the number of electrons allowed to fill these states. In this context, when the Fermi level is within the -block, the entropy effect is stronger, as for Ti and W, than when it is located somewhere else in the DOS (as in the case of Ni, Cu, Au). Al shows the lowest renormalized values due to lowest density of states.
Based on these results, an equation of states of the electron system can be constructed, including the interactions with a static array of positive ions but neglecting interactions with phonons. To predict laser light absorption, subsequent material heating and eventual phase transitions, the transport model should take into account the observed changes in band structure. In a first approach, transport properties can be estimated based on classical formulas but including the evolution of with . In this way, conductivity can be estimated roughly based on the relation derived from the kinetic equation between the electron heat capacity and . [49] If is the relaxation time between collisions and the average electron velocity, then the mean free path allows to make the standard connection which writes . Concerning the laser absorption, insights from the classical formalism of an electron in an optical electric field, i.e. the Drude-Lorentz model, can also be obtained from the calculated properties. Whereas the energy levels and their own occupation define the response of the material to applied optical fields, it is possible to describe the dielectric function by intraband and interband contributions. The optical properties are related to the structure and the electronic configuration of the material and the interband is highly sensitive to the DOS derived in section III. On the other hand, the intraband part (Drude) only depends on the number of free carriers per atom and on an effective momentum scattering time as , where is the laser angular frequency. In this way, it becomes possible to make reasonable deductions about excitation when optical property changes are measured. [50] These insights could become more accurate if we consider informations based on electronic structure calculations, with higher computational costs in this case. [51] Simpler models based on and interband transition from filled to empty states could be useful as a complementary approach, with nevertheless a lower accuracy.
VI Conclusion
In the present study, dependent density functional calculations were performed on a representative range of metals: Al, Ni, Cu, Au, Ti and W, with simple and transition character. Electronic temperatures from to K were used to evaluate electronic properties in nonequilibrium conditions.
In a first step DOS modifications with are discussed. It is shown that almost all bands are affected by energy shifts, but the most affected states are those involving the localized part of the -band which characterizes the transition metals. Shifts towards lower energies and shrinking are observed for filled or almost filled -block metals, illustrated by Ni, Cu and Au. Shifts towards higher energies and extensions for partially filled -block, with Ti and W as examples. All these modifications are explained by evolutions of electron-ion effective potential that result from variation of the electronic screening generated by changes of the electronic occupation of the localized -block. This was validated by two consistent approaches, the evolution of the number of -electrons and the modification of the Hartree energies with .
Changes of the DOS with electronic temperatures impact electronic properties, like the electronic chemical potential and the electronic heat capacities that are discussed and compared to previous calculations performed at K. A good agreement is obtained at low and intermediate temperatures, while an increasing discrepancy is observed when shifts within the electronic structures become stronger at high temperatures. The concept of electronic pressures is also addressed, with pressures rapidly reaching high values, of tens or hundreds of GPa, questioning material stability as increases.
Free electron numbers, dependent on the electronic temperature, are also computed from DOS. They are defined as belonging to delocalized states characterized by density of states having a square root energy dependence. As expected, for a free electron like metal as Al, this number remains constant. However, always increases for transition metals, with specific behaviors depending of the filling degree of the -block. Ni, Cu and Au exhibit a that rapidly increases with while a small lag is observed for Ti and W, with an increase at higher temperatures. At high temperatures, these free electron numbers are found consistent with in an ideal gas limit.
Finally transport properties were addressed via the evolution of the electronic heat capacity and the electronic pressure with . The electronic heat capacity links the quantity of absorbed energy to the electronic temperature, giving an access to the number of free electrons. On the other hand, the rapidly growing electronic pressure may impact phase stabilities. Both are crucial properties, since significant deviations of the thermophysical properties of metals from the commonly used approximations may have important practical implications in ultrashort laser material processing applications.
VII Aknowledgments
We acknowledge Marc Torrent for providing efficient PAW atomic data. This work was supported by the ANR project DYLIPSS (ANR-12-IS04-0002-01) and by the LABEX MANUTECH-SISE (ANR-10-LABX-0075) of the Université de Lyon, within the program ”Investissements d’Avenir” (ANR-11-IDEX-0007) operated by the French National Research Agency (ANR). Part of the numerical calculations has been performed using resources from GENCI, project gen7041.
References
- [1] P. Balling and J. Schou, Rep. Prog. Phys. 76, 036502 (2013).
- [2] A. Cavalleri, Science 318, 5851, 755 (2007).
- [3] E. G. Gamaly, Phys. Rep. 508, 91-243 (2011).
- [4] M. E. Povarnitsyn, K. V. Khishchenko, and P. R. Levashov, Appl. Surf. Sci. 255, 5120 (2009).
- [5] V. Recoules, J. Clérouin, G. Zérah, P.M. Anglade, and S. Mazevet, Phys. Rev. Lett., 96 055503 (2006).
- [6] J.P. Colombier, F. Garrelie, N. Faure, S. Reynaud, M. Bounhalli, E. Audouard, R. Stoian, and F. Pigeon, J. Appl. Phys. 111, 024902 (2012).
- [7] P. Lorazo, L. J. Lewis, and M. Meunier, Phys. Rev. B 73, 134108 (2006).
- [8] J.P. Colombier, P. Combis, E. Audouard, R. Stoian, New J. Phys. 14, 013039 (2012).
- [9] V. V. Zhakhovsky, M. M. Budzevich, N. A. Inogamov, I. I. Oleynik, and C. T. White, Phys. Rev. Lett. 107, 135502 (2011).
- [10] S.E. Kirkwood, Y.Y. Tsui, R. Fedosejevs, A.V. Brantov, V.Yu. Bychenkov, Phys. Rev. B 79, 144120 (2009).
- [11] B. Y. Mueller and B. Rethfeld, Phys. Rev. B 87, 035139 (2013)
- [12] M. I. Kaganov, I. M. Lifshitz, and L. V. Tanatarov, Relaxation between electrons and crystalline lattices, Sov. Phys. JETP 4, 173 (1957).
- [13] S. I. Anisimov, B. L. Kapeliovich, and T. L. Perel’man, Sov. Phys. JETP 39, 375 (1974).
- [14] C.-K. Sun, F. Vallee, L. Acioli, E. P. Ippen, and J. G. Fujimoto, Phys. Rev. B 48, 12365 (1993).
- [15] W. S. Fann, R. Storz, H. W. K. Tom, and J. Bokor, Phys. Rev. Lett. 68, 2834 (1992).
- [16] X. Y. Wang, D. M. Riffe, Y. S. Lee, and M. C. Downer, Phys. Rev. B 50, 8016 (1994).
- [17] T. Ao, Y. Ping, K. Widmann, D. F. Price, E. Lee, H. Tam, P. T. Springer, and A. Ng, Phys. Rev. Lett. 96, 055001 (2006).
- [18] B. Rethfeld, A. Kaiser, M. Vicanek, and G. Simon, Phys. Rev. B 65, 214303 (2002).
- [19] Z. Lin, L. V. Zhigilei, and V. Celli, Phys. Rev. B 77, 075133 (2008).
- [20] P. Hohenberg, and W. Kohn, Phys. Rev. 136, 864 (1964).
- [21] W. Kohn, and L. J. Sham, Phys. Rev. 140, 1133 (1965).
- [22] X. Gonze, B. Amadon, P.-M. Anglade, J.-M. Beuken, F. Bottin, P. Boulanger, F. Bruneval, D. Caliste, R. Caracas, M. Cote, T. Deutsch, L. Genovese, Ph. Ghosez, M. Giantomassi, S. Goedecker, D.R. Hamann, P. Hermet, F. Jollet, G. Jomard, S. Leroux, M. Mancini, S. Mazevet, M.J.T. Oliveira, G. Onida, Y. Pouillon, T. Rangel, G.-M. Rignanese, D. Sangalli, R. Shaltaf, M. Torrent, M.J. Verstraete, G. Zerah, and J.W. Zwanziger, Comput. Phys. Commun. 180, 2582 (2009).
- [23] P. E. Blochl, Phys. Rev. B 50, 17953 (1994).
- [24] G. Kresse and D. Joubert, Phys. Rev. B 59, 1758 (1999).
- [25] M. Torrent, F. Jollet, F. Bottin, G. Zerah, and X. Gonze, Comput. Mater. Sci. 42, 337 (2008).
- [26] J. P. Perdew, K. Burke, and M. Ernzerhof, Phys. Rev. Lett. 77, 3865 (1996).
- [27] J. P. Perdew, and Y. Wang, Phys. Rev. B 45, 13244 (1992).
- [28] H. J. Monkhorst, and J. D. Pack, Phys. Rev. B 13, 3865 (1976).
- [29] N.D. Mermin, Phys. Rev. 137, A1441 (1965).
- [30] S. Khakshouri, D. Alfe, and D.M. Duffy, Phys. Rev. B 78, 224304 (2008).
- [31] R. Gaudoin and W. M. C. Foulkes, Phys. Rev. B 66, 052104 (2002).
- [32] A. Dewaele, P. Loubeyre and M. Mezouar, Phys. Rev. B 70, 094112 (2004).
- [33] J. Zhang, Y. Zhao, R.S. Hixson, G.T. Gray, L. Wang, W. Utsumi, S. Hiroyuki and H. Takanori, Phys. Rev. B 78, 054119 (2008).
- [34] Tabulated data of dependent DOS and electronic properties are available online at http://manutech-sise.universite-lyon.fr/dynopt
- [35] D. A. Papaconstantopoulos, Handbook of the Band Structure of Elemental solids (Plenum Press, New York, 1986).
- [36] A. V. Ponomareva, E. I. Isaev, Yu. Kh. Vekilov, and I. A. Abrikosov, Phys. Rev. B 85, 144117 (2012)
- [37] J. T. Waber and D. T. Cromer, J. Chem. Phys., 42, 12, 4116-4123 (1965).
- [38] D.V. Fisher, Z. Henis, S. Eliezer and J. Meyer-Ter-Vehn, Laser Part. Beams 24, 81-94, (2006).
- [39] N. W. Ashcroft and N. D. Mermin, Solid State Physics (Holt, Rinehart and Winston, New York, 1976).
- [40] P.A. Loboda, N.A. Smirnov, A.A. Shadrin, and N.G. Karlykhanov, High Energy Density Phys. 7, 4, 361-370 (2011).
- [41] W. Ebeling, A. Förster, V. Fortov, V. Griaznov, and A. Polishchuk: Thermophysical Properties of Hot Dense Plasmas (Teubner, Stuttgart 1991).
- [42] N.A. Inogamov, S.I. Ashitkov, V.V. Zhakhovskii, Yu.V. Petrov, V.A. Khokhlov, M.B. Agranat, S.I. Anisimov, K. Nishihara, P.S. Komarov, Abstr. of XXIV Int. Conf. on Interaction of Intense Energy Fluxes with Matter, Elbrus, Kabardino-Balkaria, Russia, p.22-23 (2009).
- [43] N.A. Inogamov, Yu.V. Petrov, V.V. Zhakhovsky, V.A. Khokhlov, B.J. Demaske, S.I. Ashitkov, K.V. Khishchenko, K.P. Migdal, M.B. Agranat, S.I. Anisimov, V.E. Fortov, I.I. Oleynik, AIP Conf. Proc. 1464, 593-608 (2012).
- [44] Z. Lin, R. A. Johnson, and L. V. Zhigilei, Computational study of the generation of crystal defects in a bcc metal target irradiated by short laser pulses, Phys. Rev. B 77, 214108, (2008).
- [45] R. M. More, K. H. Warren, D. A. Young, and G. B. Zimmerman, Phys. Fluids 31, 3059 (1988).
- [46] L. Jiang, and H.-L. Tsai, J. Heat Transfer 127, 1167 (2005).
- [47] J. P. Colombier, P. Combis, F. Bonneau, R. Le Harzic, and E. Audouard, Phys. Rev. B 71, 165406 (2005).
- [48] K. Eidmann, J. Meyer-ter-Vehn, T. Schlegel, and S. Hüller, Phys. Rev. E 62, 1202 (2000).
- [49] Y.V. Petrov, N.A. Inogamov, K.P. Migdal, JETP Lett., 97(1), 20-27 (2013).
- [50] J. P. Colombier, P. Combis, E. Audouard, and R. Stoian, Phys. Rev. E 77, 036409 (2008).
- [51] Z. Chen, B. Holst, S. E. Kirkwood, V. Sametoglu, M. Reid, Y. Y. Tsui, V. Recoules, and A. Ng, Phys. Rev. Lett. 110, 135001 (2013).