Temporal Self-Organization in Galaxy Formation
Abstract
We report on the discovery of a relation between the number of star formation (SF) peaks per unit time, , and the size of the temporal smoothing window function, , used to define the peaks: (). This relation holds over the range of to Myr that can be reliably computed, using a large sample of galaxies obtained from a state-of-the-art cosmological hydrodynamic simulation. This means that the temporal distribution of SF peaks in galaxies as a population is fractal with a Hausdorff fractal dimension equal to . This finding reveals, for the first time, that the superficially chaotic process of galaxy formation is underlined by a temporal self-organization up to at least one gigayear. It is tempting to suggest that, given the known existence of spatial fractals (such as the power-law two-point function of galaxies), there is a joint spatio-temporal self-organization in galaxy formation. From an observational perspective, it will be urgent to devise diagnostics to probe SF histories of galaxies with good temporal resolution to facilitate a test of this prediction. If confirmed, it would provide unambiguous evidence for a new picture of galaxy formation that is interaction driven, cooperative and coherent in and between time and space. Unravelling its origin may hold the key to understanding galaxy formation.
1 Introduction
Galaxy formation involves a large set of physical processes - cosmological expansion, gravity, hydrodynamics, atomic physics and feedback from star formation, stellar evolution and black hole growth - and spans large dynamic ranges in time (at least Myr to Gyr) and space (at least pc to Mpc). Some of the most interesting results on galaxy formation are thus obtained using large-scale simulations, providing fundamental insights on a variety of different aspects (e.g., Frenk et al., 1988; Cen et al., 1994; Gnedin, 1998; Klypin et al., 1999; Moore et al., 1999; Cen & Ostriker, 1999; Wechsler et al., 2002; Abel et al., 2002; Bromm et al., 2002; Springel et al., 2005; Kereš et al., 2005; Hopkins et al., 2006; Croton et al., 2006; Naab et al., 2006; Bournaud et al., 2007; Diemand et al., 2008; Dekel et al., 2009; Schaye et al., 2010). The spatial distributions of galaxies have been extensively studied observationally, primarily at low redshift. Among the most striking is the nature’s ability to maintain a powerlaw galaxy-galay two-point correlation function over a significant range (Mpc) (e.g., Groth & Peebles, 1977), although there is evidence of a slight inflection at Mpc in recent analysis (e.g., Zehavi et al., 2004). This spatial regularity is not inherited from the linear power spectrum but must be a result of cooperation between nonlinear evolution and galaxy formation. In self-gravitating systems, such as galaxies, the temporal and spatial structures may be related. This may be seen by two examples. First, for an isolated (non-dissipative) spherical system, the collapse time of each shell (assuming no shell crossings) is uniquely determined by the interior mass and specific energy of the shell that in turn is determined by the density structures. Second, during the growth of a typical galaxy, in addition to direct acquisition of stars via mergers and accretion (along with dark matter), significant spatial interactions may induce significant star formation activities hence leave temporal imprints in its star formation history. Taking these indications together suggests that one should benefit by tackling the problem of galaxy formation combining the spatial and temporal information. Here, as a step in that direction, we perform a novel analysis, utilizing the ab initio LAOZI adaptive mesh refinement cosmological hydrodynamic simulation, to understand the statistical properties of star formation episodes in galaxies.
2 Simulations
The reader is referred to Cen (2014) for detailed descriptions of our simulations and the list of its empirical validations therein. Briefly, a zoom-in region of comoving size of Mpc3 is embedded in a Mpc periodic box and resolved to better than pc (physical). We use the following cosmological parameters that are consistent with the WMAP7-normalized (Komatsu et al., 2011) CDM model: , , , , and . Equations governing motions of dark matter, gas and stars, and thermodynamic state of gas are followed forward in time from redshift to , using the adaptive mesh refinement cosmological hydrodynamic code Enzo (The Enzo Collaboration et al., 2013), which includes all important microphysics and major feedback processes that are well measured. Stellar particles (equivalent to coeval stellar cluster of mass ) are created from gas clouds meeting certain physical conditions over time, based on the empirical Kennicutt-Schmidt law (Kennicutt, 1998). Stellar particles at any time may be grouped together spatially using the HOP algorithm (Eisenstein & Hut, 1998) to create galaxy catalogs, which are tested to be robust and insensitive to specific choices of concerned parameters within reasonable ranges. For each galaxy we have its exact star formation history, given its member stellar particles formation times. A total of (2090, 965, 296, 94, 32, 10) galaxies are found with stellar masses greater than ( at .
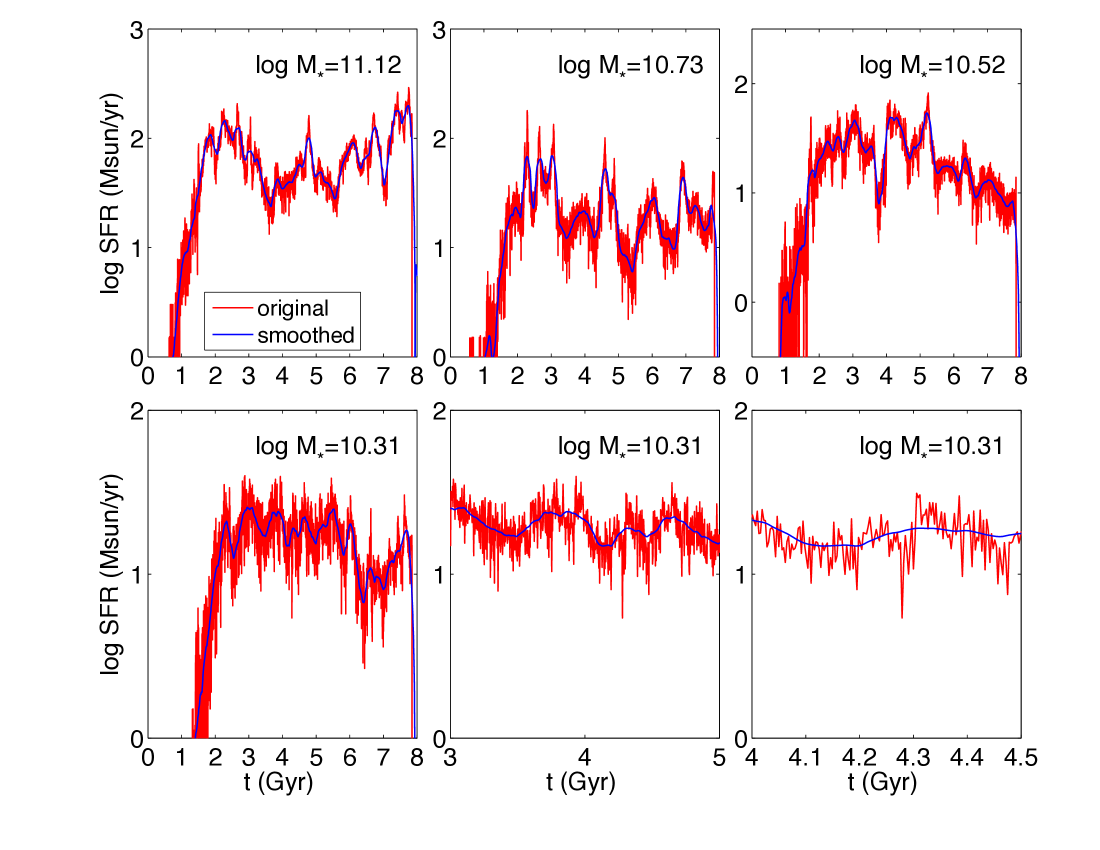
For each galaxy we create an uniform time grid of star formation rate at a time resolution of Myr from redshift to , which we call the “unsmoothed” SF history, denoted as . We then smooth using a square window of full width equal to to create a locally-averaged version, denoted as , which is defined to be . Another variable is then defined from : . We smooth with a gaussian window of radius to yield . We obtain finally . We identify SF peaks in as follows. Each SF peak is defined as a contiguous region between two consecutive local minima in , say, at time and . We sum up in the same temporal region [, ] to get the total stellar mass for the peak. For each galaxy, we catalog and rank order a complete list of peaks each containing the following information: the total stellar mass, the point in time of maximum SFR and the rank. The number of top SF peaks that make up 50% and 90% of total amount of stellar mass of a galaxy at is denoted, and , respectively. We note that the main purpose of smoothing with the gaussian window is to make the automated peak identification method umambiguous. Thus, it is that serves as a time “ruler”. We use and find the slope of the scaling relation found does not depend on within the concerned accuracies.
3 Results

We start by showing the star formation histories for four galaxies in Figure 1. We see that our adaptive smoothing scheme appropriately retains major SF peaks but smooths out high-frequency peaks on scales smaller than the ruler size , exactly serving the purpose. We also see that there are temporal structures from Myr to Gyr. Although it is difficult to quantify visually the nature of the temporal structures, there is a hint that a significant SF peak is often sandwiched by periods of diminished SF activities or less significant SF peaks. It is evident that the histories of individual galaxies vary substantially with respect to both the trend on long time scales and fluctuations on short time scales. Anectodal evidence that is consistent with the global evolution of SFR density (Hopkins & Beacom, 2006) is that, for the galaxy population as a whole, the majority of galaxies are on a downward trend of SFR with increasing time (decreasing redshift) from Gyr (corresponding to to ). It is seen that SF in galaxies is usually not monolithic. A typical galaxy is found to have a polylithic temporal structure of star formation, consisting of a series of quasi-monoliths occurring in time in an apparently chaotic fashion. Not only is there no evidence that a typical galaxy forms most of its stars in a single burst, but also the SF history over any scale does not display a form that may be represented by any simple analytic functions (such as an exponential). A qualitatively similar appearance of oscillatory star formation rates are seen in Hopkins et al. (2013), although detailed quantitative comparisons are not available at this time. One take-away message is this: galaxy formation is a chaotic process and conclusions about the galaxy population as a whole based on an unrepresentative sample of galaxies should be taken cautiously. Another is that the often adopted simple temporal profiles for star formation (such as exponential decay or delta function) in interpreting observational results should be reconsidered.
We now turn to quantitative results. Figure 2 shows the PDFs of and with Myr. We see that the number of peaking containing 50% of stellar mass () falls in the range of peaks, whereas the number of peaks containing 90% of stellar mass () displays a much broader range of . We note that, had we restricted the galaxy stellar mass range to or , the results do not change significantly. It is clear that there are large variations from galaxy to galaxy with respect to individual SF histories, as was already hinted in in Figure 1. Behind this chaos, however, collectively, an order is found, as will be shown in Figure 4.

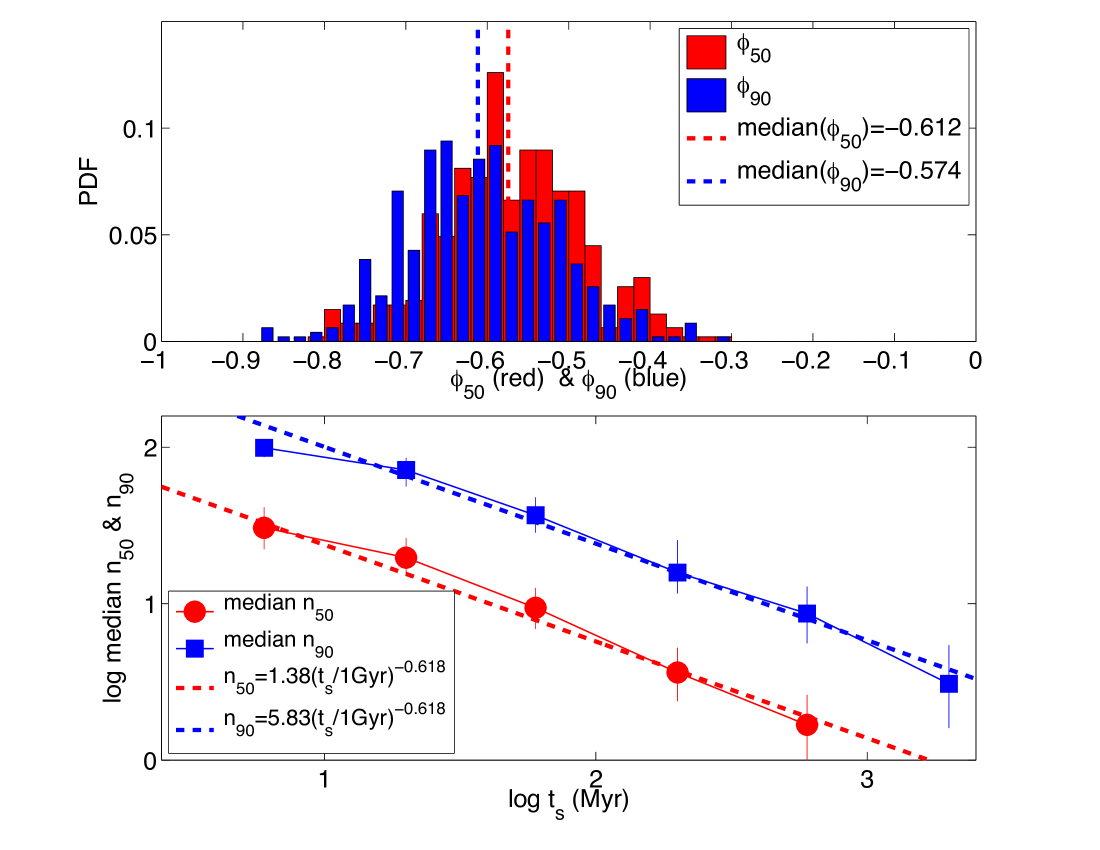
Figure 3 shows (red dots) and (blue squares) as a function of temporal smoothing window for the four galaxies shown in Figure 1. We see that powerlaw fits - and - provide reasonable approximations. Collecting all galaxies with stellar masses greater than at the results are shown in Figure 4. The top panel of Figure 4 shows the PDF of (red histogram) and (blue historgram). We see that there are substantial variations among galaxies, which is expected. The most significant point is that a typical galaxy has and around . In other words, the galaxy population, collectively taken as a whole, displays significant orderliness. This point is re-enforced in the bottom panel of Figure 4, which is similar to Figure 3. But here, instead of showing powerlaw fits for individual galaxies, we compute the median of (red dots) and (blue squares) for all galaxies first as a function of and then show the fits to the medians. It is intriguing that a slope about () provides a quite good fit, where is often called the golden ratio.
4 Discussion and Conclusions
This paper is the third in the series “On the Origin of the Hubble Sequence”. Utilizing ab initio Large-scale Adaptive-mesh-refinement Omniscient Zoom-In cosmological hydrodynamic simulations (LAOZI Simulations) of the standard cold dark matter model, we undertake a unique study of the statistical properties of star formation episodes in galaxies. We find a relation between the number of star formation (SF) peaks per unit time, , and the size of the temporal smoothing window function, , used to define the peaks: (), valid over the range of Gyr. It is expected that the findings do not significantly depend on precise cosmological parameters, since the responsible processes are mostly in the nonlinear regime, although it remains to be seen if the relation extends to below 10Myr, where non-gravitational processes, including feedback processes, may introduce time scales of their own. The implication is profound: galaxy formation is temporally fractal and displays a self-organization up to at least one gigayear, with a Hausdorff (1919) dimension equal to .
We attribute this temporal self-organization, tentatively, to interactions between galaxies that presumably trigger star formation peaks and are organized temporally in a way that is yet to be quantitatively understood. Qualitatively, the found results may be explained as follows. One could envision that galaxies are normally (at least at high redshift) embedded in a gas reservoir, which is the potential fuel of star formation. When there is a trigger, some of this gas is driven inward to fuel star formation. The triggers are likely due to significant interactions between galaxies, such as major and minor mergers or close fly-bys of significant galaxies, or some torquing events, or some hydrodynamic events. The triggers may be democratically distributed temporally in the sense that at a given time baseline a large trigger is not usually preceded or followed by another large trigger, but rather by small triggers. One might even argue that in some rare cases, even if a large trigger does follow a preceding large one, a significant “drawdown” of gas by the preceding SF peak may cause the second SF peak to be less powerful that it otherwise would. Such compensated behavior could give rise to the temporal structures seen. Were the triggers distributed randomly, then would be . Should the triggers be completely correlated (i.e., a delta function in time), then would be .
Since the triggering of SF peaks by galaxy interactions implies spatial correlations of galaxies, and given that galaxies are known to exhibit spatial fractals, such as the power-law galaxy two-point correlation function (e.g., Peebles, 1980), our results are strongly indicative that galaxy formation may be governed by a fundamental joint spatio-temporal self-organization. Understanding the origin of this self-organization may hold a key to understanding galaxy formation.
Observational diagnostics to probe SF histories of galaxies with competitively good temporal resolution from a few Myr to Gyr, especially those that are applicable to a sufficient sample of galaxies, are highly wanted, in order to test the predictions made here. In addition, with the development of this new line of inquiry, more accurate observational characterizations of galaxy clustering at high redshift at the peak of star formation will be useful.
In spite of the apparent coincidence, it would be premature to emphatically relate to the golden ratio. Nonetheless, the ubiquitous manifestations of the golden ratio in nature suggest that further investigations with higher statistical accuracies may be warranted. Could the galaxy formation be golden after all?
I would like to thank Claire Lackner for providing the SQL based merger tree construction software. The analysis program yt (Turk et al., 2011) is used to perform some of the analysis. Computing resources were in part provided by the NASA High- End Computing (HEC) Program through the NASA Advanced Supercomputing (NAS) Division at Ames Research Center. This work is supported in part by grant NASA NNX11AI23G.
Conclusions
- Abel et al. (2002) Abel, T., Bryan, G. L., & Norman, M. L. 2002, Science, 295, 93
- Bournaud et al. (2007) Bournaud, F., Elmegreen, B. G., & Elmegreen, D. M. 2007, ApJ, 670, 237
- Bromm et al. (2002) Bromm, V., Coppi, P. S., & Larson, R. B. 2002, ApJ, 564, 23
- Cen (2014) Cen, R. 2014, ApJ, 781, 38
- Cen et al. (1994) Cen, R., Miralda-Escude, J., Ostriker, J. P., & Rauch, M. 1994, ApJ, 437, L9
- Cen & Ostriker (1999) Cen, R., & Ostriker, J. P. 1999, ApJ, 514, 1
- Croton et al. (2006) Croton, D. J., Springel, V., White, S. D. M., De Lucia, G., Frenk, C. S., Gao, L., Jenkins, A., Kauffmann, G., Navarro, J. F., & Yoshida, N. 2006, MNRAS, 365, 11
- Dekel et al. (2009) Dekel, A., Birnboim, Y., Engel, G., Freundlich, J., Goerdt, T., Mumcuoglu, M., Neistein, E., Pichon, C., Teyssier, R., & Zinger, E. 2009, Nature, 457, 451
- Diemand et al. (2008) Diemand, J., Kuhlen, M., Madau, P., Zemp, M., Moore, B., Potter, D., & Stadel, J. 2008, Nature, 454, 735
- Eisenstein & Hut (1998) Eisenstein, D. J., & Hut, P. 1998, ApJ, 498, 137
- Frenk et al. (1988) Frenk, C. S., White, S. D. M., Davis, M., & Efstathiou, G. 1988, ApJ, 327, 507
- Gnedin (1998) Gnedin, N. Y. 1998, MNRAS, 294, 407
- Groth & Peebles (1977) Groth, E. J., & Peebles, P. J. E. 1977, ApJ, 217, 385
- Hausdorff (1919) Hausdorff, F. 1919, Mathematische Annalen, 79, 157
- Hopkins & Beacom (2006) Hopkins, A. M., & Beacom, J. F. 2006, ApJ, 651, 142
- Hopkins et al. (2006) Hopkins, P. F., Hernquist, L., Cox, T. J., Di Matteo, T., Robertson, B., & Springel, V. 2006, ApJS, 163, 1
- Hopkins et al. (2013) Hopkins, P. F., Keres, D., Onorbe, J., Faucher-Giguere, C.-A., Quataert, E., Murray, N., & Bullock, J. S. 2013, ArXiv e-prints
- Kennicutt (1998) Kennicutt, Jr., R. C. 1998, ApJ, 498, 541
- Kereš et al. (2005) Kereš, D., Katz, N., Weinberg, D. H., & Davé, R. 2005, MNRAS, 363, 2
- Klypin et al. (1999) Klypin, A., Kravtsov, A. V., Valenzuela, O., & Prada, F. 1999, ApJ, 522, 82
- Komatsu et al. (2011) Komatsu, E., Smith, K. M., Dunkley, J., Bennett, C. L., Gold, B., Hinshaw, G., Jarosik, N., Larson, D., Nolta, M. R., Page, L., Spergel, D. N., Halpern, M., Hill, R. S., Kogut, A., Limon, M., Meyer, S. S., Odegard, N., Tucker, G. S., Weiland, J. L., Wollack, E., & Wright, E. L. 2011, ApJS, 192, 18
- Moore et al. (1999) Moore, B., Ghigna, S., Governato, F., Lake, G., Quinn, T., Stadel, J., & Tozzi, P. 1999, ApJ, 524, L19
- Naab et al. (2006) Naab, T., Khochfar, S., & Burkert, A. 2006, ApJ, 636, L81
- Peebles (1980) Peebles, P. J. E. 1980, The large-scale structure of the universe (Research supported by the National Science Foundation. Princeton, N.J., Princeton University Press, 1980. 435 p.)
- Schaye et al. (2010) Schaye, J., Dalla Vecchia, C., Booth, C. M., Wiersma, R. P. C., Theuns, T., Haas, M. R., Bertone, S., Duffy, A. R., McCarthy, I. G., & van de Voort, F. 2010, MNRAS, 402, 1536
- Springel et al. (2005) Springel, V., White, S. D. M., Jenkins, A., Frenk, C. S., Yoshida, N., Gao, L., Navarro, J., Thacker, R., Croton, D., Helly, J., Peacock, J. A., Cole, S., Thomas, P., Couchman, H., Evrard, A., Colberg, J., & Pearce, F. 2005, Nature, 435, 629
- The Enzo Collaboration et al. (2013) The Enzo Collaboration, Bryan, G. L., Norman, M. L., O’Shea, B. W., Abel, T., Wise, J. H., Turk, M. J., Reynolds, D. R., Collins, D. C., Wang, P., Skillman, S. W., Smith, B., Harkness, R. P., Bordner, J., Kim, J.-h., Kuhlen, M., Xu, H., Goldbaum, N., Hummels, C., Kritsuk, A. G., Tasker, E., Skory, S., Simpson, C. M., Hahn, O., Oishi, J. S., So, G. C., Zhao, F., Cen, R., & Li, Y. 2013, ArXiv e-prints
- Turk et al. (2011) Turk, M. J., Smith, B. D., Oishi, J. S., Skory, S., Skillman, S. W., Abel, T., & Norman, M. L. 2011, ApJS, 192, 9
- Wechsler et al. (2002) Wechsler, R. H., Bullock, J. S., Primack, J. R., Kravtsov, A. V., & Dekel, A. 2002, ApJ, 568, 52
- Zehavi et al. (2004) Zehavi, I., Weinberg, D. H., Zheng, Z., Berlind, A. A., Frieman, J. A., Scoccimarro, R., Sheth, R. K., Blanton, M. R., Tegmark, M., Mo, H. J., Bahcall, N. A., Brinkmann, J., Burles, S., Csabai, I., Fukugita, M., Gunn, J. E., Lamb, D. Q., Loveday, J., Lupton, R. H., Meiksin, A., Munn, J. A., Nichol, R. C., Schlegel, D., Schneider, D. P., SubbaRao, M., Szalay, A. S., Uomoto, A., York, D. G., & SDSS Collaboration. 2004, ApJ, 608, 16