Strong gravitational lensing as a tool to investigate the structure of jets at high energies
Abstract
The components of blazar jets that emit radiation span a factor of in scale. The spatial structure of these emitting regions depends on the observed energy. Photons emitted at different sites cross the lens plane at different distances from the mass-weighted center of the lens. Thus there are differences in magnification ratios and time delays between the images of lensed blazars observed at different energies. When the lens structure and redshift are known from optical observations, these constraints can elucidate the structure of the source at high energies. At these energies, current technology is inadequate to resolve these sources and the observed light curve is thus the sum of the images. Durations of -ray flares are short compared with typical time delays; thus both the magnification ratio and the time delay can be measured for the delayed counterparts. These measurements are a basis for localizing the emitting region along the jet. To demonstrate the power of strong gravitational lensing, we build a toy model based on the best studied and the nearest relativistic jet M87.
Subject headings:
Galaxies: active – gravitational lensing: strong –gamma-rays: jets1. Introduction
Strong gravitational lensing is a powerful tool for exploring the universe (Schneider et al., 1992). It magnifies distant objects and provides a way to observe their structure and detailed properties (e.g. Yuan et al. (2012); Postman et al. (2012); Laporte et al. (2012)).
Blazars are the most luminous energy source in the universe; they are also among the most mysterious. Strongly lensed blazars offer a new window for elucidating their structure.
The components of blazars that emit radiation from the radio to the -ray span a factor of in scale. The images of lensed blazars are resolved in the radio and in the optical (Martí-Vidal et al., 2013; O’Dea et al., 1992; Patnaik et al., 1995; King et al., 1997). Their sizes are from sub parsec up to megaparsec. Radio interferometry resolves the details of blazar radio emission from the core, the jets, and the extensive lobes (Marscher et al., 2008). Improved angular resolution of current X-ray satellites demonstrates that the X-ray emission from the jet forms structures as large as hundreds of kpcs (Harris & Krawczynski, 2006; Tavecchio et al., 2007; Siemiginowska et al., 2002). At high energies, the technology is inadequate to resolve the sources. However, the short variability timescales suggest that the sources of the high energy radiation during a flare is of the order of parsec (Sbarrato et al., 2011). It remains unclear whether the radiation source is the same at all energies. The source of radiation may be close to the base of the jet or it may originate from blobs moving along the jet at relativistic speed.
Strong lensing provides a potential tool for distinguishing among the possible emission sites. These strongly lensed sources may thus provide fundamental discriminants among models for high energy emission in blazars. Photons emitted at the different sites cross the lens plane at different distances from the mass-weighted center of the lens. Thus the magnification ratios, and the time delays between the images depend on the location where the radiation originates. Because the site of the emission may be energy dependent, the magnifications ratios and time delays may differ from one wavelength range to another. They may even differ from one flare to another in the same source if the radiation originates from knots in the jet.
Here, we develop a method for using strong gravitational lensing as a tool to constrain the internal structure of blazar jets. We use the detailed observations of M87 to construct a toy model of the source (Section 2). We discuss the range of projected physical scales relative to the Einstein radius size (Section 3). The first step in the process is the determination of the lens properties from the spatially resolved radio and optical images (Section 4). Within the context of the well-constrained CDM cosmology (Planck Collaboration et al., 2013), distances to the lens and source are also known. In -rays, the observed light curve is the sum of the lensed images. We show that the properties of distinct flares enable retrieval of the properties of the source even though the images are unresolved. The crucial -ray observations are the amplitude and time delay of the flares (Sections 5 and 6).
2. M87: A Toy Model
Unified structure for the inner regions of quasars (Urry & Padovani, 1995; Elvis, 2000) demonstrate that the Active Galactic Nuclei (AGNs) all have similar internal structure. The fraction of quasars with strong radio emission constitute about 10% of the sample (Ivezić et al., 2002; Kimball & Ivezic, 2014). The differences in their appearance largely result from the orientation of the jet. When the jet is pointed close to the line-of-sight, the emission is relativistically boosted. The resulting extremely luminous object is called a blazar.
At the center of the blazar, the super massive black hole has a typical Schwarzschild radius of pc. So far, primary constraints on the physical scale of the central engines of distant AGN come from the intrinsic variability of the emission (Peterson, 2001) and from microlensing (Morgan et al., 2010). The jets transport energy and momentum over large distances (Blandford & Rees, 1974). The jet may extend for scales up to megaparsecs. Their structure is complex and includes hotspots and blobs (Massaro et al., 2011; Godfrey et al., 2012; Massaro et al., 2012).
Most of the time, blazars are in the so-called low state; occasionally their flux increases by more than an order of magnitude. The rapid variability in these GeV-TeV flares implies that emission during a flare must originate from compact structures within the relativistic jet (Böttcher et al., 2013; Begelman et al., 2008). It is increasingly clear that there may be a multiplicity of active zones during both the low and high states of blazars.
3C273 provides an interesting local case in point. The source is a typical blazar with the jet oriented nearly along the line-of-sight. Radio, optical and X-ray observations show that there is rich structure within the jet; the compact structures are different at different wavelengths (Marshall et al., 2001). VHE111very high energy, VHE: 100 GeV emission has not yet been detected from 3C273.
To understand the role of strong lensing in placing constraints on blazar structure, we use the detailed observations of M87 to construct a toy model. M87 is a giant radio galaxy located in the core of the Virgo cluster at distance of 16.7 Mpc (Jordán et al., 2005). M87 has a blazar-like core and a jet, but it has lower luminosity than the typical high redshift blazar. M87 is a VHE -ray emitter (Abramowski et al., 2012). The exact location of the source of VHE emission remains unclear but the Chandra X-Ray Observatory monitoring program revealed increased intensity by more than a factor of 50 from the knot HST-1 (Harris et al., 2006, 2009). In spite of the lower luminosity, we can use this well-observed nearby object as a platform for examining the power of strong lensing observations.
The M87 jet consists of bright knots of radio, optical, and X-ray emission spread throughout a projected distance of 1.6 kpc (81 pc/”). The optical and X-ray emission correspond to radio features.
Observations with the Chandra X-Ray Observatory (Madrid et al., 2007) show that substantially increased X-ray emission originates from at least two regions: the core of M87 and a bright blob of material, HST-1, embedded in the jet (Biretta et al., 1999). VERITAS, H.E.S.S. and MAGIC all detected VHE emission simultaneous with the increased X-ray luminosity from the HST-1.
The knot, HST-1, is located at a projected distance of 60 pc from the core. It consists of bright knots observed with apparent velocities, , with a range of 4c-6c (Biretta et al., 1999). The observed apparent velocity requires that the jet must be no more than 19∘ from our line-of-sight (Biretta et al., 1999) based on the standard picture of relativistic boosting (Rees, 1966).
At the distance of M87, the angular resolution of ground-based VHE instruments corresponds to a projected size of 30 kpc, much larger than the projected distance between the core and HST-1, thus explaining the ambiguity in the location of the VHE emission. Obviously, in the case of distant blazars, direct determination of the location of the source of the VHE emission is hopeless with current technologies.
In the discussion below we place M87 at redshift with a lens at . We assume that the orientation of the M87 jet relative to the line-of-sight is the same as observed at its true redshift. We use this model to illustrate the way strong lensing can constrain the location of the VHE emission. For the purposes of demonstrating the technique, we orient the jet along a radial direction in the lens plane.
3. Physical Scales
As a first step in investigating strong lensing of blazars, we examine the range of projected physical scales relative to the Einstein radius in the lens plane.
We model the lens as a singular isothermal sphere (SIS) with Einstein radius:
| (1) |
where is the velocity dispersion of the stars, , , and (see Figure 1) are the angular diameter distances from the observer to the lens, from the lens to the source and from the observer to the source, respectively (Narayan & Bartelmann, 1996).
For strong lensing, the typical mass of the lensing galaxy is . Using equation (1), the size of the source projected into the lens plane is:
| (2) | |||||
For our M87 toy model, the Einstein radius is 0.45′′. The projected distance between the core and HST-1, corresponds to 0.027. There are many knots at greater distances that even extend beyond the Einstein radius. In principle, any of these knots may be sources of -ray emission.
4. The Application of Strong Lensing
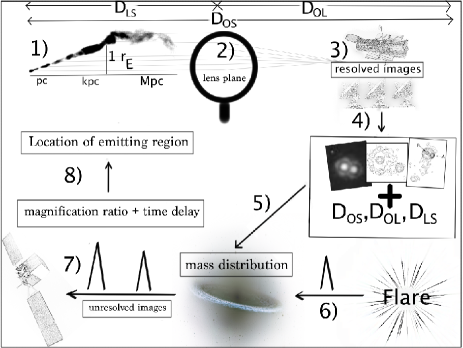
Here we outline the steps in interpreting strong lensing observations of blazars. The approach takes advantage of multi-wavelength observations. Resolved images in the radio, optical, and X-ray are a foundation for understanding the origin of -ray emission.
Figure 1 shows a schematic for the proposed approach. Radio and optical instruments already provide resolved images of dozens of gravitationally lensed flat spectrum radio quasars (FSRQs) (JVAC/CLASS222http://www.jb.man.ac.uk/research/gravlens/lensarch/lens.html). For the FSRQs, the redshift of the source and lens are known. Cosmological parameters like Hubble constant are very-well determined by other observations (Planck Collaboration et al., 2013); we thus assume these precise values to determine the distances in the lens configuration.
The image morphology together with the distances constrain the central mass density of the lens. For a source at the lens is at low enough redshift that direct optical imaging and spectroscopy can also provide important constraints on the central mass density and mass distribution of the lens (Bolton et al., 2008; Keeton et al., 1998). In the following discussion we assume that the lens properties are known.
Even at wavelengths where the lensed image is resolved, the magnification ratios and time delays may not be identical at different wavelengths. In general, these differences have been interpreted as a result solely of microlensing (Oshima et al., 2001). However, the example of M87 suggests that differences in the location and size of the emitting regions at different wavelengths may contribute substantially to the variation in properties of the lensed images.
The optical observations of M87 shows extended emission on a scale of 1 kpc dominated by the host galaxy. In contrast, VLA observations at wavelengths 2 cm and 90 cm reveal very different emission region sizes ranging from sub parsec to hundred kiloparsec scales, respectively. The emission regions include a number of knots, filaments, and more extended structures.
Structures in the M87 jet are also resolved in the X-ray. These sources are spatially coincident with emission sources in the UV and the radio. If M87 were farther away or if it were observed with poorer angular resolution, the X-ray variability that we observe arising from a knot in the jet might well be ascribed to an emission source near the core (Harris et al., 2003).
Constraints on the distribution of the emitting regions can be also obtained in the -ray regime even though the images are unresolved. The duration of flares at high energies is short (2 days) compared with the time delays (dozen to hundreds of days). Thus individual flares that correspond to multiple lensed images can be resolved. Identification of the components of the flare provide both amplitudes and time delays. Thus we have a measure of the magnification ratio even though the source is unresolved.
We have a set of constraints on the locations and sizes of emitting regions at resolved wavelengths. We can then use the -ray observations to ask whether the emission originates from the same regions as the lower energy radiation or not.
5. Variation in the Magnification Ratio
In the simple case where there are two lensed images, the magnification ratio depends on the displacement between the source and the lens in the lens plane. The magnification ratio also depends on the mass distribution of the lens which we assume is known from other observations. For the purpose of demonstration, we continue here with the assumption of a radially symmetric lens represented by the SIS model (Narayan & Bartelmann, 1996).
For a source that lies within the Einstein ring , where is the distance between the source and the weighted center of the mass in the lens plane, multiple images appear at distances from the lens:
| (3) |
where is in dimensionless units normalized to the Einstein radius ().
The magnification for images of a compact source is
| (4) |
The magnification ratio between the two images of the compact source is
| (5) |
Because gravitational lensing conserves surface brightness, the magnification for an extended sources is simply the ratio of the image area to the source area (Stanek et al., 1993). Correspondingly, the image magnification of an extended source, , is the integral of the source intensity weighted by the point source magnification:
| (6) |
where and are defined by . We approximate the surface brightness of the source with a gaussian distribution.
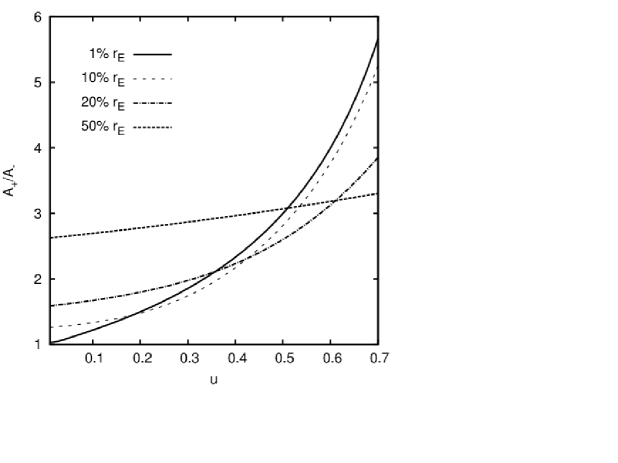
Figure 2 shows the magnification ratio between the images as a function of the distance between the lens and the source in the lens plane. The solid curve shows the magnification ratio for a compact source (size 1%; the dotted, dashed-dotted and dashed curves show the magnification ratio for an extended source with sizes 10%, 20%, 50% in units of . Even a small change of the distance introduces significant variation in the magnification ratio.
Furthermore, concentric sources of emission at different wavelengths have different spatial extent and thus different magnification ratios. For example, the majority of optical emission of M87, dominated by the host galaxy, would extends up to 50% of the Einstein radius at z=1. For our toy model, the observed magnification ratio between the two optical images of the galaxy would be 3. Because the source is the extended host galaxy, the magnification ratio would not change significantly with changes in .
For the M87 jet located at z=1, the distance between the core and the HST-1 corresponds to 0.027. In the case of M87 the lensed image of these bright knots could be observed at radio and X-ray wavelengths. In the optical, their surface brightness is not high enough for them to be resolved against the entire galaxy. In the radio, the hot spots corresponding to the core and HST-1 are resolved. A change in the distance between the lens and the source of the order of 0.027 would correspond to a difference in the magnification ratio of 0.2. If the -ray source coincides with the radio source, the magnification should be identical.
For the M87 toy model, a 1% change in corresponds to 22 pc. During a flare, the large number of photons enables measurement of differences in the magnification ratio as small as 0.2 and thus, differences in the location of the emission sites as small as 60 pc can be detected.
Measurements of flux with even greater precision will allow detection of smaller changes in the magnification ratio thus better discriminating among sites of -ray emission. Even with improved flux measurements, the magnification ratios alone are insufficient to restrict the location of -ray emission. As we discuss next, flaring of the sources and measurement of the time delays provides a route to a robust restriction of the source position.
6. Variation in the Time Delay
We can reduce the ambiguity in the origin of the -ray emission by taking advantage of measurements of the time delay in flaring sources. Once the time delay is measured, the magnification ratio (or relative flux of the delayed components of the flare) between the images can also be determined. The difference in time delay is the essential measure of differences in the location of emitting regions.
The time delay function is (Narayan & Bartelmann, 1996):
| (7) |
where , and is the effective gravitational potential of the lens. The time delay is proportional to the square of the angular offset between and , resulting from the difference in light travel time for the two images.
For the M87 toy model, a 1% change in (1% = 22 pc) produces a change in the time delay of days. The displacement of 0.027 between the core of M87 and HST-1 changes the time delay by almost 2 days and the magnification ratio by . We measure the relative fluxes, or equivalently the magnification ratio, between the flare and its delayed counterpart. We can then compare the magnification ratio with resolved sources at other wavelengths. If the magnification ratios are the same, it is consistent to identify the location of the -ray flare with the resolved source.
7. Limitations of the Model
Constraints on the size and location of the -ray emitting region site could be limited in some cases by microlensing, or by - absorption.
Microlensing by a star within the lensing galaxy can impact the observed amplitude of the -ray emission. The important issue in evaluating the impact of microlensing is the Einstein radius of the microlensing star relative to the expected source size. The Einstein radius of a star located at a cosmological distance is of the order of (M/M⊙) cm. Limits on the size of the emitting region, obtained from the minimum variability time scale, are also of the order of 1016 cm (Sbarrato et al., 2011). Cheung et al. (2014) provides an additional limit on the size of the -ray emitting region; they propose that the scale is cm times the Doppler factor. The average Doppler factor measured for -ray bright blazars is 20 (Savolainen et al., 2010) and thus the size limit is cm in rough accord with Sbarrato et al. (2011). The -ray emitting region is thus comparable in size to the Einstein radius of a solar-mass star.
When the source size and Einstein radius of the lens are comparable, finite source effects are important in microlensing (Kochanek, 2004; Congdon et al., 2007; Schechter et al., 2003). In this case, the magnification ratio is essentially unchanged.
The upper limits on the sizes of emitting regions obtained for samples of blazars with variability time scales on the order of a few minutes (Gaidos et al., 1996; Aharonian et al., 2007; Aleksić et al., 2011) suggest that in some cases the size of the emitting region can be smaller compared to the Einstein radius. In these cases, the magnification ratio can differ from those predicted by the macro-lens modeling. Nevertheless, microlensing leaves the time delay unchanged. Thus, the location of the very compact -ray emitting regions can still be constrained using the proposed approach limited to time delay measurements.
Another issue is that -ray photons emitted from sources at cosmological distances may be absorbed by the - interaction as they travel through various photon fields.
Barnacka et al. (2014) investigate whether light emitted by the foreground lens affects the lensing signatures as a result of absorption. They find that the collective photon fields from lensing galaxies typically do not produce any measurable excess opacity beyond that of the Extragalactic Background Light (EBL) (Abdo et al., 2010; Ackermann et al., 2012). The EBL can reduce the observed flux of the images of the lensed blazar, but the images of a given blazar will be changed by the same fractional amount. Thus, the magnification ratios and the time delays between the images remain unchanged by the EBL.
We conclude that neither microlensing nor absorption precludes application of the technique we propose for constraining the nature of the -ray source. In any case, once there is a large sample of lensed sources, it is unlikely that microlensing and/or absorption will have a significant effect on all sources.
8. Discussion
Observation of gravitational lensing is challenging at high energies because only the most powerful sources, like blazars, can be detected. The nature of the jets in these sources remains puzzling. Most of the power from the majority of blazars is released in the high energy range, but investigating high energy emissions from these sources is severely limited by the impossibility of resolving it. Despite abundant observations, the origin of these -ray emissions is not fully understood. All models assume that the source of VHE emission is close to the base of the jet.
The Fermi Gamma-ray Space Telescope has continuously monitored the whole sky since 2008, detecting photons from the most luminous objects in the universe (e.g. blazars and gamma-ray bursts). The number of expected gravitationally-lensed systems among the 370 FSRQs listed in the 2nd Fermi catalogue (Nolan et al., 2012) is 10 (Barnacka, 2013), but only about 5% of these gravitationally-lensed systems will produce double images of the source (Fukugita et al., 1992).
The number of blazars detected is , but their redshifts are generally unknown. Thus, the number of lensed sources probably exceeds the estimate based on the FSRQs. The lensing probability may be further increased by magnification bias (Turner et al., 1984; Narayan & Wallington, 1993).
Among the FSRQs detected at high energy, PKS 1830-211 and B2 0218+35 are known as a strongly gravitationally lensed systems. The detection of a gravitational-lens induced echo of days in the light curve of PKS 1830-211 during low state by Barnacka et al. (2011) provided the first evidence for strong gravitational lensing of a -ray source (see Cheung et al. (2014) for an alternative view). Radio observations of the two lensed images of PKS 1830-211 provide a magnification ratio of 1.5 and time delay days (Lovell et al., 1998). Remarkably, the delay for the -ray emission in the low state is consistent with the radio delay. Thus, the radiation sources may be coincident.
In contrast, the PKS 1830-211 flares detected in -rays (Ciprini, 2010) do not show delayed counterparts at the radio time delay. The magnification ratio has not yet been measured. A clean measurement of the time delay and the corresponding magnification ratio would determine whether the flare and the emission in the low state originate from the same region. In other words, strong gravitational lensing can be used to distinguish the sites of emission during low and flaring states of blazars by comparing the time delay between delayed counterparts to the time delay obtained from the low state (Barnacka et al., 2011). This approach is similar to reverberation mapping (Peterson, 1993).
For the second lensed source, B2 0218+35, detected in high energies, the components of delayed -ray flare B2 0218+35 have similar fluxes, implying a magnification ratio close to 1 (Cheung et al., 2014).
Cheung et al. (2014) demonstrates a method for analyzing complex light curves that consist of many superimposed flares. Their method allows extraction of both the time delay and the magnification ratios. Radio observations of this source give a time delay consistent with the time delay for the -ray flare. The time delay for the radio images at 15 and 8.4 GHz is days (Biggs et al., 1999) and days (Cohen et al., 2000). Radio observations give much larger magnification ratios of 3.2 at 8 GHz and 4.3 at 15 GHz (Cohen et al., 2000).
For B2 0218+35, one can construct a consistent model where the radiation sources coincide, but differ in size. During the flare, the size of the ray source is cm (Cheung et al., 2014), much smaller than the Einstein radius. In the radio, the jet extends well beyond the Einstein radius. Figure 2 shows that the magnification ratio can easily differ by a factor of 3 for coincident sources with sizes and .
For B2 0218+35, the large error in the radio time delay precludes discrimination between the simple model of coincident radiation sources with different spatial extent and a model similar to M87, where the radiation sources are not coincident.
If M87 were gravitationally lensed, and the flare originated from HST-1 rather than the core, we would expect a difference in the time delay of 2 days. Robust discrimination between the core and HST-1 models would require an accuracy in time delay measurement of days. This accuracy can probably be obtained in both the optical and -ray regimes.
The difference in magnification ratio for the core and HST-1 models is small, . For a -ray flare, the error in the relative flux measurement can be . These estimates assume a smooth, symmetric SIS mass distribution. For more complex lenses with asymmetric mass distributions and possible substructure, variations of the magnification ratio and the time delay are larger. In principle, a more complex lens can enable the resolution of more detailed structure in the blazar. Thus, our estimates for M87 are conservative.
Pushkarev et al. (2010) suggests that the distances between the radio and -ray emissions are small. Resolution of small scales depends on the detailed properties of the lens. The inhomogeneous mass distribution of a typical galaxy allows constraints on the projected distance to the -ray emitting region site that can be much tighter than 60 pc (Metcalf & Zhao, 2002; Dalal & Kochanek, 2002; McKean et al., 2007; Keeton & Moustakas, 2009; Fadely & Keeton, 2012).
A model where the VHE emission occurs close to the base of the jet and one where it originates from spatially distinct knots, as in M87, differ in the underlying fundamental physics (Mücke et al., 2003; Reimer et al., 2004; Stawarz et al., 2005, 2006). To explain the observed rapid variability and to avoid catastrophic pair production in blazars, models assume that the -rays are produced in compact emission regions moving with relativistic bulk velocities in or near the parsec scale core (Dondi & Ghisellini, 1995). However, recent detection of sub-TeV emission from FSRQs suggests that the blazar zone can be located several parsecs away from a massive black hole (Barnacka et al., 2013; Nalewajko et al., 2012). Refined analysis of existing data, along with additional identifications of gravitationally-lensed blazars, have the potential to elucidate blazar emission models.
9. Conclusions
Strong gravitational lensing is a potentially powerful tool for investigating the structures of jets at -ray energies where the angular resolution of instruments is insufficient to resolve the source. Observations of strongly lensed sources can discriminate among models where the -ray emission comes from the region close to the core and along those where it originates from knots along the jet.
Two gravitationally-lensed blazars have been detected at high energies (Barnacka et al., 2011; Cheung et al., 2014); both have flared (Ciprini, 2010, 2012; Cheung et al., 2012). Measurements of time delays and magnification ratios for the lensed counterparts provide a unique opportunity to investigate the origin of the -ray emission.
The M87 toy model that we have constructed shows that constraining the emission site to a 60 pc projected distance requires an accuracy in the time delay measurement of 0.4 days, and an accuracy in the magnification ratio of a few percent. Currently, these quantities can be measured to this accuracy at -rays, and in the near future measurements with this precision will be possible at shorter wavelengths.
Shortly, dozens of gravitationally-lensed systems will be detected at energies GeV. In the coming years, these sources will have dozens of sets of flares. This statistical ensemble of flaring sources will allow a systematic study constraining the sites of -ray emission.
At energies 100 GeV (VHE), absorption by the Extragalactic Background Light precludes detection of sources at 1. Even at these energies, the number of known gravitationally-lensed systems should increase very rapidly in the future. Euclid and SKA will reveal blazars at redshift low enough to be detected at VHE. Observations of flaring sources with ground-based Cherenkov telescopes like VERITAS (Weekes et al., 2002), or, eventually, the Cherenkov Telescope Array, CTA (Actis et al., 2011), will provide the time delays and magnification ratios necessary to limit the emission region.
References
- Abdo et al. (2010) Abdo, A. A., Ackermann, M., Ajello, M., et al. 2010, ApJ, 723, 1082
- Abramowski et al. (2012) Abramowski, A., Acero, F., Aharonian, F., et al. 2012, ApJ, 746, 151
- Ackermann et al. (2012) Ackermann, M., Ajello, M., Allafort, A., et al. 2012, Science, 338, 1190
- Actis et al. (2011) Actis, M., Agnetta, G., Aharonian, F., et al. 2011, Experimental Astronomy, 32, 193
- Aharonian et al. (2007) Aharonian, F., Akhperjanian, A. G., Bazer-Bachi, A. R., et al. 2007, ApJ, 664, L71
- Aleksić et al. (2011) Aleksić, J., Antonelli, L. A., Antoranz, P., et al. 2011, ApJ, 730, L8
- Barnacka (2013) Barnacka, A. 2013, ArXiv e-prints, arXiv:1307.4050
- Barnacka et al. (2014) Barnacka, A., Bottcher, M., & Sushch, I. 2014, ArXiv e-prints, arXiv:1404.4422
- Barnacka et al. (2011) Barnacka, A., Glicenstein, J.-F., & Moudden, Y. 2011, A&A, 528, L3
- Barnacka et al. (2013) Barnacka, A., Moderski, R., Behera, B., Brun, P., & Wagner, S. 2013, ArXiv e-prints, arXiv:1307.1779
- Begelman et al. (2008) Begelman, M. C., Fabian, A. C., & Rees, M. J. 2008, MNRAS, 384, L19
- Biggs et al. (1999) Biggs, A. D., Browne, I. W. A., Helbig, P., et al. 1999, MNRAS, 304, 349
- Biretta et al. (1999) Biretta, J. A., Sparks, W. B., & Macchetto, F. 1999, ApJ, 520, 621
- Blandford & Rees (1974) Blandford, R. D., & Rees, M. J. 1974, MNRAS, 169, 395
- Bolton et al. (2008) Bolton, A. S., Treu, T., Koopmans, L. V. E., et al. 2008, ApJ, 684, 248
- Böttcher et al. (2013) Böttcher, M., Reimer, A., Sweeney, K., & Prakash, A. 2013, ApJ, 768, 54
- Cheung et al. (2012) Cheung, C. C., Ojha, R., Orienti, M., & Wood, D. L. 2012, The Astronomer’s Telegram, 4411, 1
- Cheung et al. (2014) Cheung, C. C., Larsson, S., Scargle, J. D., et al. 2014, ApJ, 782, L14
- Ciprini (2010) Ciprini, S. 2010, The Astronomer’s Telegram, 2943, 1
- Ciprini (2012) —. 2012, The Astronomer’s Telegram, 4158, 1
- Cohen et al. (2000) Cohen, A. S., Hewitt, J. N., Moore, C. B., & Haarsma, D. B. 2000, ApJ, 545, 578
- Congdon et al. (2007) Congdon, A. B., Keeton, C. R., & Osmer, S. J. 2007, MNRAS, 376, 263
- Dalal & Kochanek (2002) Dalal, N., & Kochanek, C. S. 2002, ApJ, 572, 25
- Dondi & Ghisellini (1995) Dondi, L., & Ghisellini, G. 1995, MNRAS, 273, 583
- Elvis (2000) Elvis, M. 2000, ApJ, 545, 63
- Fadely & Keeton (2012) Fadely, R., & Keeton, C. R. 2012, MNRAS, 419, 936
- Fukugita et al. (1992) Fukugita, M., Futamase, T., Kasai, M., & Turner, E. L. 1992, ApJ, 393, 3
- Gaidos et al. (1996) Gaidos, J. A., Akerlof, C. W., Biller, S., et al. 1996, Nature, 383, 319
- Godfrey et al. (2012) Godfrey, L. E. H., Bicknell, G. V., Lovell, J. E. J., et al. 2012, ApJ, 755, 174
- Harris et al. (2003) Harris, D. E., Biretta, J. A., Junor, W., et al. 2003, ApJ, 586, L41
- Harris et al. (2006) Harris, D. E., Cheung, C. C., Biretta, J. A., et al. 2006, ApJ, 640, 211
- Harris et al. (2009) Harris, D. E., Cheung, C. C., Stawarz, Ł., Biretta, J. A., & Perlman, E. S. 2009, ApJ, 699, 305
- Harris & Krawczynski (2006) Harris, D. E., & Krawczynski, H. 2006, ARA&A, 44, 463
- Ivezić et al. (2002) Ivezić, Ž., Menou, K., Knapp, G. R., et al. 2002, AJ, 124, 2364
- Jackson et al. (2000) Jackson, N., Xanthopoulos, E., & Browne, I. W. A. 2000, MNRAS, 311, 389
- Jordán et al. (2005) Jordán, A., Côté, P., Blakeslee, J. P., et al. 2005, ApJ, 634, 1002
- Keeton et al. (1998) Keeton, C. R., Kochanek, C. S., & Falco, E. E. 1998, ApJ, 509, 561
- Keeton & Moustakas (2009) Keeton, C. R., & Moustakas, L. A. 2009, ApJ, 699, 1720
- Kimball & Ivezic (2014) Kimball, A., & Ivezic, Z. 2014, ArXiv e-prints, arXiv:1401.1535
- King et al. (1997) King, L. J., Browne, I. W. A., Muxlow, T. W. B., et al. 1997, MNRAS, 289, 450
- Kochanek (2004) Kochanek, C. S. 2004, ApJ, 605, 58
- Laporte et al. (2012) Laporte, N., Pelló, R., Hayes, M., et al. 2012, A&A, 542, L31
- Lovell et al. (1998) Lovell, J. E. J., Jauncey, D. L., Reynolds, J. E., et al. 1998, ApJ, 508, L51
- Madrid et al. (2007) Madrid, J. P., Sparks, W. B., Harris, D. E., et al. 2007, Ap&SS, 311, 329
- Marscher et al. (2008) Marscher, A. P., Jorstad, S. G., D’Arcangelo, F. D., et al. 2008, Nature, 452, 966
- Marshall et al. (2001) Marshall, H. L., Harris, D. E., Grimes, J. P., et al. 2001, ApJ, 549, L167
- Martí-Vidal et al. (2013) Martí-Vidal, I., Muller, S., Combes, F., et al. 2013, A&A, 558, A123
- Massaro et al. (2011) Massaro, F., Harris, D. E., & Cheung, C. C. 2011, ApJS, 197, 24
- Massaro et al. (2012) Massaro, F., Tremblay, G. R., Harris, D. E., et al. 2012, ApJS, 203, 31
- McKean et al. (2007) McKean, J. P., Koopmans, L. V. E., Flack, C. E., et al. 2007, MNRAS, 378, 109
- Metcalf & Zhao (2002) Metcalf, R. B., & Zhao, H. 2002, ApJ, 567, L5
- Morgan et al. (2010) Morgan, C. W., Kochanek, C. S., Morgan, N. D., & Falco, E. E. 2010, ApJ, 712, 1129
- Mücke et al. (2003) Mücke, A., Protheroe, R. J., Engel, R., Rachen, J. P., & Stanev, T. 2003, Astroparticle Physics, 18, 593
- Nalewajko et al. (2012) Nalewajko, K., Begelman, M. C., Cerutti, B., Uzdensky, D. A., & Sikora, M. 2012, MNRAS, 425, 2519
- Narayan & Bartelmann (1996) Narayan, R., & Bartelmann, M. 1996, ArXiv Astrophysics e-prints, astro-ph/9606001
- Narayan & Wallington (1993) Narayan, R., & Wallington, S. 1993, in Liege International Astrophysical Colloquia, Vol. 31, Liege International Astrophysical Colloquia, ed. J. Surdej, D. Fraipont-Caro, E. Gosset, S. Refsdal, & M. Remy, 217
- Nolan et al. (2012) Nolan, P. L., Abdo, A. A., Ackermann, M., et al. 2012, ApJS, 199, 31
- O’Dea et al. (1992) O’Dea, C. P., Baum, S. A., Stanghellini, C., et al. 1992, AJ, 104, 1320
- Oshima et al. (2001) Oshima, T., Mitsuda, K., Ota, N., et al. 2001, ApJ, 551, 929
- Patnaik et al. (1995) Patnaik, A. R., Porcas, R. W., & Browne, I. W. A. 1995, MNRAS, 274, L5
- Peterson (1993) Peterson, B. M. 1993, PASP, 105, 247
- Peterson (2001) Peterson, B. M. 2001, in Advanced Lectures on the Starburst-AGN, ed. I. Aretxaga, D. Kunth, & R. Mújica, 3
- Planck Collaboration et al. (2013) Planck Collaboration, Ade, P. A. R., Aghanim, N., et al. 2013, ArXiv e-prints, arXiv:1303.5076
- Postman et al. (2012) Postman, M., Coe, D., Benítez, N., et al. 2012, ApJS, 199, 25
- Pushkarev et al. (2010) Pushkarev, A. B., Kovalev, Y. Y., & Lister, M. L. 2010, ApJ, 722, L7
- Rees (1966) Rees, M. J. 1966, Nature, 211, 468
- Reimer et al. (2004) Reimer, A., Protheroe, R. J., & Donea, A.-C. 2004, A&A, 419, 89
- Savolainen et al. (2010) Savolainen, T., Homan, D. C., Hovatta, T., et al. 2010, A&A, 512, A24
- Sbarrato et al. (2011) Sbarrato, T., Foschini, L., Ghisellini, G., & Tavecchio, F. 2011, Advances in Space Research, 48, 998
- Schechter et al. (2003) Schechter, P. L., Udalski, A., Szymański, M., et al. 2003, ApJ, 584, 657
- Schneider et al. (1992) Schneider, P., Ehlers, J., & Falco, E. E. 1992, Gravitational Lenses (Springer-Verlag Berlin Heidelberg New York)
- Siemiginowska et al. (2002) Siemiginowska, A., Bechtold, J., Aldcroft, T. L., et al. 2002, ApJ, 570, 543
- Stanek et al. (1993) Stanek, K. Z., Paczynski, B., & Goodman, J. 1993, ApJ, 413, L7
- Stawarz et al. (2006) Stawarz, Ł., Aharonian, F., Kataoka, J., et al. 2006, MNRAS, 370, 981
- Stawarz et al. (2005) Stawarz, Ł., Siemiginowska, A., Ostrowski, M., & Sikora, M. 2005, ApJ, 626, 120
- Tavecchio et al. (2007) Tavecchio, F., Maraschi, L., Wolter, A., et al. 2007, ApJ, 662, 900
- Turner et al. (1984) Turner, E. L., Ostriker, J. P., & Gott, III, J. R. 1984, ApJ, 284, 1
- Urry & Padovani (1995) Urry, C. M., & Padovani, P. 1995, PASP, 107, 803
- Weekes et al. (2002) Weekes, T. C., Badran, H., Biller, S. D., et al. 2002, Astroparticle Physics, 17, 221
- Yuan et al. (2012) Yuan, T.-T., Kewley, L. J., Swinbank, A. M., & Richard, J. 2012, ApJ, 759, 66