A search for periodicities from a ULX in the LINER galaxy NGC 4736
Abstract
We report our findings on a new quasi-periodic oscillation (QPO) and a long period from the ultraluminous X-ray source (ULX) X-2 in nearby galaxy NGC 4736 based on the Chandra and XMM-Newton archival data. To examine the timing properties, power density spectra of the source have been obtained using Fast Fourier Transform. Also the spectral parameters of the source have been calculated by obtaining and fitting the energy spectra. Power density spectrum of this source reveals a QPO peak at mHz with an fractional rms variability of using the Chandra data (in the year 2000-lower state of the source). The XMM-Newton data analysis indicates a peak at mHz with a fractional rms variation of (in the year 2006-higher state of the source). These recovered QPOs overlap within errors and may be the same oscillation. In addition, we detect a long periodicity or a QPO in the Chandra data of about Hz ( 5.4 hrs) over 3 confidence level. If this is a QPO, it is the lowest QPO detected from a ULX. The mass of the compact object in ULX X-2 is estimated using the Eddington luminosity and a disk blackbody model in the range (1080) M☉.
Keywords galaxies: individual (NGC 4736) – X-rays: binaries – stars: oscillations – black hole physics
1 Introduction
Ultraluminous X-ray sources (ULXs) are off-nuclear point-like sources that have X-ray luminosities ( erg ) above the Eddington limit of a 20 black hole (BH) (Feng & Soria 2011). Although the true nature of these objects is not clear, current models propose several alternatives to explain their high luminosities: It could either be due to the geometric beaming if ULXs are powered by an accreting stellar black hole (King et al. 2001) or the super-Eddington fluxes originating from disks (Begelman 2002). Additionally, some ULXs could be powered by intermediate-mass black holes (Miller & Colbert 2004).
X-ray spectral and temporal analyses allow us to study the nature of ULXs and to constrain BH masses in ULXs (Soria & Ghosh 2009). Quasi-Periodic Oscillations (QPOs) in X-ray binaries provide information about the inner accretion disk structure around the compact object (Mucciarelli et al. 2006). Up to now, QPOs have been detected from a few ULXs in nearby galaxies. The first ULX (X-1) that showed strong evidence for a QPO was in M82 (Strohmayer & Mushotzky 2003). Using a 30 ks XMM-Newton observation they found that the power-density spectrum (PDS) of this source shows a prominent QPO peak at a frequency of 54 mHz with an integrated rms of 8.5% in the (210) keV. They also determined a 107 mHz QPO from the same ULX using archived RXTE observations. Based on the Schwarzschild geometry, they calculated the mass of the BH in source X-1 as <1.87 using the highest QPO frequency. In the other studies using the XMM-Newton and RXTE observations similar properties were detected for the ULX in M82 (Mucciarelli et al. 2006, Feng & Kaaret 2007). Also, Feng et al. (2010) reported QPOs at (34) mHz from a transient ULX (X42.3+59) in M82 using three Chandra and two XMM-Newton observations. They estimated the BH mass in the range of (1.24.3 in the ULX by scaling the QPO frequency to that of their type (A/B) of QPOs in stellar mass BHs. Liu et al. (2005) have presented the PDS of a ULX in NGC 628 (M74) showing a broad peak at a frequency range of (0.10.4) mHz in one XMM-Newton and two Chandra observations with an rms variation of 13.8% and 23.9% in (24) keV and (410) keV band, respectively. They estimated the mass of the compact object as (220) using the scaling relation between break frequency and BH masses. Another ULX (Holmberg IX X-1) which showed a QPO was detected in Holmberg IX, using a 119 ks XMM-Newton observation (Dewangan et al. 2006b). It has a centroid frequency of 202.5 mHz with an rms of 6% in the (0.210) keV energy band. However, Heil et al. (2009) reported that while the source Holmberg IX X-1 shows variability, it does not show a significant QPO feature. Strohmayer et al. (2007) found a ULX in NGC 5408 (X-1) which shows a pair of QPOs with a 4:3 ratio. The first peak is at 20 mHz and the second peak is at 15 mHz, at integrated rms of 9% from a 130 ks XMM-Newton observation. Considering this QPO is analogous to the ones in Galactic systems (for example GRO J1655-40), they found a BH mass range of (1.53.5) . Furthermore, using the mass-disk temperature scaling, , they also derived another mass range (1.814.74) . Pasham and Strohmayer (2012) also presented detailed study of NGC 5408 X-1 using recent XMM-Newton observations. They detected QPOs in the range of (1040) mHz with new observations. They also calculated a lower limit of on the mass of the BH in X-1 by scaling the minimum QPO frequency to a transition frequency of a reference stellar BH with known mass. Another ULX in nearby galaxy NGC 6946 shows possible QPO feature with a central frequency of 8.5 mHz (Rao et al. 2010). They calculated an integrated rms amplitude of 59% for X-1 in the (110) keV energy range and a BH mass of for the compact source by scaling the frequency with mass.
In the present work, we search the X-ray timing variations and spectral properties of the ULX X-2 in the LINER galaxy NGC 4736. The source is located in the disk of the galaxy. Akyuz et al. (2013) examined the long term light curves and energy spectrum of this source using XMM-Newton archival data revealing its transient nature. Previously, this source was detected as a point source using the Chandra archival data (Liu 2011) with no reference to its transient nature. A more recent study by Lin et al. (2013), also discusses the nature of the ULX X-2 using the ROSAT, XMM-Newton and Chandra archival data. They show highly variable dipping behaviour of the light curve in the brightest observations and discuss spectral properties in the dipping periods. They also examine the HST images and identify a point-like red optical counterpart candidate. Considering the colors and the luminosities of this candidate, they suggest that it could be a G8 supergiant or a dwarf star in the globular cluster.
Differently from the Lin et al. (2013) work, we concentrate on the timing properties and search for periodicities from the ULX X-2. This paper organized as follows: The observations and methods used in data reductions are described in Sect. 2. The timing and spectral analysis are given in Sect. 3 and Sect. 4. Discussions on the QPOs and the BH mass estimations are given in Sect. 5.

2 Observations And Data Reduction
In this study we used the XMM-Newton and the Chandra archival observations which have the longest exposure for the analysis of X-2. The XMM-Newton observation was carried out on 2006 November 27 for 55 ks (ObsID 0404980101) and the Chandra ACIS-S observation was carried out on 2000 May 13 for 49.8 ks (ObsID 808). We excluded high background flarings from ObsID 0404980101 data set, which removed the last 17 ks of the observation. Additionally, we did search the shorter exposures (XMM-Newton ObsID 0094360701, Chandra ObsID 9553) as well however, there was no indication of significant QPOs or periodicities at any frequency.
Data reductions were performed using the SAS (Science Analysis Software) version 12.0 for XMM-Newton and the CIAO (Chandra Interactive Analysis of Observations) version 4.3 with the CALDB (Calibration Database) version 4.4.2 for Chandra. In XMM-Newton, the events corresponding to PATTERN 4 were selected with FLAG==0 option for the pn camera, PATTERN 12 were used for the MOS cameras. The events were extracted from a circular region of enclosing the centroid position of the source (R.A. = .6, Dec = ) in XMM-Newton. In the Chandra observation, X-2 was located in the ACIS-S3 (back-illuminated) chip. The events were extracted from a circular region of surrounding the centroid position of the source (R.A. = .6, Dec = .5) in Chandra. Background photons were extracted using a proper region from a location with no source contamination. Figure 1 shows the two background-subtracted light curves with 1000 s time bins for display purposes only. The light curves were calculated using lcmath and lcurve tasks within Xronos version 5.21 for the XMM-Newton pn and Chandra data. The same data used for timing analysis by extracting light curves of much higher time resolution is described in Sect. 3.
(a)
 (b)
(b)


3 Timing Analysis
For the XMM-Newton observation we used only the pn data (ObsID 0404980101) in timing analysis. To search the quasi periodicity for X-2 the light curve was sampled at 0.1 s for the PDS. A 2nd-order polynomial trend was removed from the light curve to clean the red noise in lower frequencies. Then the resultant light curve was divided into six intervals. The average PDS was obtained by calculating and averaging the power spectra for each interval using Xronos version 5.21. The PDS were normalized according to Miyamoto et al. (1991). Figure 2a shows the PDS in the (0.210) keV energy band and shows a QPO peak around at mHz (2.4 ) with an integrated rms of . The significance is calculated assuming SNR (in ) using the peak value (), the continuum value () and error of the peak value () (Balman 2010 and references therein). When determining the significance, the continuum value is calculated in the (0.1 2) mHz frequency range. To clarify that this is a real peak and not an instrumental or dither related artifact, we calculated the PDS of the other sources in the field close by as well as the background and confirmed that there are no similar peaks. Additionally, we carefully repeated the PDS analysis taking care of existing data gaps in the XMM-Newton data. In order to do this we derived light curve for each GTI and calculated the PDS by combining them. We were not able to identify any fake QPO peaks that would result from such gaps. We fitted the XMM-Newton PDS using a constant frequency model for the flat noise component plus a Lorentzian component for the QPO. Our best fitting composite model has a QPO centroid frequency of = mHz with a width of = mHz. This yields . The constant model component which represents the continuum value in the PDS has a value of 9 (rms/mean)2/Hz. Moreover, we obtained the Leahy-normalized PDS (Leahy et al. 1983) for comparison and we found the same frequency value and significance level for the QPO.
We also did the same analysis for the Chandra (ObsID 808) data. The light curve was sampled at 1 s for the PDS (frame time of this observation is 0.84104 s). The resultant time series were divided into seven intervals and the individual PDS were averaged. Figure 2b shows the PDS for the Chandra in the (0.210) keV range. We find a QPO peak around at mHz (2.5 ) with an integrated rms of . The significance is calculated in the same manner as in the XMM-Newton analysis, except the continuum value is calculated in the (0.22) mHz frequency range for this data. We used the same method as in the XMM-Newton analysis to rule out any dither, observational or instrumental related peaks from our detected QPO of which we did not find any. We fitted the PDS using the same composite model (Lorentzian plus a constant). Our best fitting model has a QPO centroid frequency of = mHz with a width of = mHz () and a constant model value of 336 (rms/mean)2/Hz.
In addition, we detected a possible periodic oscillation or another QPO around Hz (5.4 hrs) above 3 confidence level using the Chandra observation (ObsID 808). Figure 3 shows the PDS obtained from a single Fast Fourier Transform (FFT). The PDS is normalized according to Leahy et al. (1983) and the three sigma detection level is above a power of 32 (calculated according to van der Klis 1989). We fitted the PDS using a Lorentzian plus a constant model. The best fitting model has a centroid frequency of = Hz with a width of = Hz and a constant noise level of 2.22. The 50 ks time span of the data can be used to calculate for the detected frequency yielding Hz. We could not look for this frequency in the XMM-Newton data since the removal of flares reduced the exposure/time span and such low frequencies were not revealed.
4 Spectral Analysis
XMM-Newton (ObsID 0404980101) and Chandra (ObsID 808) observations provide sufficient statistics for spectral analysis. To improve statistics for XMM-Newton analysis both pn and MOS data were used. All spectra were grouped to at least 20 counts per bin and analysed using XSPEC version 12.5.
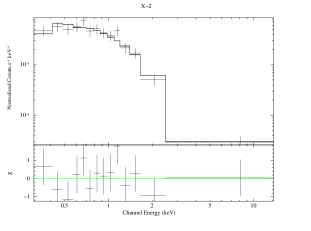
Spectral analyses reveal that the source spectrum is best fitted by a composite model of a power-law plus a disk blackbody (PL+DISKBB) ( 1.7, =0.75 keV) using the XMM-Newton data and one-component model of a power-law (PL) ( ) using the Chandra data. The best fitted model parameters with the XMM-Newton pn, MOS and the Chandra ACIS-S data are given in Table 1. Model parameters of XMM-Newton data are taken from Akyuz et al. (2013). They already performed a more detailed spectral modelling and short/long-term timing variability. As a result of these analyses they conclude that X-2 possesses a transient nature. In the table, the flux values represent the unabsorbed fluxes and have been calculated for (0.310) keV band. The source is 20 times brighter in XMM-Newton than in Chandra observation, strongly indicating time variability. Chandra energy spectrum of X-2 is given in Figure 4. XMM-Newton energy spectrum of this source can be seen in Figure 11 of Akyuz et al. (2013).
| () | kT | KPLbbNormalization parameter of the PL model in units of photon cm-2 s-1 keV-1 at 1 keV. | KDccNormalization parameter of the DISKBB model. KD = , where Rin is the inner disk radius, D is the distance to the source and is the angle of the disk. | /dof | FddUnabsorbed flux in the (0.310) keV energy band.() | LeeThese values have been calculated using a distance of 4.3 Mpc (Winter et al. 2006).() | ||
|---|---|---|---|---|---|---|---|---|
| keV | () | erg | erg | |||||
| XMM-NewtonaaXMM-Newton model parameters were taken from Akyuz et al. (2013). | 530.81/517 | 7.57 | 16.73 | |||||
| Chandra | - | - | 8.27/11 | 0.37 | 0.85 |
Note: Spectral models are PL+DISKBB for XMM-Newton and PL for Chandra.
5 Discussion And Summary
In this work, we have presented the energy and power spectra of the ULX X-2 in NGC 4736 using archival Chandra and XMM-Newton observations.
Chandra observation of the source revealed a QPO with a centroid frequency of mHz (with an integrated rms fractional variability of and ) while the XMM-Newton observation showed a QPO at mHz (with an integrated rms of and a ). The two frequencies overlap within their error limits, thus these could be either slightly differing QPOs or the same QPO from the system. It is consistent that the low frequency QPO has diminished in rms percent variability when the source changed to a higher luminosity state with the outer parts of the disk being more stable to variations. It is expected that in high states of BH LMXBs low frequency QPOs are suppressed.
The energy spectrum for the Chandra observation shows a best fit with a power-law model ( ). The XMM-Newton spectrum is best fitted with a two-component model, the disk blackbody plus power-law (=0.7 keV, 1.7) as published earlier by Akyuz et al. (2013). Our analysis showed that the source luminosity has changed by a factor 20 times between two observations. There are also couple of transient ULXs that exhibits decrease in luminosity below the ULX regime: CXOM31 J004253.1+411422 in M31 (Kaur et al. 2012), ULX in M83 (Soria et al. 2012), 1RXH J132519.8-430312 and CXOU J132518.2-430304 in NGC 5128 (Burke et al. 2013). The level of change in luminosity of the source is not well-known since the source was observed only four times within eight years. Its spectral shape has changed from a one-component model of a PL to a two-component model of PL+DISKBB where the disk component contributed and the power-law component yielded the rest of the total flux. This indicates that X-2 may be in a spectral state analogous to the thermal state of Galactic BH X-ray binaries (Remillard & McClintock 2006) during the XMM-Newton observation. The source has a steep PL photon index as calculated from the Chandra observation with a lower luminosity than the thermal state. However, the steep power law state of Galactic BH X-ray binaries is characterized by a relatively high luminosity with a PL component of (Remillard & McClintock 2006). The ULX X-2 exhibits opposite behaviour, however a similar unusual low/soft state has also been observed from ULX X-2 in NGC 1313 (Feng & Kaaret 2006). This unusual behaviour may arise from the lack of good statistics in the Chandra data. On the other hand, Lin et al. (2013) also carried out spectral analysis of X-2 using one ROSAT, one XMM-Newton and two Chandra observations. Their best-fitting spectral models, PL model in the Chandra (ObsID 808) and PL+MCD model in the XMM-Newton (ObsID 0404980101) data, and the derived spectral parameters are in agreement with ours. They noticed that the source might be in the hard state instead of the steep power-law, if one takes into account the large uncertainty of PL photon index () due to the poor quality of the data.
The mass of the BH in ULX systems can be calculated using the relation M= 2190/ (van der Klis 2006). This is based on the assumption that the QPO frequencies are associated with the Keplerian frequency at the innermost circular orbit around a Schwarzschild BH. The formula yields a mass value of for X-2, which is rather high for even an intermediate BH. Another approach is to consider the inverse proportionality between the BH mass and the QPO frequencies, and how this scales over different systems. Dewangan et al. (2006a) used this proportionality for ULX X-1 in M82 and found the mass of the BH to be in the range of (25520). We used the same scaling argument to approximate the mass of the BH in X-2 of NGC 4736. We chose the ULX in NGC 628 for the scaling since the detected QPOs have similar low frequencies and luminosities ( erg s-1, Liu et al. 2005). Also, this source is one of the ULX which have the lowest QPO frequency ever detected. Using this scaling argument and assuming the mass ( ) and QPO frequencies ( Hz) of the ULX in NGC 628 (Liu et al. 2005), we estimated a BH mass of for the compact source in X-2. However, we note that some ULXs have low luminosities and they were estimated to have stellar/massive-stellar () BHs (Kaur et al. 2012; Soria et al. 2012).
On the other hand, the possible mass for the compact object in X-2 can be estimated assuming the source emits at the Eddington limit. The BH mass of 10 is found by using the highest luminosity value (1.71039 erg s-1) with this assumption. Also considering the dominant contribution from the disk and the disk component model parameter, the inner disk radius can be derived as 96 km. Then, an upper limit for the compact source mass is estimated as 80 in X-2 using the inner disk radius (Makishima et al. 2000). Considering this mass range of (1080) , the compact source in X-2 is probably a stellar mass BH () or a massive-stellar BH ()(Feng & Soria 2011).
In addition, we have detected a long periodicity of Hz (5.4 hrs) above 3 confidence level in the low state of the source. We speculate that this may be another low frequency QPO from the system that may possibly be consistent with an intermediate mass BH scenario owing to the plausible large size disk. In such a case, this may be the lowest QPO detected from a ULX. However, it is also possible that this is the orbital period of the underlying binary which, then, it will be more consistent with a stellar/massive-stellar size BH. We note that the source shows low and high states of luminosity and there is not enough data on the source to conclusively decide whether it belongs to XRB class or a ULX classification.
We encourage further monitoring X-ray observations of X-2 in the nearby galaxy NGC 4736 to understand its true physical parameters and characteristics. In addition, these should be aided with observations in the other wavelength ranges (optical, IR, radio), as well.
Acknowledgements
The authors thank an anonymous referee for the critical reading of the manuscript which helped to improve the paper. The authors also thank M. E. Ozel for his very valuable comments. The authors acknowledge support from the Scientific and Technical Research Council of Turkey (TUBITAK) through project No. 113F039.
References
- Akyuz et al. (2013) Akyuz, A., Kayaci, S., Avdan, H., et al.: Astron. J., 145, 67 (2013)
- Balman (2010) Balman, S.: Mon. Not. R. Astron. Soc., 407, 1895 (2010)
- Begelman (2002) Begelman, M. C.: Astrophys. J., 568, L97 (2002)
- Burke (2013) Burke, M. J., Kraft, R. P., Soria, R., et al.: Astrophys. J., 775, 21 (2013)
- Dewangan et al. (2006a) Dewangan, G. C., Titarchuk, L., & Griffiths, R. E.: Astrophys. J., 637, L21 (2006a)
- Dewangan et al. (2006b) Dewangan, G. C., Griffiths, R. E., & Rao, A. R.: Astrophys. J., 641, L125 (2006b)
- Feng & Kaaret (2006) Feng, H., & Kaaret, P.: Astrophys. J., 650, L75 (2006)
- Feng & Kaaret (2007) Feng, H., & Kaaret, P.: Astrophys. J., 668, 941 (2007)
- Feng et al. (2010) Feng, H., Rao, F., & Kaaret, P.: Astrophys. J., 710, L137 (2010)
- Feng (2011) Feng, H., & Soria, R.: New Astron. Rev., 55, 166 (2011)
- Heil et al. (2009) Heil, L. M., Vaughan, S., & Roberts, T. P.: Mon. Not. R. Astron. Soc., 397, 1061 (2009)
- Kaur et al. (2012) Kaur, A., Henze, M., Haberl, F., et al.: Astron. Astrophys., 538, 49 (2012)
- King et al. (2001) King, A. R., Davies, M. N., Ward, M. J., Fabbiano, G., & Elvis, M.: Astrophys. J., 552, L109 (2001)
- Leahy et al. (1983) Leahy, D. A., Darbro, W., Elsner, R. F., et al.: Astrophys. J., 266, 160 (1983)
- Lin et al. (2013) Lin, D., Irwin, J. A., Webb, N. A., Barret, D., & Remillard, R. A.: Astrophys. J., 779, 149 (2013)
- Liu et al. (2005) Liu, J., Bregman, J. N., Lloyd-Davies, E., et al.: Astrophys. J., 621, L17 (2005)
- Liu (2011) Liu, J.: Astrophys. J., 192, 10L (2011)
- Miller (2004) Miller, R., & Colbert, E. J.: Int. J. Mod. Phys. D, 13, 1 (2004)
- Miyamoto (1991) Miyamoto, S., Kimura, K., Kitamoto, S., Dotani, T., & Ebisawa, K.: Astrophys. J., 383, 784 (1991)
- Mucciarelli et al. (2006) Mucciarelli, P., Casella, P., Belloni, T., Zampieri, L., & Ranalli, P.: Mon. Not. R. Astron. Soc., 365, 1123 (2006)
- Pasham (2012) Pasham, D. R., & Strohmayer, T. E.: Astrophys. J., 753, 139 (2012)
- Rao et al. (2010) Rao, F., Feng, H., & Kaaret, P.: Astrophys. J., 722, 620 (2010)
- Remillard (2006) Remillard, R. A. & McClintock, J. E.: Annu. Rev. Astron. Astrophys., 44, 49 (2006)
- Soria (2009) Soria, R., & Ghosh, K. K.: Astrophys. J., 696, 287 (2009)
- Soria (2012) Soria, R., Kuntz, K. D., Winkler, P. F., et al.: Astrophys. J., 750, 152 (2012)
- Strohmayer & Mushotzky (2003) Strohmayer, T. E., & Mushotzky, R. F.: Astrophys. J., 586, L61 (2003)
- Strohmayer et al. (2007) Strohmayer, T. E., Mushotzky, R. F., Winter, L., et al.: Astrophys. J., 660, 580 (2007)
- van der Klis (1989) van der Klis, M.: In: Ogelman, H., van den Heuvel, E.P.J. (eds) Timing Neutron Stars, p.27. Kluwer Academic, Dordrecht (1989)
- van der Klis et al. (2006) van der Klis, M.: In: Lewin, W.H.G., van der Klis, M. (eds) Compact Stellar X-ray Sources, Cambridge University Press, Cambridge (2006)
- winter et al. (2006) Winter, L. M., Mushotzky, R. F., & Reynolds, C. S.: Astrophys. J., 649, 730 (2006)