Influence of the single-particle structure on the nuclear surface and the neutron skin
Abstract
We analyze the influence of the single-particle structure on the neutron density distribution and the neutron skin in Ca, Ni, Zr, Sn, and Pb isotopes. The nucleon density distributions are calculated in the Hartree-Fock+BCS approach with the SLy4 Skyrme force. A close correlation is found between the quantum numbers of the valence neutrons and the changes in the position and the diffuseness of the nuclear surface, which in turn affect the neutron skin thickness. Neutrons in the valence orbitals with low principal quantum number and high angular momentum mainly displace the position of the neutron surface outwards, while neutrons with high principal quantum number and low angular momentum basically increase the diffuseness of the neutron surface. The impact of the valence shell neutrons on the tail of the neutron density distribution is discussed.
pacs:
21.10.Gv, 21.60.JzI Introduction
The spatial distribution of nucleons inside a nucleus is one of the most basic topics in nuclear physics. The density distribution of protons is quite well mapped from the numerous experiments of elastic electron-nucleus and muon-nucleus scattering Fricke et al. (1995); Vries et al. (1987) and the charge radii of many nuclei are known with uncertainties well below 1% Angeli and Marinova (2013). Neutrons, as neutral particles, are much harder to resolve and knowledge about their spatial layout in a nucleus is still limited. Until now, neutron radii have been measured in less than thirty isotopes and the experimental neutron density distribution is known only in a few nuclei with relatively large error bars G. W. Hoffmann et al., Phys. Rev. C 21, 1488 () (1980); B. C. Clark, L. J. Kerr, and S. Hama, Phys. Rev. C 67, 054605 () (2003); Batty et al. (1995); Krasznahorkay et al. (2004); A. Trzcińska, J. Jastrzȩbski, P. Lubiński, F. J. Hartmann, R. Schmidt, T. von Egidy, and B. Kłos, Phys. Rev. Lett. 87, 082501 () (2001); Jastrzȩbski et al. (2004); Kłos et al. (2007); A. Klimkiewicz, et al., Acta Phys. Pol. B 40, 589 () (2009); Zenihiro et al. (2010). Thus, information about the layout of neutrons inside a nucleus often comes only from the theoretical predictions at present. However, the new experimental advances in techniques such as elastic proton scattering Zenihiro et al. (2010) and coherent pion photoproduction from nuclei D. P. Watts for the CrystalBall@MAMI Collaboration (2012); C.M. Tarbert et al. , arXiv:1311.0168() (2013), and the advent of parity-violating elastic electron scattering facilities Abrahamyan et al. (2012); Horowitz et al. (2014); Sfienti (2013), suggest that largely improved determinations of neutron radii and neutron density distributions may be possible in the near future.
Knowledge of neutron distributions is very important as it constitutes a necessary input in a wide range of problems in physics. It is strongly related to the isospin properties of nuclear forces and the nuclear symmetry energy Centelles et al. (2009); Warda et al. (2009); Chen et al. (2005); Furnstahl (2002); Kortelainen et al. (2013); Zhang and Chen (2013). The profile of the neutron density distribution is demanded as an input in the analysis of many scattering experiments. The arrangement of neutrons in nuclei is important for collective nuclear excitations Piekarewicz (2014); Colò et al. (2014), such as the giant dipole resonance Trippa et al. (2008); X. Roca-Maza et al., Phys. Rev. C 88, 024316 () (2013) and pygmy dipole resonance Klimkiewicz et al. (2007); Roca-Maza et al. (2012); Vretenar et al. (2012). Precise knowledge of the neutron skin thickness (NST), i.e., the difference between the neutron and proton root mean square (rms) radii:
| (1) |
is not only of interest in nuclear structure physics. This quantity is strongly correlated, within the realm of nuclear mean-field theories Alex Brown (2000); Typel and Brown (2001); Dieperink et al. (2003); S. S. Avancini, J. R. Marinelli, D. P. Menezes, M. M. W. Moraes, and C. Providência, Phys. Rev. C 75, 055805 .() (2007); Centelles et al. (2009, 2010); Roca-Maza et al. (2011); Viñas et al. (2014); Gaidarov et al. (2012), with the slope of the nuclear symmetry energy at saturation density and therefore may be used to constrain the equation of state of neutron-rich matter. Thus, the results of the investigation of the distribution of neutrons in atomic nuclei affect studies of such distant areas of physics as heavy-ion collisions Gaitanos et al. (2004); Shetty et al. (2007); Li et al. (2008); Tsang et al. (2009), scattering of polarized electrons on nuclei Vretenar et al. (2000); Horowitz et al. (2001); Roca-Maza et al. (2011); Abrahamyan et al. (2012); Moreno et al. (2010); J. Liu, Z. Ren, and T. Dong, Nucl. Phys. A 888, 45 ; Nucl. Phys. A 900, 1 (2013).() (2012); A. Meucci, M. Vorabbi, C. Giusti, F. D. Pacati, and P. Finelli, Phys. Rev. C 87, 054620 .() (2013), precision tests of the standard model by atomic parity violation D. Vretenar, G. A. Lalazissis, and P. Ring, Phys. Rev. C 62, 045502 .() (2000); Sil et al. (2005), and nuclear astrophysics C. J. Horowitz and J. Piekarewicz, Phys. Rev. Lett. 86, 5647 ; Phys. Rev. C 64, 062802 (2001).() (2001); Lattimer and Prakash (2004, 2007); C. Ducoin, J. Margueron, C. Providência, and I. Vidaña, Phys. Rev. C 83, 045810 .() (2011); Loan et al. (2011).
Theoretical predictions of neutron density distributions can be verified, in principle, by the comparison of the calculated values of the neutron rms radii and of the NST with the available experimental data. The uncertainties in the measured values leave much freedom for theoretical neutron density distributions Warda et al. (1998); Jastrzȩbski et al. (2004); A. Trzcińska, J. Jastrzȩbski, P. Lubiński, F. J. Hartmann, R. Schmidt, T. von Egidy, and B. Kłos, Phys. Rev. Lett. 87, 082501 () (2001); Jiang et al. (2007). Moreover, rms radii and the NST are general properties of the neutron density distribution; different density profiles (e.g. those calculated with various nuclear forces) may give the same values of the neutron rms radius and the NST Warda et al. (2010). Therefore, careful theoretical studies are required to understand the physics of nucleon distributions inside a nucleus. The main issues affecting the deviations of the NST from the picture of a smooth variation with the neutron excess of the nucleus are nuclear deformation Warda et al. (1998) and the quantum-mechanical properties of the nucleonic orbitals. In the present article we concentrate on the latter effect.
The basic features of the neutron skin of nuclei can be explained by the nuclear droplet model (DM) Myers and Świa̧tecki (1980); Świa̧tecki et al. (2005). The DM predicts that the NST grows on average linearly with the relative neutron excess , which was confirmed by the experimental data of Refs. A. Trzcińska, J. Jastrzȩbski, P. Lubiński, F. J. Hartmann, R. Schmidt, T. von Egidy, and B. Kłos, Phys. Rev. Lett. 87, 082501 () (2001); Jastrzȩbski et al. (2004). In the standard version of the DM the neutron and proton surface diffusenesses are assumed to be equal, although the influence of different surface diffusenesses between neutrons and protons was also investigated Świa̧tecki et al. (2005); Warda et al. (2009); Viñas et al. (2012). In particular, it has been shown that the surface contribution to the NST in nuclear mean-field models is not negligible Warda et al. (2009, 2010); Centelles et al. (2010); Viñas et al. (2012); Mizutori et al. (2000); indeed, self-consistent mean-field calculations predict in many neutron-rich isotopes twice thicker neutron than proton surface diffuseness. Moreover, abrupt changes of the surface diffuseness between isotopes may appear (see Figs. 7 and 8 of Ref. Warda et al. (2010)). It has been found that the surface of the neutron distribution is narrower in the doubly magic nuclei, whereas it extends over a wider region in the mid-shell nuclei. Such a behavior suggests that quantum shell effects impinge on the NST on top of the macroscopic DM predictions.
There is significant interest currently in the exploration of the properties of exotic nuclei as the radioactive ion beam facilities in laboratories worldwide are extending the nuclear landscape to new limits. We have devoted some effort in previous works Roca-Maza et al. (2008, 2013) to study the evolution of the nuclear charge density from stable to exotic nuclei, and its relation with the changes of the proton shell structure in isotopic and isotonic chains. In the present article we investigate the influence of the single-particle (sp) properties of the valence neutrons on the nuclear surface and the neutron skin of stable and unstable nuclei. We study several isotopic chains representative of different mass regions in order to examine the changes of the neutron skin when subsequent neutrons are added into particular orbitals. We analyze two mechanisms of generating the neutron skin. One of them arises from a displacement between the positions of the equivalent neutron and proton sharp surfaces (it is mostly a “bulk” effect). The other one is a consequence of different surface diffuseness between the neutron and proton density profiles (it is mostly a “surface” effect). To minimize the influence of deformation on the results Warda et al. (1998) it is helpful to choose nuclei with magic proton number, which are mostly spherical nuclei in their ground states. Hence, we take into consideration the Ca, Ni, Zr, Sn, and Pb elements. We focus our study mainly on the neutron-rich nuclei because the neutron skin is larger and more sensitive to isotopic effects there. We concentrate on the last full major shell (or shells) of the considered elements. In this way we examine the neutron skin in Ca and Ni from to , in Zr and Sn from to , in Sn between and , and in Pb from to . We start with the analysis of the Sn isotopes ranging from to 126 because the discussed sp properties are quite well magnified and easy to describe in this relatively long chain. After this illustrative example we study the other elements.
The structure of this article is the following. In Sec. II the basic ideas of our theoretical description of the NST are collected (an extended presentation can be found in Refs. Warda et al. (2010); Centelles et al. (2010)). The detailed analysis of the results for the NST in the Sn isotopes is presented in Sec. III. The other isotopic chains are discussed in Sec. IV. Finally, the conclusions are presented in Sec. V.
II Bulk and surface contributions to the neutron skin thickness
In our study we compute the density distributions of nucleons in even-even isotopes in self-consistent Hartree-Fock calculations using the SLy4 nuclear functional (Chabanat et al., 1998; *cha98a). SLy4 is a Skryme-type force that was developed with a focus on neutron-rich nuclei and the equation of state of neutron matter. It has been successfully applied in studies of a wide range of phenomena and it is known to describe reasonably well nuclear properties such as masses, deformations, nucleon separation energies, and radii along the periodic table J. Erler, N. Birge, M. Kortelainen, W. Nazarewicz, E. Olsen, A. M. Perhac, and M. Stoitsov, Nature 486, 509 .() (2012). Though the general features of the NST described in this paper are basically independent of the nuclear mean-field interaction used to compute them, the fine details can depend to a certain extent on the nuclear interaction. In our calculations we assume spherical symmetry for all considered nuclei (however, some of the Zr isotopes are known to be deformed in their ground state). We use a volume BCS pairing with pairing strengths MeV and MeV. The pairing window is taken to be above the Fermi level. To fit the pairing strengths we used as reference data the SLy4 results of the HFB+Lipkin-Nogami model of Ref. Stoitsov et al. (2003) for the binding energies of the mid-shell nuclei 116Sn for neutron pairing and 144Sm for proton pairing. The treatment of the continuum for neutron-rich nuclei close to the drip line is done following the prescription given in Del Estal et al. (2001). In this way the HFB energies reported in Ref. Stoitsov et al. (2003) are overall well reproduced from the proton to the neutron drip line. We find the two-neutron drip line of the elements considered in the present work at 68Ca, 78Ni, 122Zr, 176Sn, and 266Pb, which is the same result as in Ref. Stoitsov et al. (2003) excepting that the drip line nucleus 174Sn of Stoitsov et al. (2003) is shifted to 176Sn in our calculation.
To get a better grasp of the properties of the neutron skin it can be useful to fit the density profiles obtained in the self-consistent mean-field calculations by two-parameter Fermi (2pF) distributions Vries et al. (1987); R. W. Hasse and W. D. Myers, Geometrical relationships of macroscopic nuclear physics, Springer-Verlag, Heidelberg, 1988 :
| (2) |
where is the central density, is the half-density radius, and describes the surface diffuseness. As a result, one obtains numerically the two most important quantities characterizing the shape of the density profiles, namely the position and the thickness of the nuclear surface. Both of them are crucial for a proper determination of the NST, as the NST is defined through the rms radii and consequently it is very sensitive to the density profile at the surface. There is no unique prescription to parametrize a given density profile with a 2pF function. Following earlier works Warda et al. (2010); Centelles et al. (2010), we fit the , , and parameters to reproduce the quadratic and quartic moments of the neutron or proton density distribution, and the number of nucleons. It has been shown that this method reproduces with good accuracy the surface region of any realistic density profile given as an input Warda et al. (2010); Centelles et al. (2010).
The neutron skin can be easily understood assuming 2pF distributions for both neutrons and protons. Indeed, Fermi-type densities are common in the extraction of neutron skins from different experiments, as in the case of neutron skins deduced from exotic atoms A. Trzcińska, J. Jastrzȩbski, P. Lubiński, F. J. Hartmann, R. Schmidt, T. von Egidy, and B. Kłos, Phys. Rev. Lett. 87, 082501 () (2001); Friedman et al. (2005); E. Friedman, Hyperfine Interact. 193, 33 .() (2009) or from coherent pion photoproduction cross sections D. P. Watts for the CrystalBall@MAMI Collaboration (2012); C.M. Tarbert et al. , arXiv:1311.0168() (2013). Within the context of 2pF densities, it has become popular to discern two main scenarios for the neutron skin of nuclei. In the first scenario, the neutron skin is formed when the neutron half-density radius is larger than the proton half-density radius and the surface diffusenesses of neutrons and protons are the same (i.e., and ). Such 2pF density profiles are called a “skin” type distribution A. Trzcińska, J. Jastrzȩbski, P. Lubiński, F. J. Hartmann, R. Schmidt, T. von Egidy, and B. Kłos, Phys. Rev. Lett. 87, 082501 () (2001). The alternative scenario assumes that the differences between both density profiles are due to an enlarged neutron surface diffuseness with the same neutron and proton half-density radii (i.e., and ). The corresponding 2pF density profiles are called a “halo” type distribution A. Trzcińska, J. Jastrzȩbski, P. Lubiński, F. J. Hartmann, R. Schmidt, T. von Egidy, and B. Kłos, Phys. Rev. Lett. 87, 082501 () (2001). In general, both situations may coexist in a nucleus, simultaneously contributing to the NST Świa̧tecki et al. (2005); Centelles et al. (2009); Warda et al. (2009, 2010); Centelles et al. (2010).
Despite the simplicity of describing the density profiles through 2pF distributions, we have shown in previous papers Warda et al. (2010); Centelles et al. (2010) that the half-density radii and are not the most appropriate radii for extracting the bulk and surface contributions to the NST. Following Refs. Warda et al. (2010); Centelles et al. (2010) we introduce the bulk contribution as
| (3) |
where and are the neutron and proton equivalent sharp radii, respectively R. W. Hasse and W. D. Myers, Geometrical relationships of macroscopic nuclear physics, Springer-Verlag, Heidelberg, 1988 . The equivalent sharp radius corresponds to a sharp distribution with a uniform density, equal to the bulk value of the actual density, having the same number of particles R. W. Hasse and W. D. Myers, Geometrical relationships of macroscopic nuclear physics, Springer-Verlag, Heidelberg, 1988 . As it can be seen in Fig. 1 of Ref. Centelles et al. (2010) and Fig. 2 of Ref. Warda et al. (2010) (see also Ref. R. W. Hasse and W. D. Myers, Geometrical relationships of macroscopic nuclear physics, Springer-Verlag, Heidelberg, 1988 ), a sharp sphere with radius overestimates the original mean-field density in the whole nuclear interior, whereas a sharp density distribution with radius is able to reproduce properly the bulk part of the original density profile. Therefore, the sharp radius rather than the half-density radius is the suitable radius to describe the size of the bulk region of the nucleus R. W. Hasse and W. D. Myers, Geometrical relationships of macroscopic nuclear physics, Springer-Verlag, Heidelberg, 1988 ; Warda et al. (2010); Centelles et al. (2010).
It is possible to express in terms of the parameters and of the 2pF distributions R. W. Hasse and W. D. Myers, Geometrical relationships of macroscopic nuclear physics, Springer-Verlag, Heidelberg, 1988 ; Warda et al. (2010); Centelles et al. (2010), so that the bulk contribution to the NST given by Eq. (3) can be written also as
| (4) |
The remaining part of the NST is the surface contribution:
| (5) |
From Eqs. (4) and (5), it is clear that the difference between the half-density radii and can affect not only the bulk contribution but also the surface contribution to the NST. Similarly, the difference between the surface diffusenesses and of the 2pF profiles affects and also . In general, both the changes of the half-density radii and of the surface diffusenesses contribute simultaneously to the NST.
Although the measurements provide data of the total NST only, from the theoretical point of view it is interesting to analyze the separate contributions of the bulk and surface parts of the NST. Useful information about the nuclear surface can be obtained from such investigation. In the next sections we analyze how the bulk and the surface contributions change along the selected isotopic chains and how they are correlated with the sp properties of the valence neutrons.
III Neutron skin in the Sn isotopic chain for
The NST grows along the isotopic chain of a given element. The DM of Myers and Świa̧tecki W. D. Myers and W. J. Świa̧tecki, Ann. Phys. 55, 395 (1969); Ann. Phys. (N.Y.) 84, 186 (1974).() (N.Y.); W. D. Myers, Droplet Model of Atomic Nuclei () (Plenum, New York, 1977); Myers and Świa̧tecki (1980) explains this behavior as it predicts a faster linear increase with the relative neutron excess for the neutron rms radius than for the proton rms radius. The rate of increase of the NST with is related to the density dependence of the nuclear symmetry energy Centelles et al. (2009); Warda et al. (2009). Calculations with nuclear mean field models show that deviations from the linear growth with can be found in the NST Warda et al. (2010). It is easy to show that these deviations are connected with shell properties of nuclei. Indeed, the NST displays local minima for magic neutron numbers, whereas it exceeds the average trend for mid-shell isotopes (see Fig. 9 of Ref. Warda et al. (2010)). Therefore, to explain this non-linearity, we have to investigate the sp structure of nuclei. As a first example, we study neutron-rich Sn isotopes of the major shell ranging from to . The last isotope in this chain is the drip line nucleus.
III.1 Correlation of neutron skin properties with quantum numbers of valence neutrons
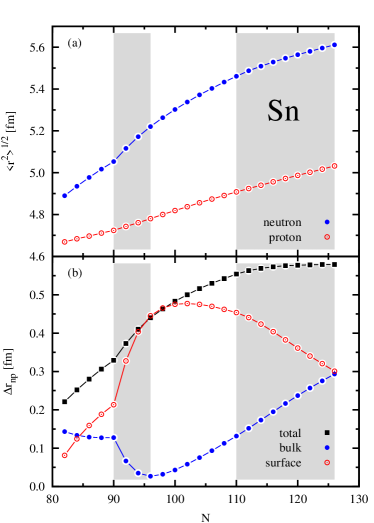
In Fig. 1(a) it is easy to see that both the neutron and the proton rms radii of Sn increase with increasing neutron number and that the slope for neutrons is larger than for protons, as predicted by the DM. The difference between the two curves of Fig. 1(a) is just the NST plotted in panel (b) of this figure. The proton radii show a rather linear dependence on the neutron number, whereas some departure from linearity is observed in the neutron radii. The same departure from linearity is therefore observed in the NST of the Sn isotopes. Similar properties have been found in Ref. Schunck and Egido (2008) where an alternative splitting of the mean square radius into geometrical and Helm radii is applied.
The bulk (3) and the surface (5) parts of the NST are also plotted in Fig. 1(b). The lack of linearity visible in the NST diagram is magnified in the individual plots of these contributions. Four intervals of neutron number, marked in Fig. 1 by white and grey stripes, can be easily distinguished in this plot. The first interval covers the region from to where the bulk part remains almost constant and the surface part increases roughly linearly. The second region, up to , is characterized by a fast increase of and, simultaneously, a decrease of . Next, up to , remains roughly constant around its maximal value reached at and rises almost linearly with . Finally, till the shell is completely filled up at the magic number , grows and decreases, both of them linearly.
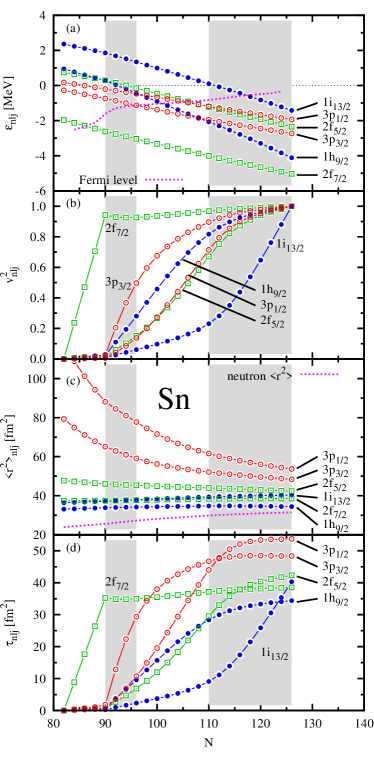
In order to explain the variations of the bulk and the surface contributions in the NST diagram, selected sp properties of the considered Sn isotopes are plotted in Fig. 2. First, the sp energies of the levels belonging to the major shell are shown in panel (a) and their occupancy in panel (b). The energy and the occupancy of these levels show a distinct behavior in each interval outlined above. In the first region, from up to , the lowest level is progressively populated with neutrons. Its occupancy grows from 0 to almost 1 while the other orbitals remain unoccupied due to the large energy gap, fairly over 1 MeV, that separates the level from the higher levels. The level crosses the Fermi level between and . Its occupancy increases faster in this region than the occupancy of the , , and orbitals which are slightly higher in energy. Next, from to , the four aforementioned levels are filled up when more neutrons are added to the Sn nuclei. At the occupancy of these orbitals ranges between 0.7 and 0.9 and in the heaviest isotopes they are almost fully occupied. The level, the highest in energy, behaves otherwise. Its occupancy grows slowly up to 0.2 at and then it rises much faster in the heavier isotopes, without a plateau at the shell closure at .
We can correlate the behavior of and with the principal quantum number and the orbital angular momentum of the orbitals occupied by the valence neutrons in the intervals shown in Fig. 1b. The type of orbitals laying in the vicinity of the Fermi level plays a crucial role in the determination of the neutron radii. When high-–low- levels within the shell are populated one observes an increase of , whereas low-–high- levels are more correlated with the growth of .
In the considered shell of the Sn isotopes, the two levels (displayed with red circles in Fig. 2) have an especially large impact on the results. At first look, it seems unexpected because only 6 neutrons out of 44 from the whole shell can occupy these two levels. To understand this effect, let us look at panel (c) of Fig. 2 where the mean square radius of each sp orbital, defined as:
| (6) |
is plotted for the valence shell neutrons. In Eq. (6), is the normalized wave function. Note that does not depend on the occupancy or on the multiplicity of the orbital. The mean square radii of the majority of the levels are in the range of fm2 for all Sn isotopes, which is less than twice the total mean square radii of these isotopes. However, the mean square radii of the levels are much larger. They reach values of fm2 when they start to be populated at and of fm2 in the heaviest isotopes. Such a huge value magnifies the contribution of a few neutrons to the neutron radius when these levels are occupied. To visualize this effect, in panel (d) of Fig. 2 we have plotted the quantity , defined as:
| (7) |
which describes the contribution of a single neutron to the total value of the neutron mean square radius . Thus we may write the neutron mean square radius as
| (8) |
where is the neutron number of the isotope.
In Fig. 2(d) we see that roughly follows the pattern of . Nevertheless, the values of the orbitals show a different behavior. They are magnified in comparison to the other levels. For example, for the orbital has the same impact on the neutron radius as the orbital, despite their occupancies being respectively 0.6 and 0.9. Neutrons from the fully occupied levels have larger values than the other orbitals of the valence shell. Due to the large value of the levels, neutrons from these orbitals have a very strong impact on the neutron radius.
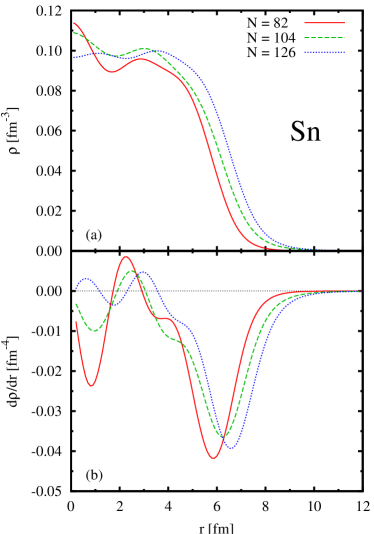
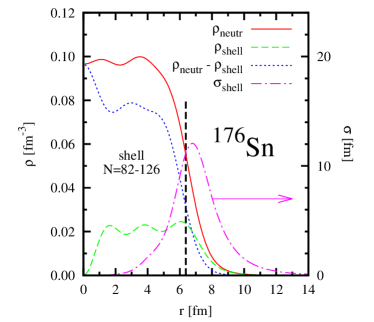
From the knowledge of the impact of particular orbitals on the structure of the neutron surface, we can now explain the curvature of the diagrams in Fig. 1. In the first half of the shell, neutrons occupy mainly transitional (such as ) or high-–low- (such as ) orbitals. They give an additional increase of the surface diffuseness of the neutron distribution. This can be seen in Fig. 3, where we compare the neutron density profile and its derivative of the magic nucleus 132Sn with the mid-shell isotope 154Sn. It is clear that in 154Sn the surface diffuseness is larger and that the slope of the surface fall-off is smaller. In the second half of the shell, the influence of the low-–high- level gives the opposite effect of decreasing the surface diffuseness. In the particular example of the isotopes 132Sn, 154Sn, and 176Sn we have found that takes values 0.526 fm, 0.815 fm and 0.720 fm, respectively. Thus, the neutron density profile of 176Sn, also plotted in Fig. 3, has a larger slope of the density distribution at the surface than in 154Sn.
At this stage, let us summarize the above observations for the sake of clarity. The comparison of Figs. 1(b) and 2(d) unravels a correlation between the changes in the isotopic shift of the NST and the sp spectrum of the orbitals in the considered shell. When high-–low- orbitals are populated (e.g. between and 96), a rapid increase of the surface contribution to the NST of a nucleus can be noticed. It is manifested by an additional increase of the NST. Conversely, when levels with low-–high- quantum numbers are being occupied (e.g. above ), the bulk contribution increases while decreases. Population of orbitals with intermediate principal quantum number and angular momentum (such as the orbital below ) supports both the contributions to the NST. When several types of levels are filled simultaneously () we see a combination of both effects.
III.2 Single-particle neutron density distributions
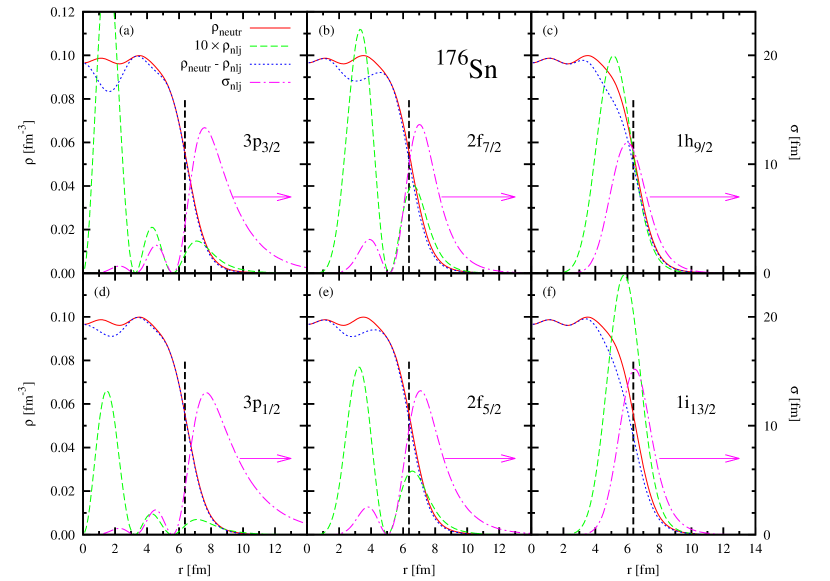
In order to find the source of the correlation described in the previous subsection, we have to investigate the spatial distribution of the neutrons from each particular orbital. In Fig. 4 we analyze the neutron distribution of 176Sn, i.e., the heaviest isotope in the considered shell with all occupied orbitals. We compare the total neutron density distribution, plotted with solid lines, with the density distributions of neutrons from each level of the valence shell (dashed lines) defined as:
| (9) |
Indeed, the sp mean square radii defined in Eq. (6) can be expressed for fully occupied orbitals () through as:
| (10) |
The difference between the total density and the density of each orbital is also plotted in Fig. 4 with the dotted line. In this way we find how neutrons from each level of the last shell modify the total neutron density profile and how they affect the neutron surface. The behavior of the sp density distribution of each orbital is consistent with the basic quantum mechanical properties of the nuclear orbitals.
The main contribution of the levels to the total density (left panels of Fig. 4) is due to the innermost bump of their sp densities which is located in the interior of the nucleus at distances below 3 fm from the center. The two outer bumps of the density of the orbitals contribute much less to the total neutron density. In the central panels of Fig. 4 we can see that the inner bump of the orbitals is peaked at fm. It also mainly contributes to the bulk region of the total density. The outer bump of the orbitals, located at the surface, is much smaller. In contrast, neutrons from orbitals (right panels of Fig. 4) practically do not contribute to the total density at distances below 2 fm from the center. The single peak of their density distribution is localized in the surface region with the maximum at fm. It can be seen that the orbitals and modify the density distribution by shifting the whole surface outside and enlarging the half-density radius.
The analysis of just the density profile may not be enough when mean square (ms) or rms radii are treated as a measure of the nuclear size. In the integral defining the mean square radii of spherical nuclei, the nuclear density is weighted by the fourth power of the distance from the center:
| (11) |
The sub-integral function in this expression is peaked at the nuclear surface. Therefore is much more sensitive to the shape of density profile at the surface than to the nuclear bulk density. To check the contribution of the neutrons in each sp level to the mean square radii we have to examine the sp densities multiplied by . Therefore, in Fig. 4 (vertical scale on the right) we have also plotted the function (dash-dotted line) defined as:
| (12) |
This function is the contribution of a single neutron in the orbital to the mean square neutron radius that for a spherically symmetric nucleus reads:
| (13) |
Notice that the function is related to the number, introduced before in Eq. (7), by
| (14) |
As expected, the function for all neutron orbitals is concentrated at the surface and vanishes in the nuclear interior. The inner bumps of in the and orbitals, unlike , are strongly damped in comparison with the other bumps. Some important differences can be observed in the spatial distribution of between the various types of orbitals. In the levels, the outermost bump of is peaked in the tail of the neutron density distribution, around 1.5 fm far from the half-density radius (indicated in Fig. 4 by the black dashed vertical line). Almost the whole contribution of to in the levels comes from the region outside . The values of are significant even at large distances beyond the nuclear surface where the neutron density is negligible. Thus, the two levels enlarge the neutron rms radius mainly by modifying the surface diffuseness.
In the transitional levels the maximum of is located less than 1 fm outside . Both the surface region and the tail of the density contribute to the function . The influence of the orbitals on the neutron skin is more ambiguous than in the case of the orbitals because they simultaneously contribute to the surface part and to the bulk part of the NST.
The function of the low-–high- neutrons ( and ) has a single bump with a maximum in the vicinity of the half-density radius . It is distributed rather symmetrically around and does not extend to larges distances. Neutrons from these orbitals almost do not modify the surface diffuseness , but increase the half-density radius . As a consequence, the surface contribution to the neutron skin diminishes and the bulk part increases substantially.
In Fig. 5 we have plotted for 176Sn the same functions as in Fig. 4 but for all neutrons from the whole valence shell. The net total contribution of the neutrons from the last shell, denoted by , is displayed by the dashed line in Fig. 5. It is distributed rather evenly throughout the nuclear interior. Due to the lack of orbitals in the considered shell, it vanishes in the center of the nucleus. The total density distribution in the surface region is determined mostly by the neutrons from the last shell. The contribution of to the neutron mean square radius averages the contributions of all the orbitals of the valence shell. It is peaked around the half-density radius and it has quite a large width, extending to the area outside the nuclear surface. Therefore, the shell as a whole contributes to both the bulk and surface parts of the neutron skin.
III.3 Structure of the tail of the neutron density distribution
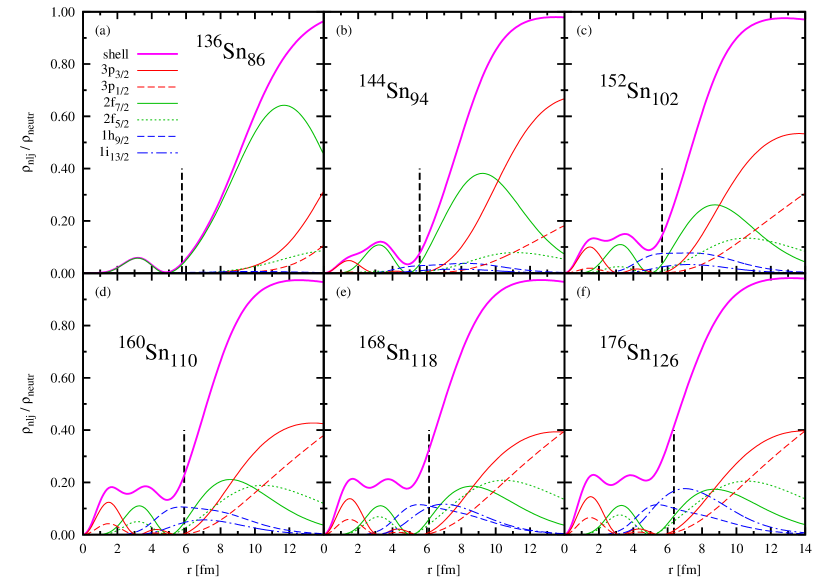
In the previous subsection, we have found that the tail of the density beyond the mean position of the nuclear surface gives a non-negligible contribution to the neutron mean square radii and is significant for the neutron skin formation. Now we will discuss the structure of the tail of the neutron densities along the valence shell of the Sn isotopic chain. In Fig. 6 we have plotted with the thick solid line the ratio of the density of the nucleons from the whole shell to the total neutron density for the few selected Sn isotopes along the considered shell. In all these nuclei, grows from fm and reaches 90% at fm. Hence, the valence nucleons play a dominant role in the structure of the tail of the density distribution.
In Fig. 6 the ratio of the orbital density, defined in Eq. (9), to the total neutron density is also plotted Baran et al. (1997). The huge influence of the single neutrons on the tail of the nuclear density distribution can be noticed. In panel (a) of Fig. 6, the case of 136Sn is shown, where only 4 neutrons mainly from the orbital are present in the last shell. The ratio to the total density reaches around 60% at fm. The contribution of the level in heavier isotopes diminishes in favor of the other orbitals, but even in the heaviest isotopes its maximum remains at the level of a 20% contribution. In all of the isotopes, neutrons from only a few orbitals determine the total density of the nuclear tail. Even as close to the bulk as at half-density radius, selected orbitals share of the total density, e.g. in 176Sn. Despite they accomodate only 6 neutrons, the and levels seem to be dominant in the tail at large distances, where these two levels together account for even 80% of the neutron density.
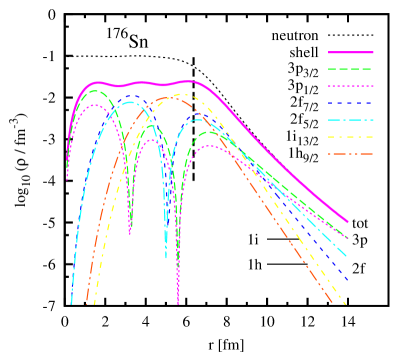
In the analysis of the sp contribution to the tail of the neutron density we cannot forget about the rapid, exponential decrease of the neutron density at large distances outside the nuclear surface. It is depicted in Fig. 7 where the neutron density of the nucleus 176Sn is plotted in logarithmic scale. It can be noticed that beyond fm the neutron density of 176Sn decreases below fm-3, which is 1% of the bulk density. At these distances only neutrons from the valence shell contribute to the total neutron density, which confirms the conclusions deduced from Fig. 6f. When we look into the individual densities of the sp orbitals, also displayed in Fig. 7, we notice that the type of orbital determines the slope of the logarithmic decrease of the sp neutron density. The fall-off of the levels is slower than for the levels and the largest slope is found for the and levels. Thus, the levels participate much more than the low-–high- levels to the total neutron density at very large distances from the center of the nucleus, as expected from their high mean square radii [cf. in panel (c) of Fig. 4 and in Fig. 5]. At distances larger than about 4 fm from the half-density radius, the levels determine the slope of the fall-off of the neutron density. We have to remember that in this region the orbitals still contribute to the neutron rms radii as the densities are weighted by in the calculation of this observable [cf. Eq. (11) and Figs. 4 and 5]. The shape of the tail of the nuclear density is also very important in the analysis of the experiments performed in exotic atoms such as antiprotonic or pionic atoms. The heavy, negative charged particle annihilates at distances around 2 or 3 fm from the nuclear surface Kłos et al. (2007); Friedman et al. (2005); E. Friedman, Hyperfine Interact. 193, 33 .() (2009) and it is highly sensitive to the differences between the neutron and proton density distributions in this region.
In this Section we have studied the correlation between the quantum numbers of the valence neutrons and the neutron skin of Sn isotopes. Neutron orbitals with low principal quantum number and high angular momentum are localized at the nuclear surface. They induce a shift of the neutron half-density radius and increase the bulk contribution to the NST. Neutron levels with high principal quantum number and low angular momentum can be found in the same shell. The outermost bump of their density distribution is localized in the tail of the neutron density profile. It brings about a large contribution to the mean square neutron radii and determines the slope of the logarithmic fall-off of the neutron density outside the surface region. The high-–low- orbitals are responsible for increasing the surface contribution to the NST.
IV Neutron skin in the other isotopic chains
With the experience gained in the previous Section, we analyze on the same footing the other isotopic chains with magic proton number, namely Ca, Ni, Zr, light Sn isotopes and Pb, which are representative of different mass regions.
IV.1 Ca and Ni isotopes with
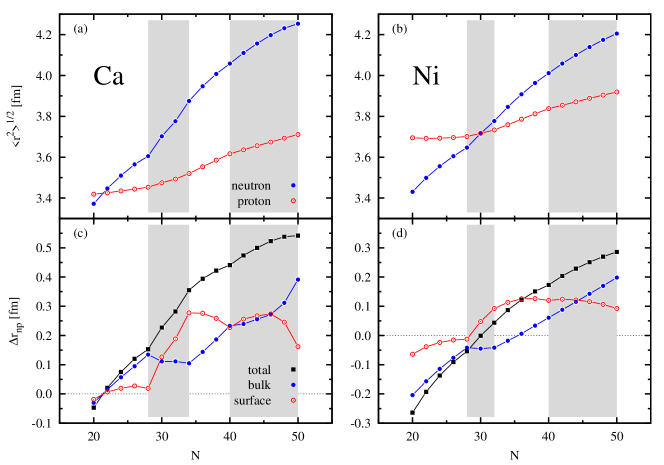
We study Ca and Ni isotopes in the range covering the two major neutron shells and . The neutron drip line of the Ca isotopes is reached at close to the upper limit of the shell, whereas it is shifted to for Ni. In Fig. 8 (a) and (b) we can see, similarly to the case of the Sn isotopes, that the proton rms radius of the Ca and Ni isotopic chains grows rather smoothly, whereas the neutron rms radius increases with a variable slope. The additional 8 protons in Ni make the proton rms radii of this element larger than in Ca by fm. However, the neutron rms radii change very little from Ca to Ni. As a consequence, the NST in the Ni isotopes is around 0.25 fm smaller than in Ca for the same number of neutrons. Indeed, in the neutron-deficient isotopes of Ni from till the NST [as well as its bulk and surface parts, which are plotted in Fig. 8 (c) and (d)] is negative. The total change in absolute value of the NST from to is similar in both the Ni and Ca isotopic chains, that is, around 0.55 fm for Ni and 0.59 fm for Ca.
Looking at the bulk and surface contributions to the NST in Ca and Ni, one sees from Fig. 8 that the largest part of the change of the NST from Ca to Ni comes from the change of between these two elements, whereas changes less from one element to the other element. In fact, in the case of the magic numbers , , and it is seen that the value of is almost equal in Ca and Ni. Thus, the decrease of the NST from Ca to Ni in these nuclei with magic neutron number is produced almost entirely by the decrease of the bulk contribution .
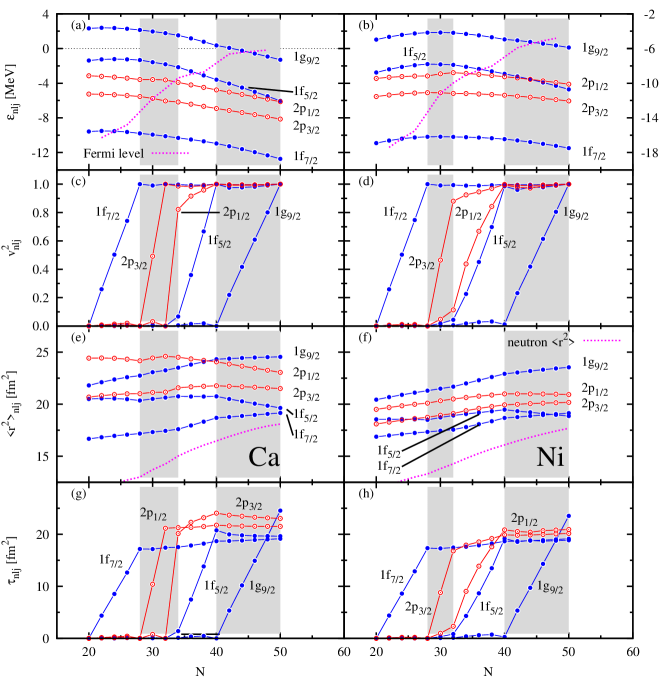
Four intervals of the neutron number are clearly distinguished in the bulk and surface contributions to the NST in Fig. 8 (c) and (d). In the first interval, corresponding to the shell, the bulk contribution to the NST grows almost linearly and the surface contribution remains practically constant. The low-–high- level is populated within this region, as it can be seen from panels (a)–(d) of Fig. 9 which display the position and occupation of the levels close to the Fermi energy for the Ca and Ni isotopes. The second interval of the neutron number ranges from to in Ca and to in Ni. In these nuclei the surface contribution to the NST grows rapidly while the bulk part slightly decreases. The level is being filled mostly in this interval as well as the level in Ca [cf. Fig. 9 (a)–(d)].
The third interval of Fig. 8 covers the isotopes up to where the bulk part of the NST increases and the surface part slightly decreases (Ca) or remains almost constant (Ni). Within this region, in Ca mainly the level is being occupied. The level lies closer to the level in Ni than in Ca, and consequently, these two orbitals in Ni are populated almost simultaneously between and [cf. Fig. 9 (a)–(d)]. Thus, the third interval in neutron number of the Ni isotopes starts already at , rather than at as in Ca. In this third interval of Ni the influence of the orbital on the NST of Ni is overpowered by neutrons from the orbital; one finds a very modest rise of the surface part of the NST while the bulk part grows linearly (see Fig. 8d).
The fourth interval of Fig. 8 ranges between and , where occupation of the level takes place. In Ca between and both the bulk and surface contributions to the NST take a similar value with a slight growing trend with . For larger number of neutrons in the Ca isotopes, increases faster again whereas decreases till reaching . In Ni, from the semimagic number till a clear linear increase of is accompanied by a slow decrease of . This behavior is in agreement with the general trend for the low-–high- orbitals, as in Ni only the level is populated.
The source of the changes in the behavior of the NST becomes clear in Fig. 9 where the sp properties of the valence orbitals are displayed. We can discuss them relying on the analysis performed in the previous Section for Sn isotopes. In Fig. 9 it can be seen that the neutron orbitals in the vicinity of the Fermi level are rather well separated in energy. Hence, we expect quite clear differences in and between neutron number intervals.
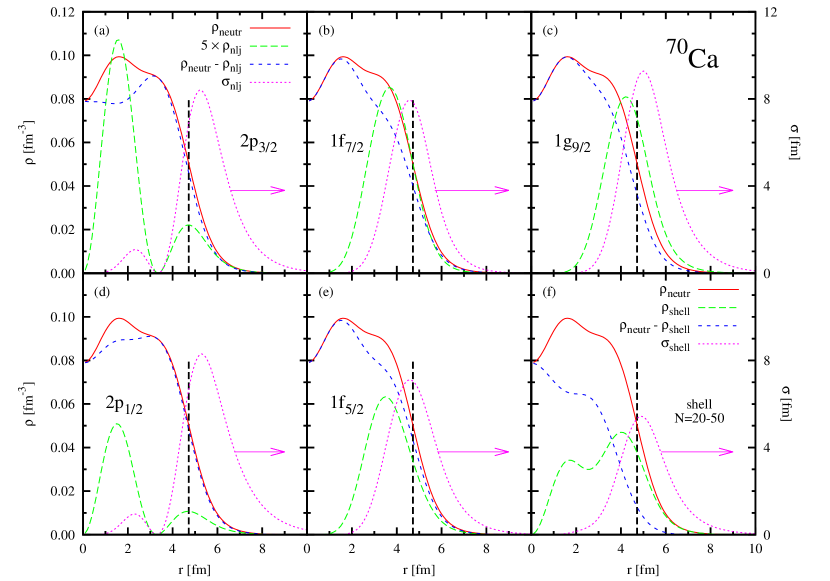
The orbitals of Ca and Ni play a similar role to the levels in Sn. They should contribute mainly to the surface of the neutron distribution. Indeed, a sudden increase of is observed in the second interval of Fig. 8. It can be noticed from Fig. 9 that in Ca and Ni the mean square radii of the levels are similar to those of the neighboring levels, unlike the case of the orbitals in the Sn isotopes. The total neutron density and the sp densities of the individual neutron orbitals defined in Eq. (9), as well as the function defined in Eq. (12), are plotted in Fig. 10 for the 70Ca nucleus. Though the peak of the function of the levels of Ca lies closer to the half-density radius than in the case of the levels of Sn (cf. Fig. 4), the levels still give an important contribution to the tail of the neutron density.
The low-–high- levels , , and are expected to contribute to the NST by increasing the bulk part. In fact, in the first, third, and fourth intervals of Fig. 8 we see a clear increase of . In the Ca chain the last low-–high- orbital is bound only for with energy close to zero, as seen in panel (a) of Fig. 9. The continuum affects the behavior of the Ca orbital at large distances from the nuclear center. This almost unbound orbital extends to a region far away from the nucleus. Consequently, the tail of the function for the level (see panel (c) of Fig. 10) is larger than for the levels (central panels of Fig. 10). Hence, a relatively large impact of the level in the surface contribution to the NST of the Ca isotopes beyond is observed in Fig. 8c. On the other hand, in Ni isotopes the level is shifted down by around 5 MeV in comparison to Ca owing to the larger number of protons in Ni. Its energy is far below zero and therefore in Ni the neutron skin splitting in bulk and surface parts for this low-–high- orbital is not disturbed by the influence of the continuum, unlike in Ca.
IV.2 Zr and Sn isotopes with
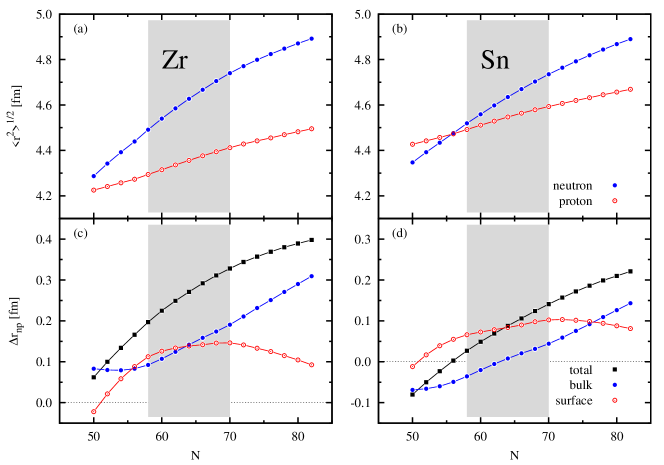
We have considered the shell with neutrons in the Zr and Sn elements Viñas et al. (2012). The neutron drip line of the Zr isotopes is reached at the end of this range. In Fig. 11 we can see again the roughly linear increase of the proton rms radii with larger , whereas the neutron rms radii, as well as the NST, rise with a rather curved shape. We can also see that the difference in proton number between the two elements affects mainly the proton rms radii, shifting them by a practically constant value of around 0.2 fm along the shell. The neutron rms radii, however, remain very similar in the two elements. As a consequence, the NST decreases from Zr to Sn by the same amount as the proton radii increase from Zr to Sn.
If we compare the values of the bulk and surface contributions to the NST in Zr with the values of these contributions in Sn, it turns out that the bulk contribution has decreased from Zr to Sn by a roughly constant shift of 0.15 fm, whereas the surface contribution remains almost the same or decreases by no more than 0.05 fm from Zr to Sn. Altogether, it implies that the change of the NST between the two elements takes place, in essence, through the modification of the sharp radius of the proton density distribution caused by the different proton number, whereas the surface diffuseness remains less affected. Actually, it is interesting to observe that in the nuclei with neutron magic number ( and ) the value of is practically identical in Zr and Sn, which means that in these nuclei the change of between Zr and Sn is exclusively due to the change of . These observations are in consonance with what we had found before in the study of the NST in Ca and Ni.
The bulk and the surface contributions to the NST in the Zr and Sn isotopes, unlike in the previously discussed Ca and Ni elements, change their slopes rather smoothly without any kinks in the graph [see Fig. 11 (c) and (d)]. Nevertheless, three intervals can be distinguished. In the first interval, up to , the surface part grows linearly. In the second interval with , the surface contribution is roughly constant around its maximal value. In the third interval, beyond , decreases. The bulk contribution remains practically constant up to and for heavier isotopes it increases linearly up to the end of the shell.
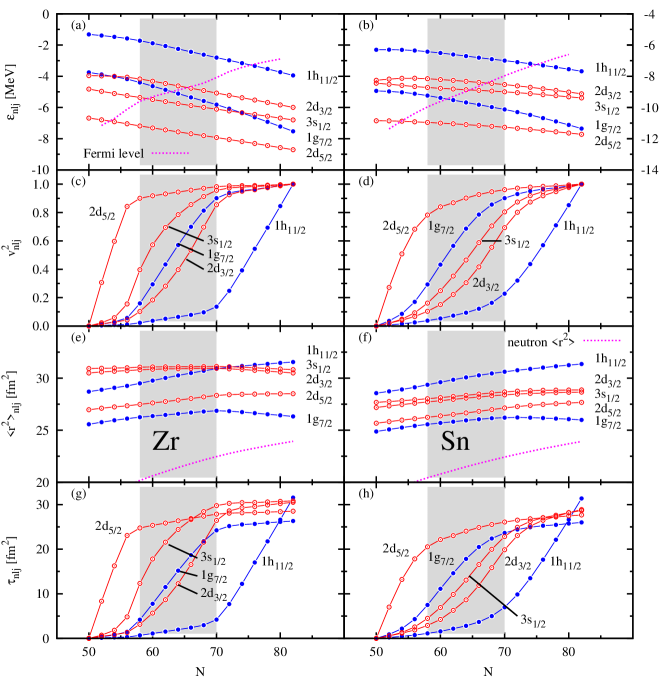
Five levels from the major shell with can be found in the energy spectrum of the Zr and Sn isotopes, as displayed in Fig. 12. There are two low-–high- levels: and , and three high-–low- levels: , , and . In the first interval till , the level is being filled almost without interference from the other orbitals [see panels (c) and (d) of Fig. 12]. Similarly, in the last interval beyond mainly the level is being populated. It explains the behavior shown in Figs. 11c and 11d by the bulk and surface contributions to the NST in the regions between and of the Zr and Sn isotopic chains. In the intermediate region between and , the contribution of the level almost saturates and the level practically does not yet contribute to the neutron radii. The remaining , , and levels play the main role in this interval. The influence of the and orbitals keeps from falling down, whereas the presence of the orbital makes to increase.
IV.3 Pb isotopes with
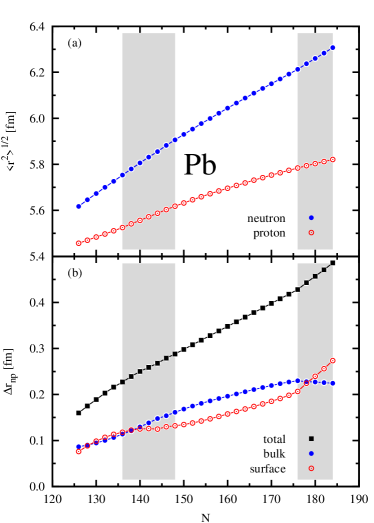
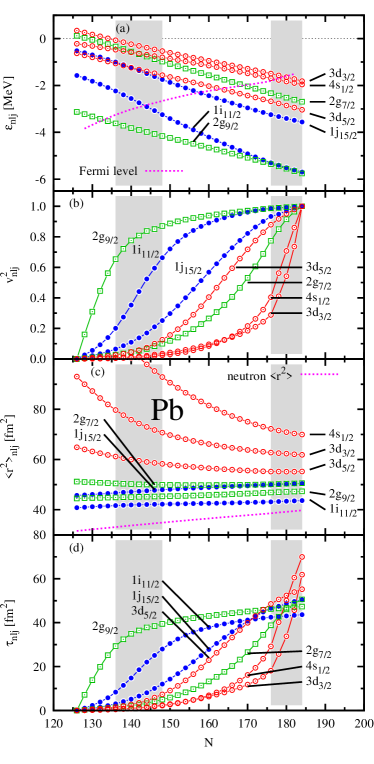
The last element considered in this article is Pb. We concentrate on neutron-rich isotopes with . The Pb neutron drip line is reached at the end of this shell. In Fig. 13 we can see an almost linear behavior of the rms radii for both protons and neutrons. Also the NST and its bulk and surface contributions are overall roughly linear with . As it can be seen in Fig. 14, the large level density around the Fermi energy in these heavy nuclei causes the occupancy of all orbitals to rise along the whole shell. Hence, the influence of the sp properties onto the nuclear surface is smoothed out in this element. Nevertheless, the slight changes of the slope of the bulk and surface contributions to the NST, which can be seen in panel (b) of Fig. 13, allow one to divide the shell into four regions. In order to explain these variations we shall look into the orbitals from this valence shell, which are displayed in Fig. 14. There are seven different levels in this shell. We classify them into three groups: the low-–high- levels and , the transitional levels and , and the high-–low- levels , , and . Although the occupancy of all levels changes throughout the shell, in each interval the occupancy of some orbitals increases much faster than the occupancy of the other orbitals.
In the first interval, up to , the bulk and the surface parts of the NST increase with a similar slope. The occupancy of the transitional level grows very fast here. In the second region, between and 148, the low-–high- level is mostly populated. This fact is related with the observed faster increase of the bulk contribution than of the surface contribution in this second region. In the third interval, with , mainly three orbitals of different type, i.e., the , , and orbitals, are populated between and 176. Their impact on the neutron skin properties is mixed and the slopes of and are similar again. Finally, for , the surface part grows faster while the bulk part slightly decreases. In this region, two levels of the high-–low- type ( and ) rapidly increase their occupancy. Their influence is magnified by their relatively large sp mean square radii ( fm2), which can be seen in panel (c) of Fig. 14. It explains the fast increase of the surface part of the NST in this region. In spite of the small multiplicity of these levels (6 neutrons only), in the closed shell nucleus with one finds the largest values for the and orbitals (see Fig. 14d).
V Conclusions
We have studied the influence of the properties of the single-particle orbitals of neutrons filling the valence shell on the nuclear surface and the neutron skin. The spherical density distributions obtained with the SLy4 mean-field interaction for the elements Ca, Ni, Zr, Sn, and Pb were examined in our investigation. Though the basic results emphasized here are general enough, the fine details may depend to some extent on the nuclear interaction.
The single-particle mean square radii of neutron valence-shell orbitals are typically larger than the total neutron mean square radius of the nucleus. These neutron orbitals impact on the nuclear surface mainly by shifting or modifying the fall-off of the neutron density distribution. Hence, the single-particle shell structure induces changes in the behavior of the neutron skin thickness with respect to the smooth trend of the neutron skin described by models of average nuclear properties such as the droplet model.
The splitting of the neutron skin thickness into bulk and surface contributions is useful because it allows one to describe in a relatively simple way how the neutron skin is formed. When levels with low principal quantum number and large angular momentum are populated, the bulk part of the neutron skin thickness tends to grow fast. The neutrons from such orbitals are mainly localized at the surface of the neutron density. They basically shift the position of the neutron surface outwards without altering the density slope.
The single-particle density distribution of neutrons from orbitals with high and low has a bump beyond the neutron half-density radius of the nucleus. It enhances the diffuseness of the nuclear surface and the surface contribution to the neutron skin thickness. These levels play also a dominant role in the tail of the neutron density distribution at distances a few fm outside the surface. They govern the slope of the exponential fall-off of the neutron density in this region.
Neutron orbitals such as in the valence shell of Sn or in the valence shell of Pb, have a very large single-particle mean square radius compared with the neighboring neutron orbitals. It magnifies the role of these levels in increasing the surface contribution to the neutron skin thickness despite the comparatively low number of neutrons that can be accomodated in them.
In this paper we have analyzed in detail the impact of the single-particle structure on the neutron skin thickness assuming spherical symmetry. However, this condition is not always met in the whole range of mass and atomic numbers considered here, as in the case of some of the Zr isotopes. It is known that nuclear deformations are another factor that can induce deviations of the neutron skin thickness from the average trend Warda et al. (1998). The study of the effects of deformation is left for a future work.
VI Acknowledgements
This work has been partially funded by the Spanish Consolider-Ingenio 2010 Programme CPAN CSD2007-00042, by Grant No. FIS2011-24154 from MICINN and FEDER (Spain), and by Grant No. 2009SGR-1289 from Generalitat de Catalunya.
References
- Fricke et al. (1995) G. Fricke, C. Bernhardt, K. Heilig, L. Schaller, L. Schellenberg, E. Shera, and C. Dejager, At. Data and Nucl. Data Tables 60, 177 (1995).
- Vries et al. (1987) H. D. Vries, C. D. Jager, and C. D. Vries, Atomic Data and Nuclear Data Tables 36, 495 (1987).
- Angeli and Marinova (2013) I. Angeli and K. Marinova, Atomic Data and Nuclear Data Tables 99, 69 (2013).
- G. W. Hoffmann et al., Phys. Rev. C 21, 1488 () (1980) G. W. Hoffmann et al., Phys. Rev. C 21, 1488 (1980).
- B. C. Clark, L. J. Kerr, and S. Hama, Phys. Rev. C 67, 054605 () (2003) B. C. Clark, L. J. Kerr, and S. Hama, Phys. Rev. C 67, 054605 (2003).
- Batty et al. (1995) C. Batty, E. Friedman, and A. Gal, Nuclear Physics A 592, 487 (1995).
- Krasznahorkay et al. (2004) A. Krasznahorkay, H. Akimune, A. van den Berg, N. Blasi, S. Brandenburg, M. Csatlós, M. Fujiwara, J. Gulyás, M. Harakeh, M. Hunyadi, et al., Nucl. Phys. A 731, 224 (2004).
- A. Trzcińska, J. Jastrzȩbski, P. Lubiński, F. J. Hartmann, R. Schmidt, T. von Egidy, and B. Kłos, Phys. Rev. Lett. 87, 082501 () (2001) A. Trzcińska, J. Jastrzȩbski, P. Lubiński, F. J. Hartmann, R. Schmidt, T. von Egidy, and B. Kłos, Phys. Rev. Lett. 87, 082501 (2001).
- Jastrzȩbski et al. (2004) J. Jastrzȩbski, A. Trzcińska, P. Lubiński, B. Kłos, F. J. Hartmann, T. von Egidy, and S. Wycech, Int. J. Mod. Phys. E 13, 343 (2004).
- Kłos et al. (2007) B. Kłos, A. Trzcińska, J. Jastrzȩbski, T. Czosnyka, M. Kisieliński, P. Lubiński, P. Napiorkowski, L. Pieńkowski, F. J. Hartmann, B. Ketzer, et al., Phys. Rev. C 76, 014311 (2007).
- A. Klimkiewicz, et al., Acta Phys. Pol. B 40, 589 () (2009) A. Klimkiewicz, et al., Acta Phys. Pol. B 40, 589 (2009).
- Zenihiro et al. (2010) J. Zenihiro, H. Sakaguchi, T. Murakami, M. Yosoi, Y. Yasuda, S. Terashima, Y. Iwao, H. Takeda, M. Itoh, H. P. Yoshida, et al., Phys. Rev. C 82, 044611 (2010).
- D. P. Watts for the CrystalBall@MAMI Collaboration (2012) D. P. Watts for the CrystalBall@MAMI Collaboration, EPJ Web of Conferences 37, 01027 (2012).
- C.M. Tarbert et al. , arXiv:1311.0168() (2013) C.M. Tarbert et al. (2013), arXiv:1311.0168.
- Abrahamyan et al. (2012) S. Abrahamyan, Z. Ahmed, H. Albataineh, K. Aniol, D. S. Armstrong, W. Armstrong, T. Averett, B. Babineau, A. Barbieri, V. Bellini, et al. (PREX Collaboration), Phys. Rev. Lett. 108, 112502 (2012).
- Horowitz et al. (2014) C. Horowitz, K. Kumar, and R. Michaels, Eur. Phys. J. A 50, 48 (2014).
- Sfienti (2013) C. Sfienti (2013), talk given at the “Workshop to Explore Physics Opportunities with Intense, Polarized Electron Beams up to 300 MeV” and “Calcium Radius Experiment (CREX) Workshop at Jefferson Lab”.
- Centelles et al. (2009) M. Centelles, X. Roca-Maza, X. Viñas, and M. Warda, Phys. Rev. Lett. 102, 122502 (2009).
- Warda et al. (2009) M. Warda, X. Viñas, X. Roca-Maza, and M. Centelles, Phys. Rev. C 80, 024316 (2009).
- Chen et al. (2005) L.-W. Chen, C. M. Ko, and B.-A. Li, Phys. Rev. Lett. 94, 032701 (2005).
- Furnstahl (2002) R. Furnstahl, Nucl. Phys. A 706, 85 (2002).
- Kortelainen et al. (2013) M. Kortelainen, J. Erler, W. Nazarewicz, N. Birge, Y. Gao, and E. Olsen, Phys. Rev. C 88, 031305 (2013).
- Zhang and Chen (2013) Z. Zhang and L.-W. Chen, Phys. Lett. B 726, 234 (2013).
- Piekarewicz (2014) J. Piekarewicz, Eur. Phys. J. A 50, 25 (2014).
- Colò et al. (2014) G. Colò, U. Garg, and H. Sagawa, Eur. Phys. J. A 50, 26 (2014).
- Trippa et al. (2008) L. Trippa, G. Colò, and E. Vigezzi, Phys. Rev. C 77, 061304 (2008).
- X. Roca-Maza et al., Phys. Rev. C 88, 024316 () (2013) X. Roca-Maza et al., Phys. Rev. C 88, 024316 (2013).
- Klimkiewicz et al. (2007) A. Klimkiewicz, N. Paar, P. Adrich, M. Fallot, K. Boretzky, T. Aumann, D. Cortina-Gil, U. D. Pramanik, T. W. Elze, H. Emling, et al. (LAND Collaboration), Phys. Rev. C 76, 051603 (2007).
- Roca-Maza et al. (2012) X. Roca-Maza, G. Pozzi, M. Brenna, K. Mizuyama, and G. Colò, Phys. Rev. C 85, 024601 (2012).
- Vretenar et al. (2012) D. Vretenar, Y. F. Niu, N. Paar, and J. Meng, Phys. Rev. C 85, 044317 (2012).
- Alex Brown (2000) B. Alex Brown, Phys. Rev. Lett. 85, 5296 (2000).
- Typel and Brown (2001) S. Typel and B. A. Brown, Phys. Rev. C 64, 027302 (2001).
- Dieperink et al. (2003) A. E. L. Dieperink, Y. Dewulf, D. Van Neck, M. Waroquier, and V. Rodin, Phys. Rev. C 68, 064307 (2003).
- S. S. Avancini, J. R. Marinelli, D. P. Menezes, M. M. W. Moraes, and C. Providência, Phys. Rev. C 75, 055805 .() (2007) S. S. Avancini, J. R. Marinelli, D. P. Menezes, M. M. W. Moraes, and C. Providência, Phys. Rev. C 75, 055805 (2007).
- Centelles et al. (2010) M. Centelles, X. Roca-Maza, X. Viñas, and M. Warda, Phys. Rev. C 82, 054314 (2010).
- Roca-Maza et al. (2011) X. Roca-Maza, M. Centelles, X. Viñas, and M. Warda, Phys. Rev. Lett. 106, 252501 (2011).
- Viñas et al. (2014) X. Viñas, M. Centelles, X. Roca-Maza, and M. Warda, Eur. Phys. J. A 50, 27 (2014).
- Gaidarov et al. (2012) M. K. Gaidarov, A. N. Antonov, P. Sarriguren, and E. M. de Guerra, Phys. Rev. C 85, 064319 (2012).
- Gaitanos et al. (2004) T. Gaitanos, M. D. Toro, S. Typel, V. Baran, C. Fuchs, V. Greco, and H. H. Wolter, Nuclear Physics A 732, 24 (2004).
- Shetty et al. (2007) D. V. Shetty, S. J. Yennello, and G. A. Souliotis, Phys. Rev. C 76, 024606 (2007).
- Li et al. (2008) B.-A. Li, L.-W. Chen, and C. M. Ko, Physics Reports 464, 113 (2008).
- Tsang et al. (2009) M. B. Tsang, Y. Zhang, P. Danielewicz, M. Famiano, Z. Li, W. G. Lynch, and A. W. Steiner, Phys. Rev. Lett. 102, 122701 (2009).
- Vretenar et al. (2000) D. Vretenar, P. Finelli, A. Ventura, G. A. Lalazissis, and P. Ring, Phys. Rev. C 61, 064307 (2000).
- Horowitz et al. (2001) C. J. Horowitz, S. J. Pollock, P. A. Souder, and R. Michaels, Phys. Rev. C 63, 025501 (2001).
- Moreno et al. (2010) O. Moreno, E. M. de Guerra, P. Sarriguren, and J. M. Udías, Journal of Physics G: Nuclear and Particle Physics 37, 064019 (2010).
- J. Liu, Z. Ren, and T. Dong, Nucl. Phys. A 888, 45 ; Nucl. Phys. A 900, 1 (2013).() (2012) J. Liu, Z. Ren, and T. Dong, Nucl. Phys. A 888, 45 (2012); Nucl. Phys. A 900, 1 (2013).
- A. Meucci, M. Vorabbi, C. Giusti, F. D. Pacati, and P. Finelli, Phys. Rev. C 87, 054620 .() (2013) A. Meucci, M. Vorabbi, C. Giusti, F. D. Pacati, and P. Finelli, Phys. Rev. C 87, 054620 (2013).
- D. Vretenar, G. A. Lalazissis, and P. Ring, Phys. Rev. C 62, 045502 .() (2000) D. Vretenar, G. A. Lalazissis, and P. Ring, Phys. Rev. C 62, 045502 (2000).
- Sil et al. (2005) T. Sil, M. Centelles, X. Viñas, and J. Piekarewicz, Phys. Rev. C 71, 045502 (2005).
- C. J. Horowitz and J. Piekarewicz, Phys. Rev. Lett. 86, 5647 ; Phys. Rev. C 64, 062802 (2001).() (2001) C. J. Horowitz and J. Piekarewicz, Phys. Rev. Lett. 86, 5647 (2001); Phys. Rev. C 64, 062802 (2001).
- Lattimer and Prakash (2004) J. M. Lattimer and M. Prakash, Science 304, 536 (2004).
- Lattimer and Prakash (2007) J. M. Lattimer and M. Prakash, Phys. Rep. 442, 109 (2007), the Hans Bethe Centennial Volume 1906-2006.
- C. Ducoin, J. Margueron, C. Providência, and I. Vidaña, Phys. Rev. C 83, 045810 .() (2011) C. Ducoin, J. Margueron, C. Providência, and I. Vidaña, Phys. Rev. C 83, 045810 (2011).
- Loan et al. (2011) D. T. Loan, N. H. Tan, D. T. Khoa, and J. Margueron, Phys. Rev. C 83, 065809 (2011).
- Warda et al. (1998) M. Warda, B. Nerlo-Pomorska, and K. Pomorski, Nucl. Phys. A 635, 484 (1998).
- Jiang et al. (2007) W.-Z. Jiang, B.-A. Li, and L.-W. Chen, Phys. Rev. C 76, 054314 (2007).
- Warda et al. (2010) M. Warda, X. Viñas, X. Roca-Maza, and M. Centelles, Phys. Rev. C 81, 054309 (2010).
- Myers and Świa̧tecki (1980) W. D. Myers and W. J. Świa̧tecki, Nucl. Phys. A 336, 267 (1980).
- Świa̧tecki et al. (2005) W. J. Świa̧tecki, A. Trzcińska, and J. Jastrzȩbski, Phys. Rev. C 71, 047301 (2005).
- Viñas et al. (2012) X. Viñas, M. Warda, M. Centelles, and X. Roca-Maza, Int. J. Mod. Phys. E 21, 1250029 (2012).
- Mizutori et al. (2000) S. Mizutori, J. Dobaczewski, G. A. Lalazissis, W. Nazarewicz, and P.-G. Reinhard, Phys. Rev. C 61, 044326 (2000).
- Roca-Maza et al. (2008) X. Roca-Maza, M. Centelles, F. Salvat, and X. Viñas, Phys. Rev. C 78, 044332 (2008).
- Roca-Maza et al. (2013) X. Roca-Maza, M. Centelles, F. Salvat, and X. Viñas, Phys. Rev. C 87, 014304 (2013).
- Chabanat et al. (1998) E. Chabanat, P. Bonche, P. Haensel, J. Meyer, and R. Schaeffer, Nucl. Phys. A 635, 231 (1998).
- cha (1998) Nucl. Phys. A 643, 441 (1998).
- J. Erler, N. Birge, M. Kortelainen, W. Nazarewicz, E. Olsen, A. M. Perhac, and M. Stoitsov, Nature 486, 509 .() (2012) J. Erler, N. Birge, M. Kortelainen, W. Nazarewicz, E. Olsen, A. M. Perhac, and M. Stoitsov, Nature 486, 509 (2012).
- Stoitsov et al. (2003) M. V. Stoitsov, J. Dobaczewski, W. Nazarewicz, S. Pittel, and D. J. Dean, Phys. Rev. C 68, 054312 (2003).
- Del Estal et al. (2001) M. Del Estal, M. Centelles, X. Viñas, and S. K. Patra, Phys. Rev. C 63, 044321 (2001).
- (69) R. W. Hasse and W. D. Myers, Geometrical relationships of macroscopic nuclear physics, Springer-Verlag, Heidelberg, 1988.
- Friedman et al. (2005) E. Friedman, A. Gal, and J. Mares, Nuclear Physics A 761, 283 (2005).
- E. Friedman, Hyperfine Interact. 193, 33 .() (2009) E. Friedman, Hyperfine Interact. 193, 33 (2009).
- W. D. Myers and W. J. Świa̧tecki, Ann. Phys. 55, 395 (1969); Ann. Phys. (N.Y.) 84, 186 (1974).() (N.Y.) W. D. Myers and W. J. Świa̧tecki, Ann. Phys. (N.Y.) 55, 395 (1969); Ann. Phys. (N.Y.) 84, 186 (1974).
- W. D. Myers, Droplet Model of Atomic Nuclei () (Plenum, New York, 1977) W. D. Myers, Droplet Model of Atomic Nuclei (Plenum, New York, 1977).
- Schunck and Egido (2008) N. Schunck and J. L. Egido, Phys. Rev. C 78, 064305 (2008).
- Baran et al. (1997) A. Baran, K. Pomorski, and M. Warda, Z. Phys. A 357, 33 (1997).